Technical analysis by SOAM_PRO_TRADER about Symbol BTC: Buy recommendation (8/25/2025)

SOAM_PRO_TRADER
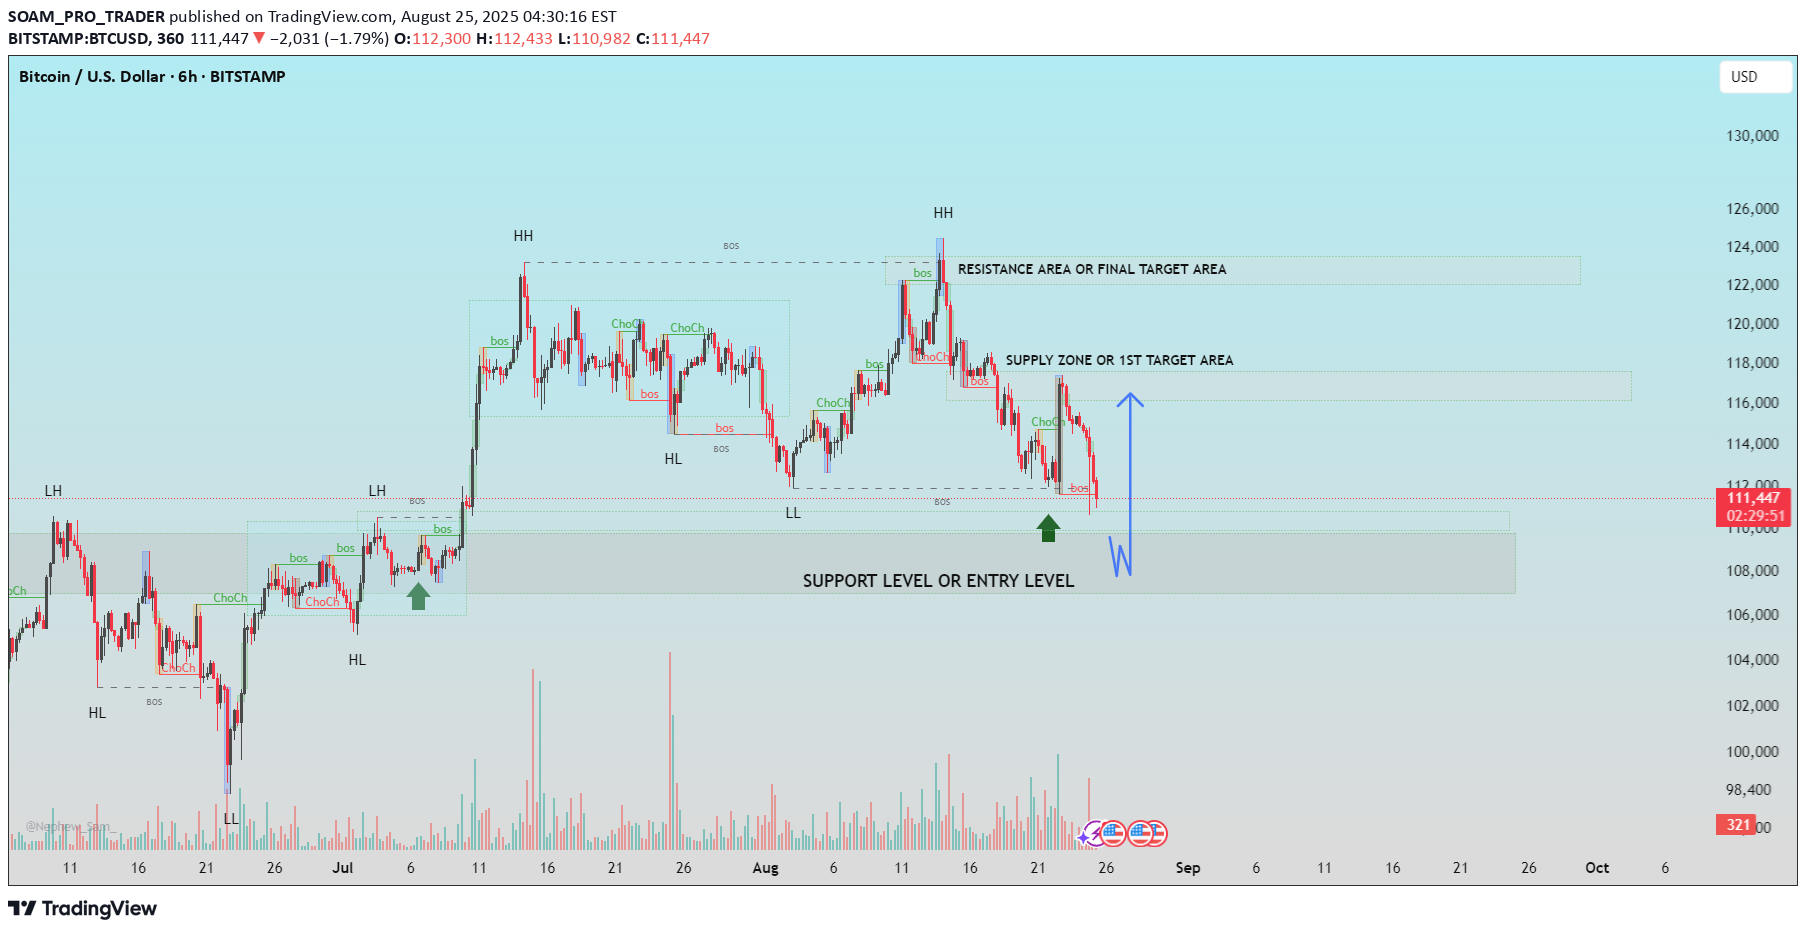
🔹 Bitcoin (BTC/USD) – 6H Technical Analysis 1. Market Structure The chart shows a transition phase after forming a Higher High (HH) and then dropping to a Lower Low (LL). This indicates a potential change in trend or a deep correction within the larger bullish structure. Price is currently hovering near a key support zone, where a reaction is expected. 2. Key Support Level (Entry Zone) * Zone: $109,000 - $108,000 This area is marked as a major support level, where previous demand pushed price higher. If buyers defend this zone again, it could serve as an entry point for a possible long position. Failure to hold this level could lead to further downside. 3. Supply Zone / First Target * Zone: $116,000 - $118,000 This is the first target area for any bullish bounce. It acted as a strong resistance in the past and could provide selling pressure again. 4. Resistance Area / Final Target * Zone: $122,000 - $124,000 This is the final bullish target zone, where price faced rejection previously. If the price reaches this level, it may consolidate or reverse depending on the market momentum. 5. Possible Price Scenario * Bullish Scenario: If BTC holds above the $108,000 support zone, expect a rebound toward the supply zone at $116K and possibly the final resistance at $122K. * Bearish Scenario: A clean break and close below $108,000 will invalidate the bullish setup and may open doors to deeper correction. 6. Bias Currently bullish above $108,000, but turning bearish below this level. If this helpful for you, press the like button.400 pips+ secured ,700 pips+ secured,
