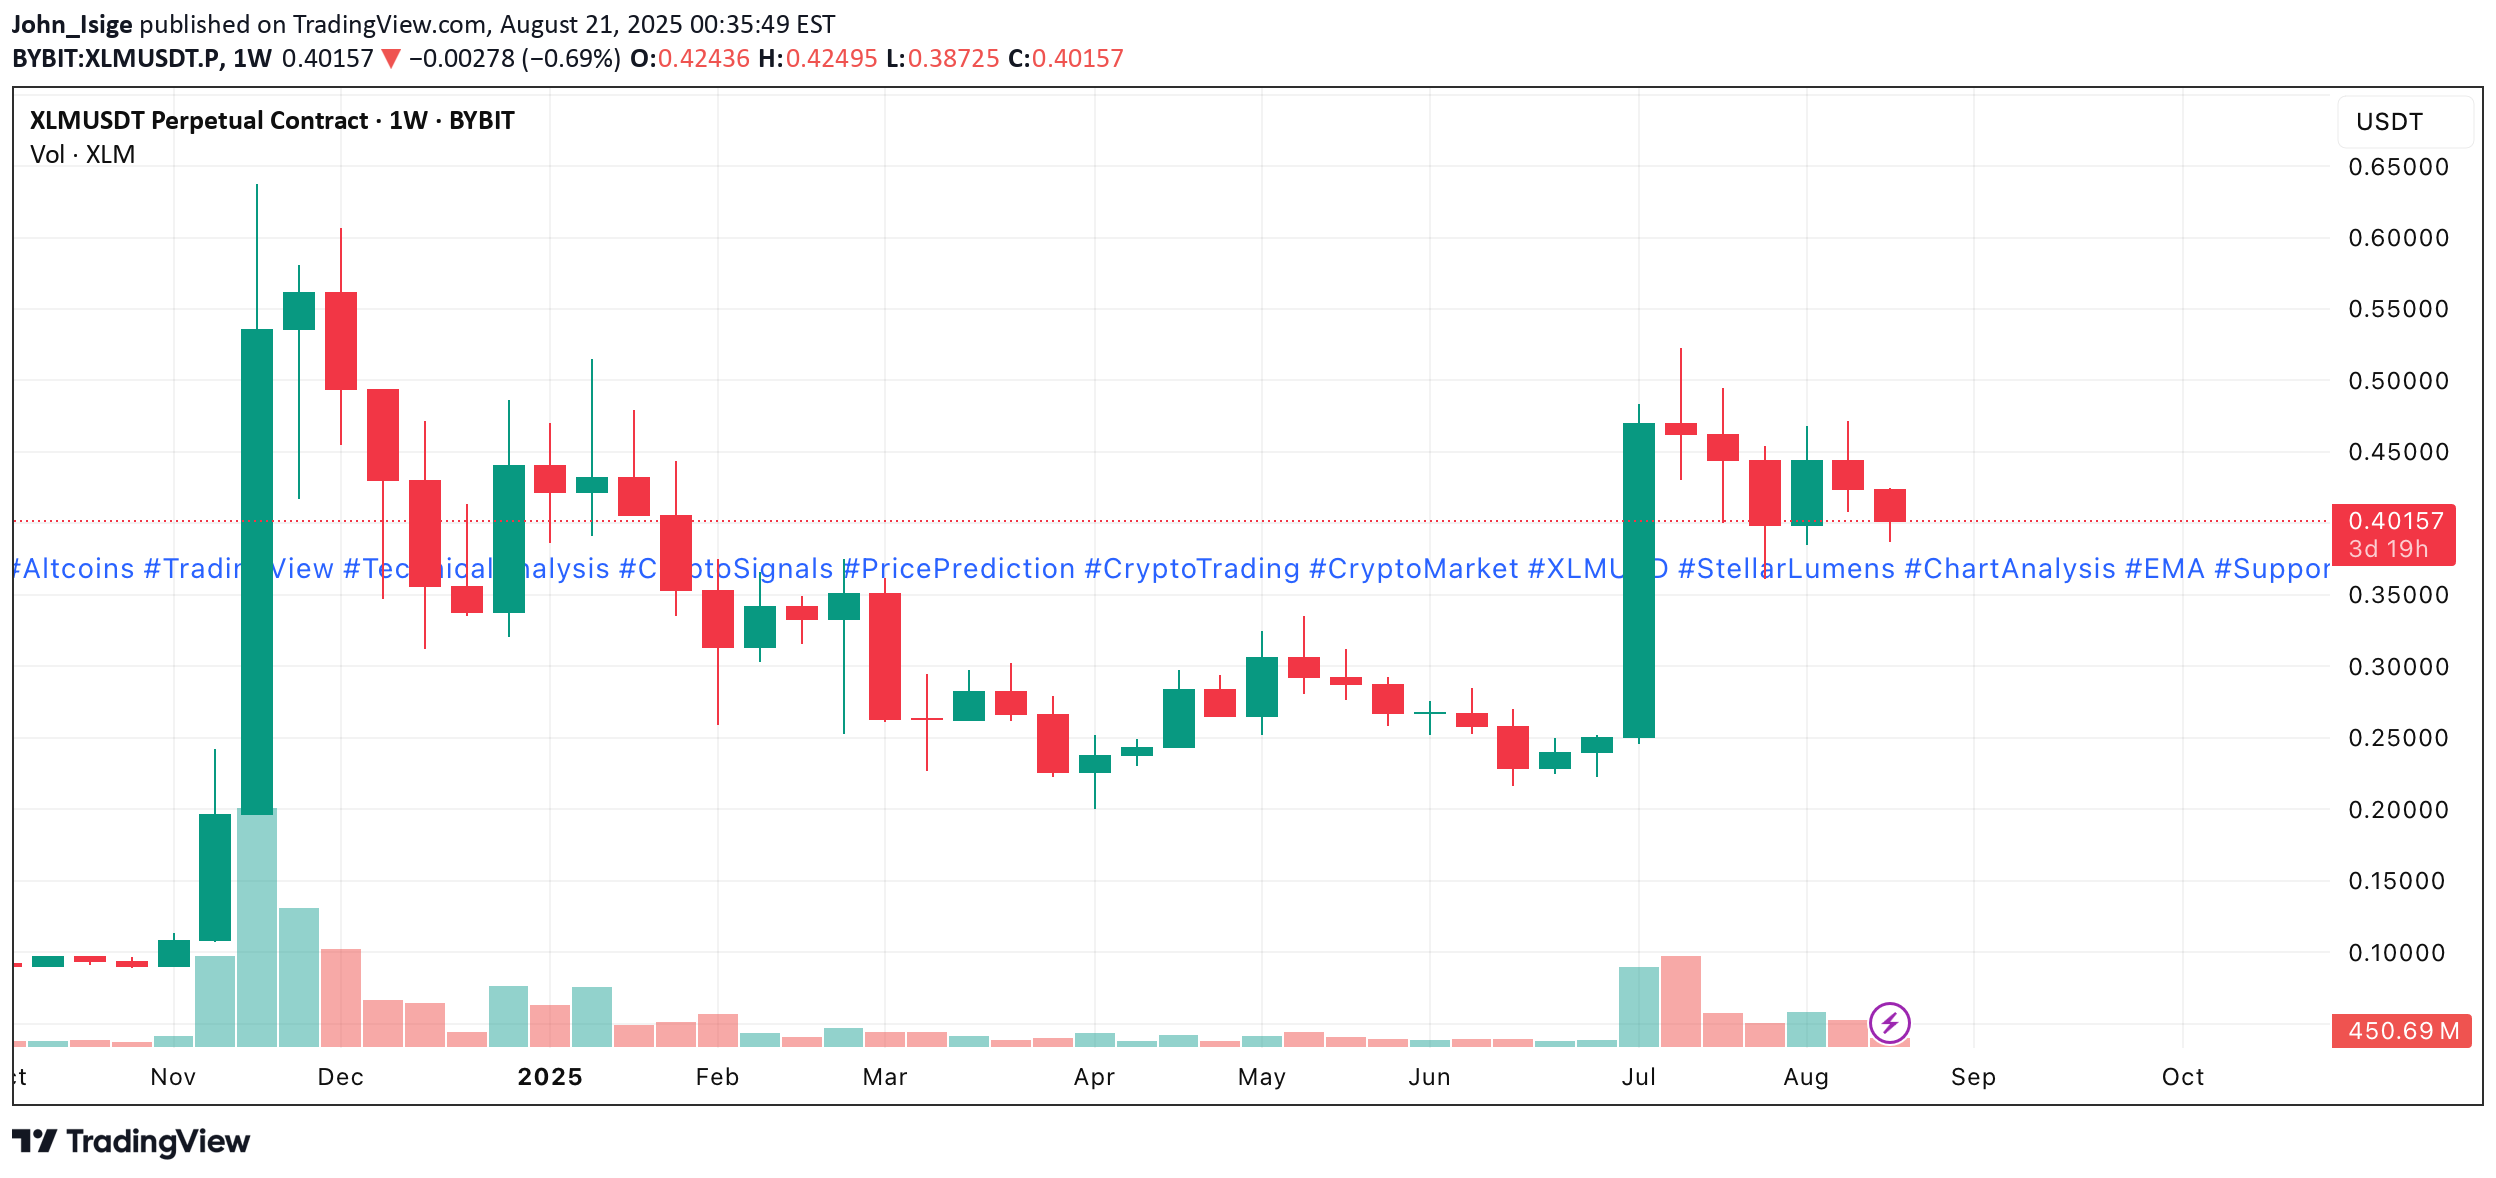
Technical analysis by John_Isige about Symbol XLM on 8/21/2025
https://sahmeto.com/message/3728179

Daily Chart •Price leaning on 50-day EMA (critical support). •Holding → could evolve into symmetrical triangle → bullish breakout potential. •Breakdown → targets $0.35 (confluence of liquidity zone + 200-day EMA). •Indicators: RSI < 50 (weak momentum), MACD negative. •Bias: Neutral, dependent on BTC trend. 4H Chart •Price broke below 50 EMA & 200 EMA → now resistance. •Rejection at retest = confirms bearish structure. •Relief signs: RSI oversold, MACD negative momentum fading → possible short-term bounce. •Bullish condition: reclaim 50 & 200 EMA as support. •Bearish condition: failure = continued downside toward $0.35. Key Levels •Resistance: $0.39 / $0.42 •Support: $0.35 / $0.32
Translated from: English
Show Original Message
Signal Type: Neutral
Time Frame:
1 weekPrice at Publish Time:
$0.40127