Technical analysis by ScottMelker about Symbol BTC on 8/20/2025

ScottMelker
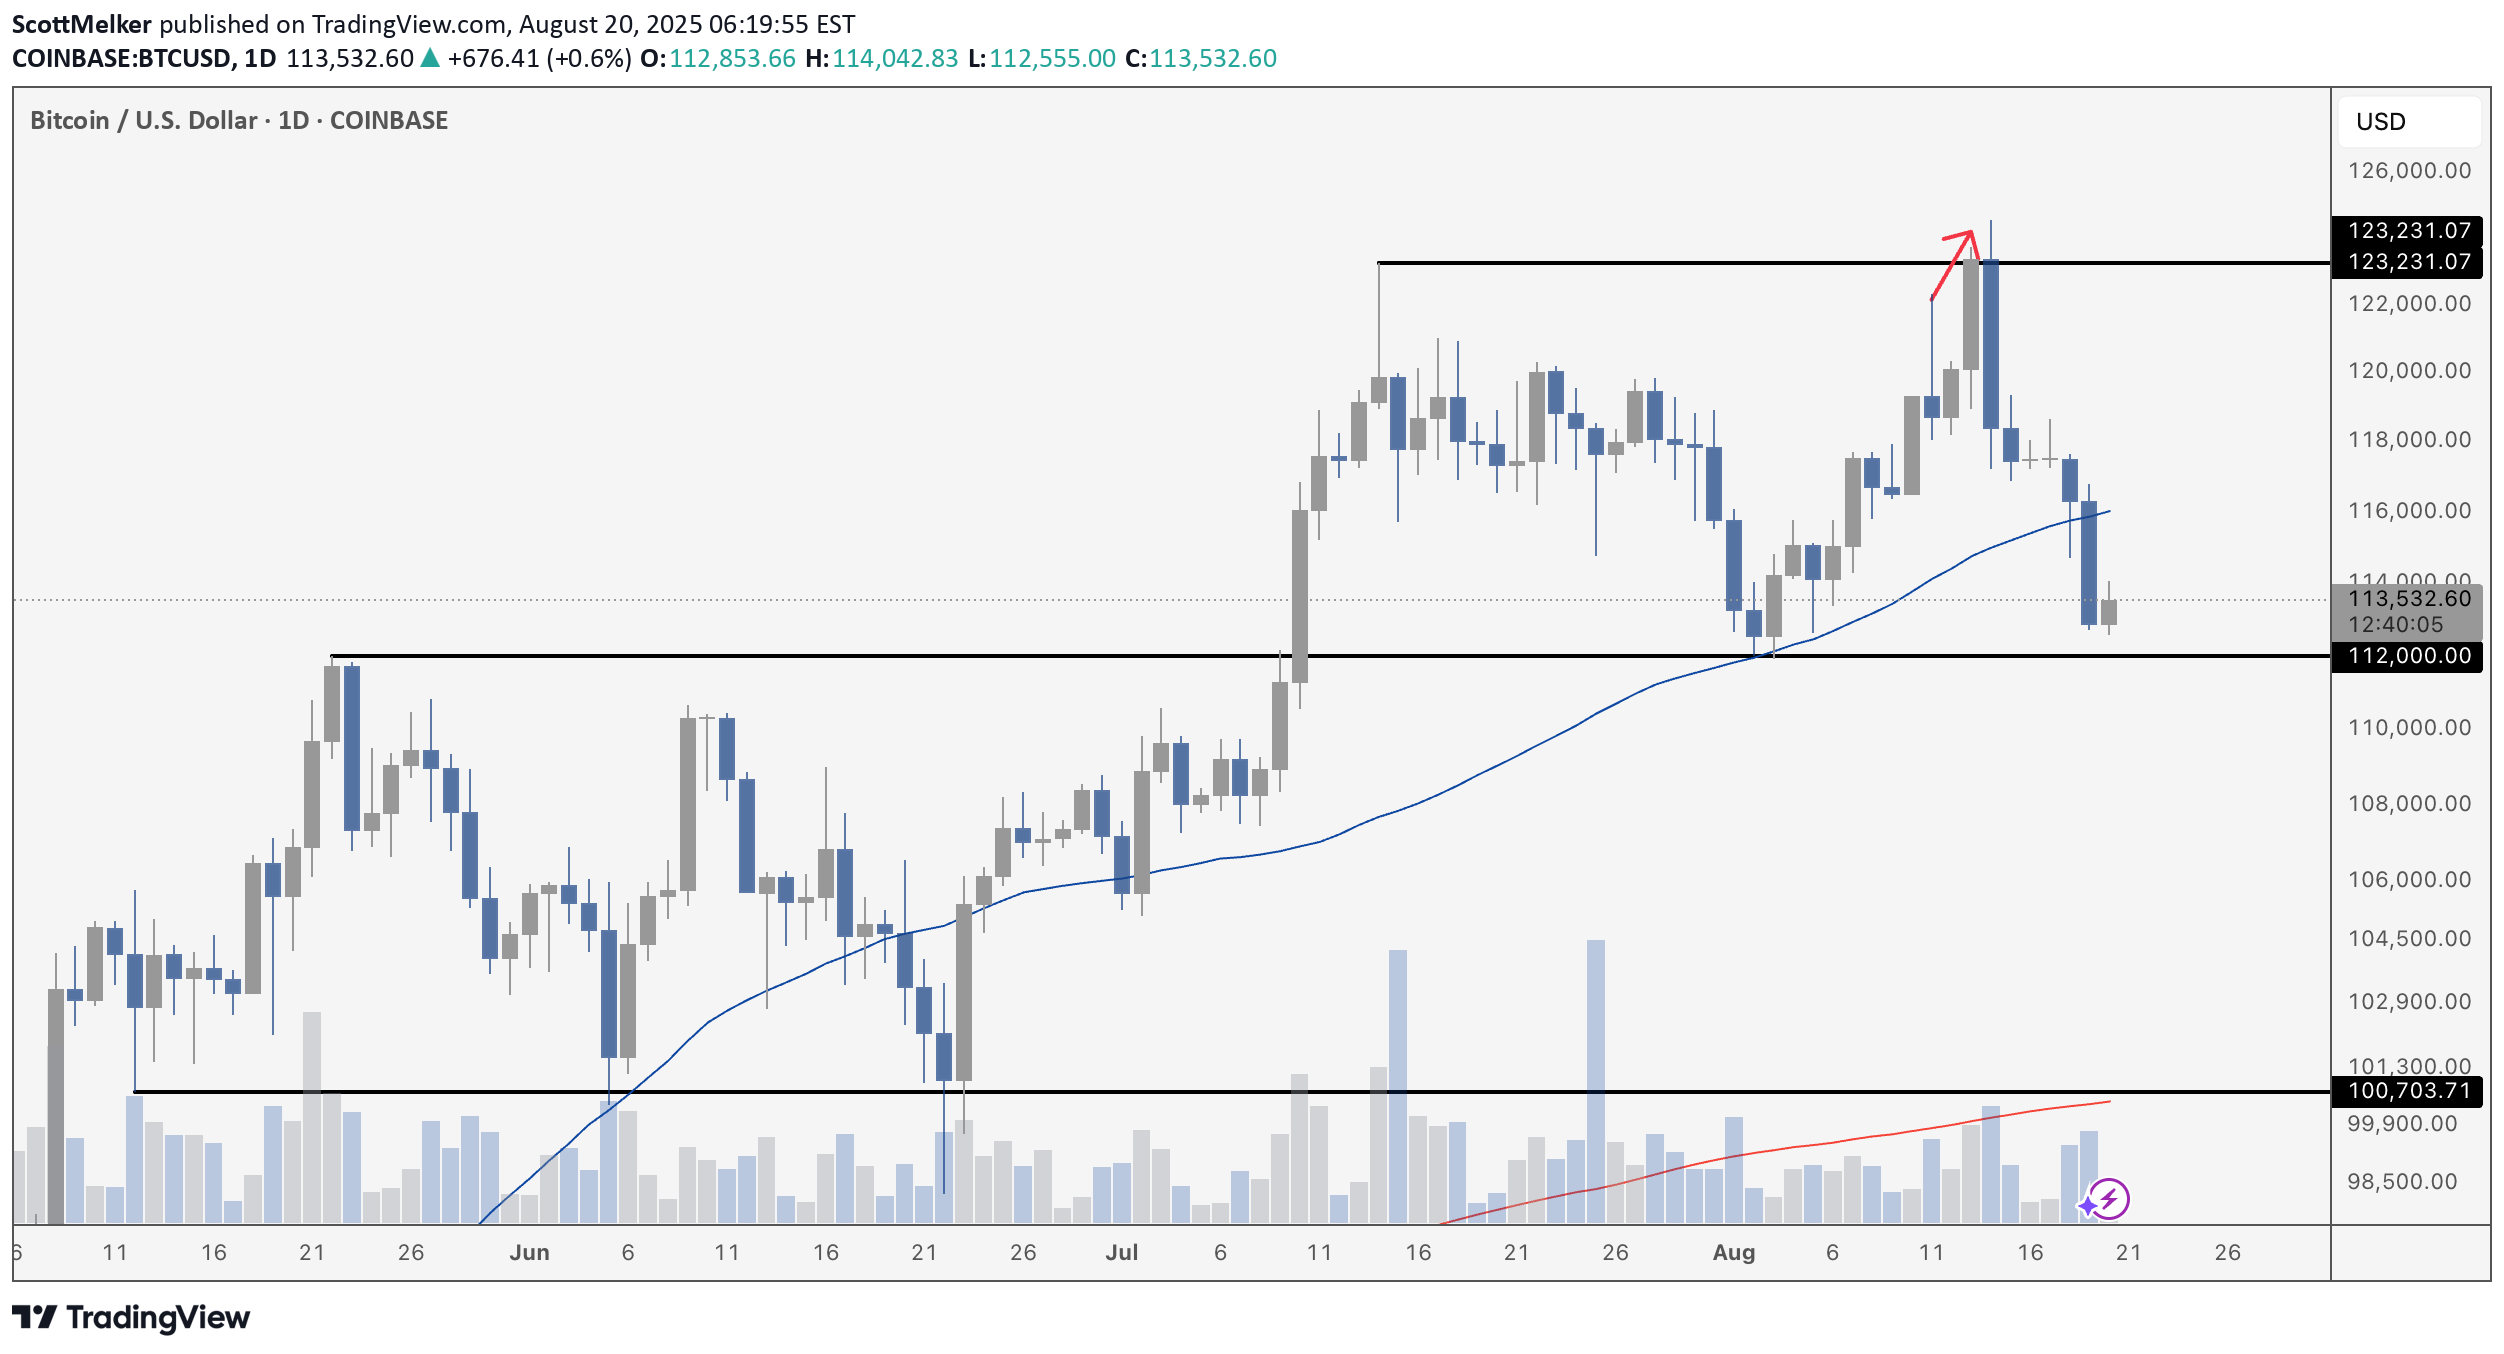
First, yesterday was one of the statistically rare times that bullish divergence fails on the Bitcoin chart, but it obviously happens. There was only a small bounce and both price and RSI made lower lows on the 4-hour chart. Bitcoin has pulled back sharply from its recent local high at $123,231, where sellers stepped in aggressively and rejected price with a long wick to the upside and bearish divergence. That rejection has now pushed BTC below the 50-day moving average, flipping it into resistance for the first time since June. The immediate battle is at $112,000 – a key level that served as resistance during the July breakout and is now being tested as support. If this level holds, bulls can regroup and make another push toward the highs. If it fails, the next major demand zone doesn’t come in until around $100,700, a level that absolutely must hold to preserve the broader bullish structure. The good news – this still looks like a healthy correction within an uptrend. The market had run hot after July’s breakout, and profit-taking at resistance was inevitable. For now, the bull market structure remains intact as long as Bitcoin stays above six figures. In short – the trend is still your friend, but the $112K line is the battleground. Lose it, and we’re likely staring at a deeper correction. Hold it, and $123K comes back into play quickly. We are ranging between those two levels.
