
ScottMelker
@t_ScottMelker

What symbols does the trader recommend buying?
Purchase History
پیام های تریدر
Filter
ScottMelker
BTC RETESTING 50 MA

Bitcoin continues to pull back following last week’s breakout, with price now appearing to gravitate toward the daily 50 moving average. This type of retracement is common after impulsive moves higher, as markets often revert toward the mean before resuming trend. Importantly, this pullback remains controlled and does not yet show signs of aggressive selling. A successful retest of the 50 MA would be consistent with healthy trend behavior and could provide a base for continuation. Conversely, failure to hold this area would suggest the market needs additional time to consolidate before attempting higher prices.
ScottMelker
BTC CONSOLIDATING AFTER BREAKOUT

After pushing higher earlier in the week, Bitcoin is now seeing its first meaningful pullback since the breakout. Importantly, price remains well-contained within the ascending channel and above former resistance, suggesting this move is corrective rather than impulsive. This type of consolidation is typical in healthy trends, as the market tests whether higher prices are accepted. As long as Bitcoin continues to hold above the breakout area, the broader structure remains constructive. A deeper pullback would only become a concern if price were to lose the channel and slip back into the prior range.
ScottMelker
BTC BREAKS OUT

The Bitcoin breakout is official, with price 3 candles removed from passing through resistance. Although volume has been subdued, we did see a nice spike yesterday, which is encouraging. Price appears to be heading to the top of the ascending channel, which could carry it to 100K or above. This is the area traders are watching move, as the weekly 50 MA looms (not shown).
ScottMelker
SUI BREAKS OUT

Sui looks decent here, alongside the majors that I shared yesterday. It is back above the 50 MA. We have a clear break of resistance in the 1.8 area, which is the level prices has been consolidating below. The target area above is between 2.20 and 2.30. Ideally, traders would want to see a retest of the below resistance now as support, with RSI overbought. This also had a nice volume spike on the breakout. A lot of altcoin charts are starting to look good.
ScottMelker
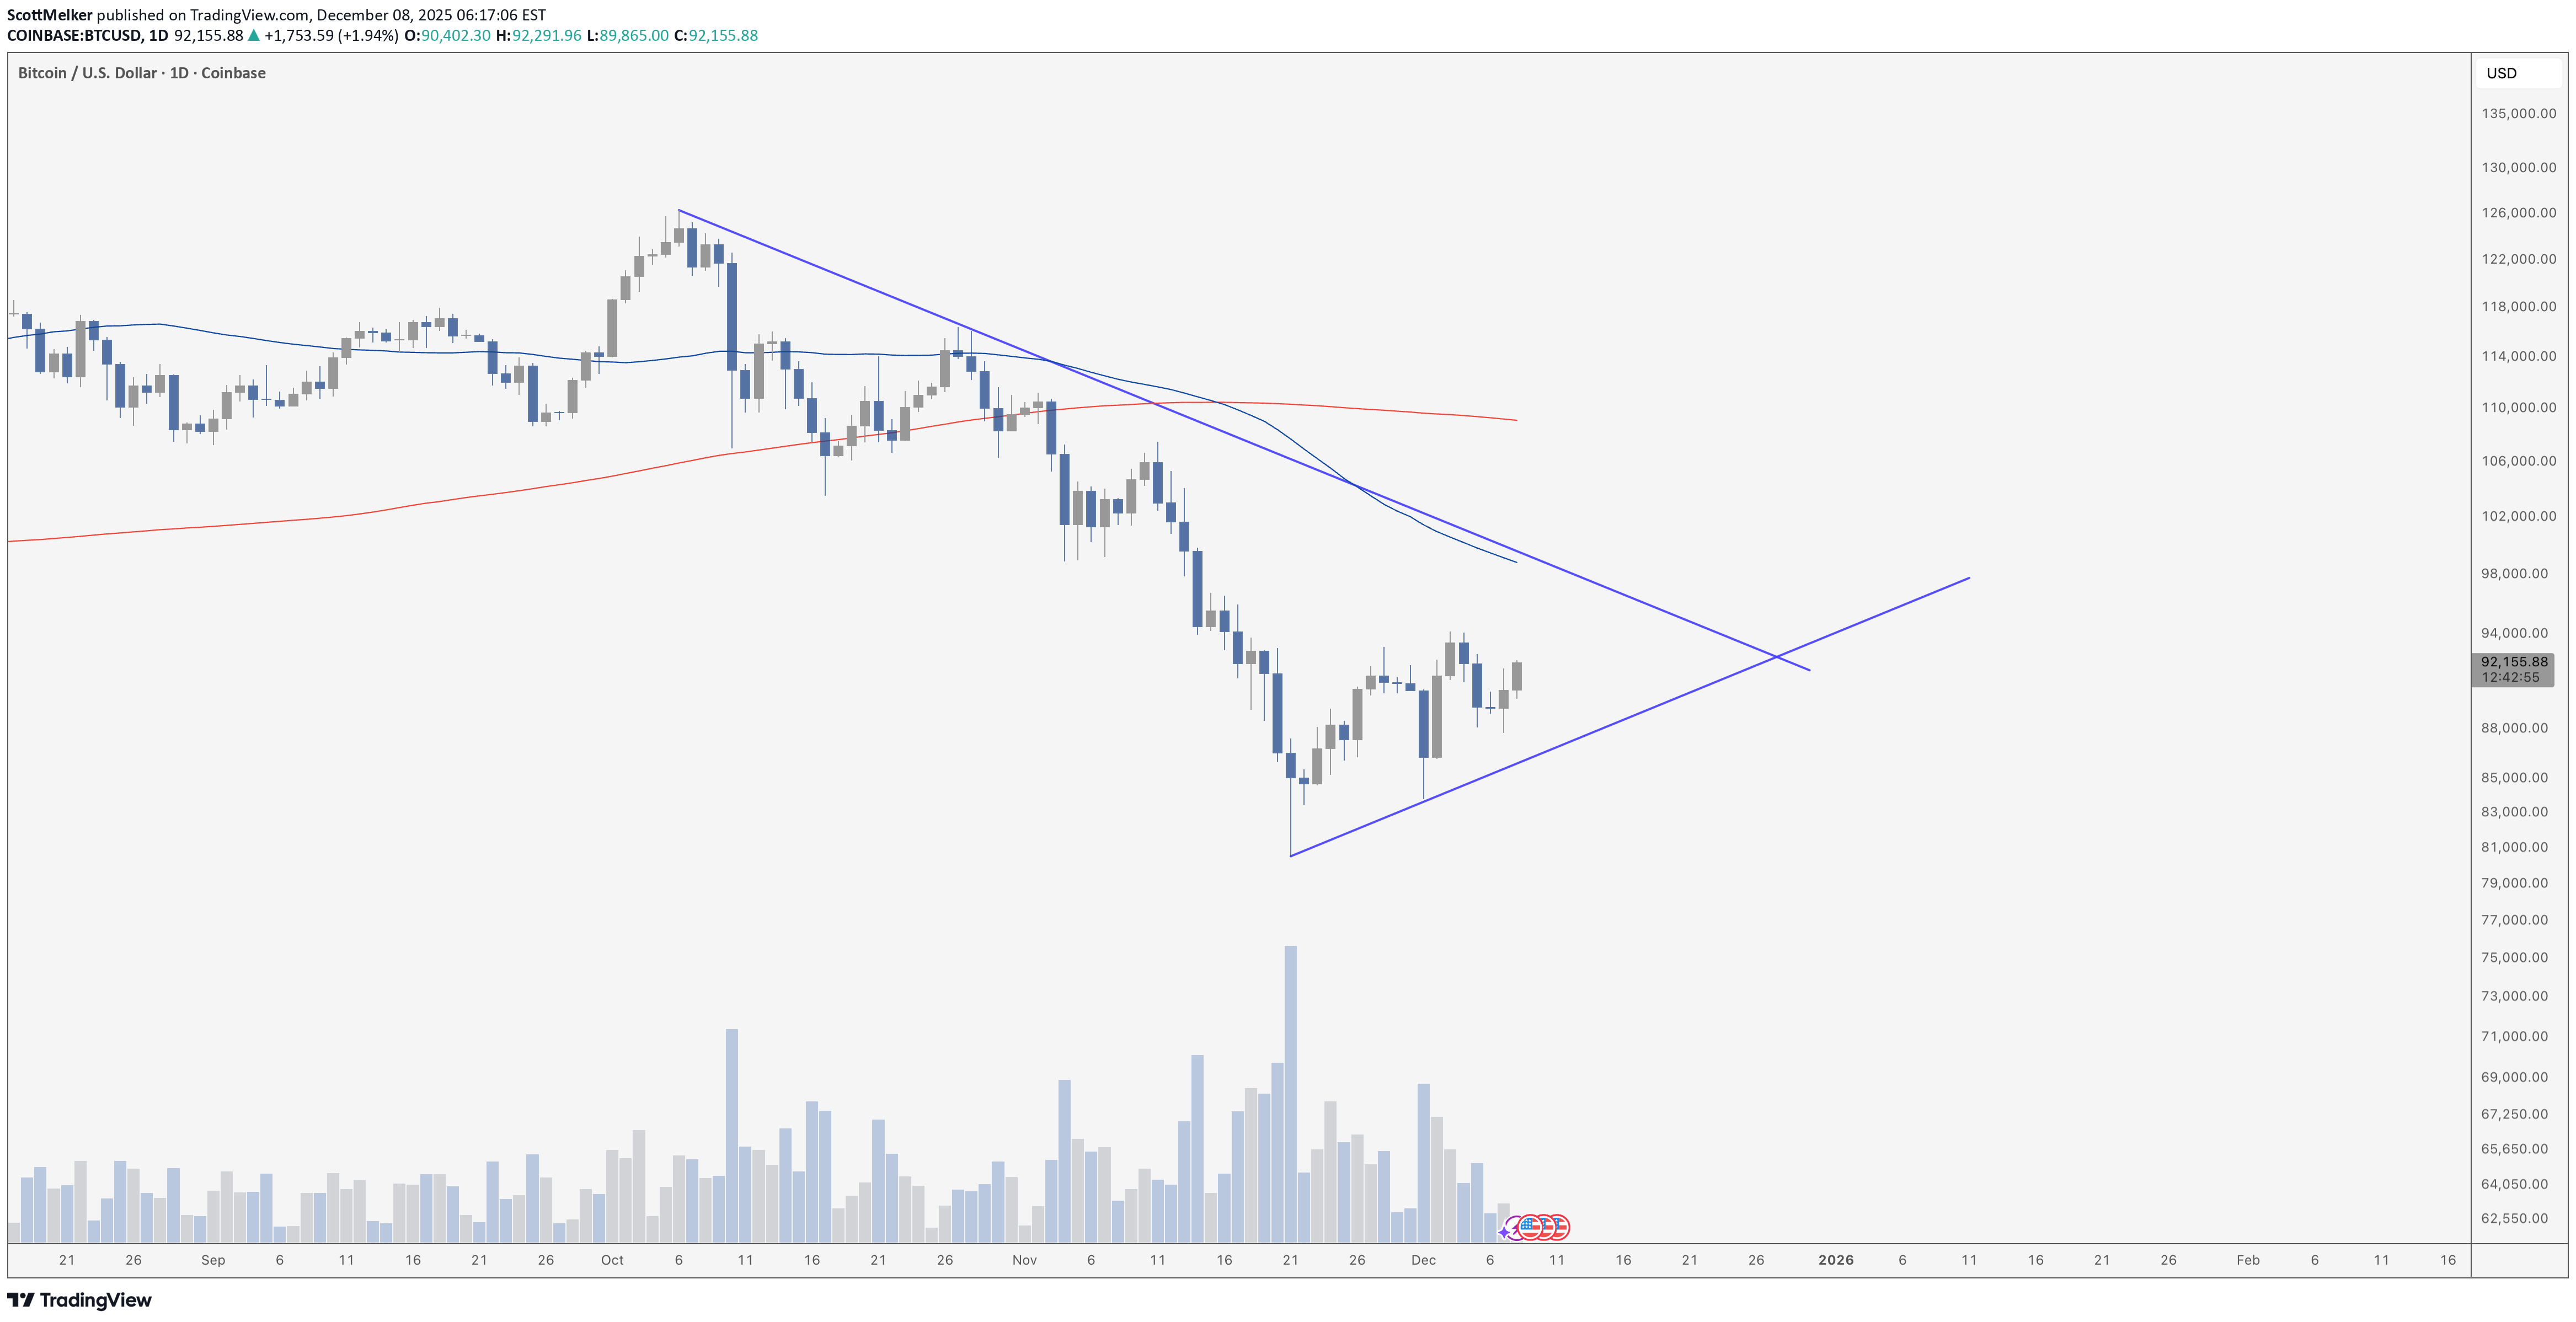
BTC BREAKOUT OR BREAK DOWN?

Bitcoin is at an inflection point, and the structure can reasonably be read two ways: either as a bear flag within a broader correction, or as an ascending channel that resolves higher. The distinction will be decided by what happens next. After the sharp selloff from the highs, price has carved out a rising channel with higher lows and modest higher highs. On its own, that’s constructive behavior – it shows buyers stepping in progressively earlier after a waterfall move. However, context matters. This channel is forming below a dominant, downward-sloping trendline from the highs and beneath the declining 50-day moving average, which keeps bearish pressure overhead. From a bearish perspective, this looks like a classic bear flag: impulsive downside, followed by an orderly, low-momentum grind higher. Volume has contracted during the consolidation, which is typical of continuation patterns. If price breaks down from the lower boundary of the channel, especially with expansion in volume, that would favor continuation lower and validate the bear flag interpretation. From a bullish perspective, the fact that Bitcoin has not retraced deeply, has held higher lows, and is respecting the channel suggests absorption rather than distribution. If price can break above the upper channel resistance and reclaim the falling trendline, the structure shifts meaningfully. That would turn this from a corrective pattern into a base, opening the door to a move back toward the 50-day and potentially the 200-day moving average. In short, this is a decision zone. As long as Bitcoin remains trapped inside the rising channel and below the trendline, the burden of proof stays on the bulls. A downside break favors the bear flag. A clean upside breakout, especially on volume, flips the script and argues that this consolidation is a launching pad rather than a pause before continuation lower.
ScottMelker
Is Solana Bottoming?

SOL is trading right on top of a key horizontal support zone around 126, a level that has repeatedly acted as demand earlier in the cycle. Price is still in a broader daily downtrend, with the 50-day and 200-day moving averages overhead and sloping lower, but the location matters. This decline is occurring directly into major support. The more important signal is in momentum. RSI recently hit oversold and has now broken its downtrend, even as price continued to grind lower. That creates clear bullish divergence – momentum is improving while price makes marginally lower lows. This is often what exhaustion looks like near the end of a corrective move. In simple terms, sellers are losing control. Bears managed to push price into support, but failed to generate new downside momentum. That doesn’t guarantee an immediate reversal, but it does meaningfully increase the odds of a relief bounce or at least consolidation rather than a clean breakdown. From here, 126 is the line in the sand. Holding this level keeps the bullish divergence intact and opens the door to a move back toward the declining 50-day moving average. A decisive break below support would invalidate the setup and point to further downside. For now, this is the type of spot where Solana has historically found its footing – weakness into support with momentum turning first.
ScottMelker
بیت کوین در سراشیبی سقوط؟ چرا نمودارها خستهکننده شدهاند!

Bitcoin lost ascending support on yesterday’s candle, giving a bit more evidence that the asset is not yet ready for renewed bullishness. On the flip side, volume is non existent (bears want to see high volume on a breakdown), price still appears to be sideways, and any lower candle closes will likely form significant bullish divergence. No matter how I look at the charts, I just see boring, choppy price action.
ScottMelker
Bitcoin Is In A Bull Market
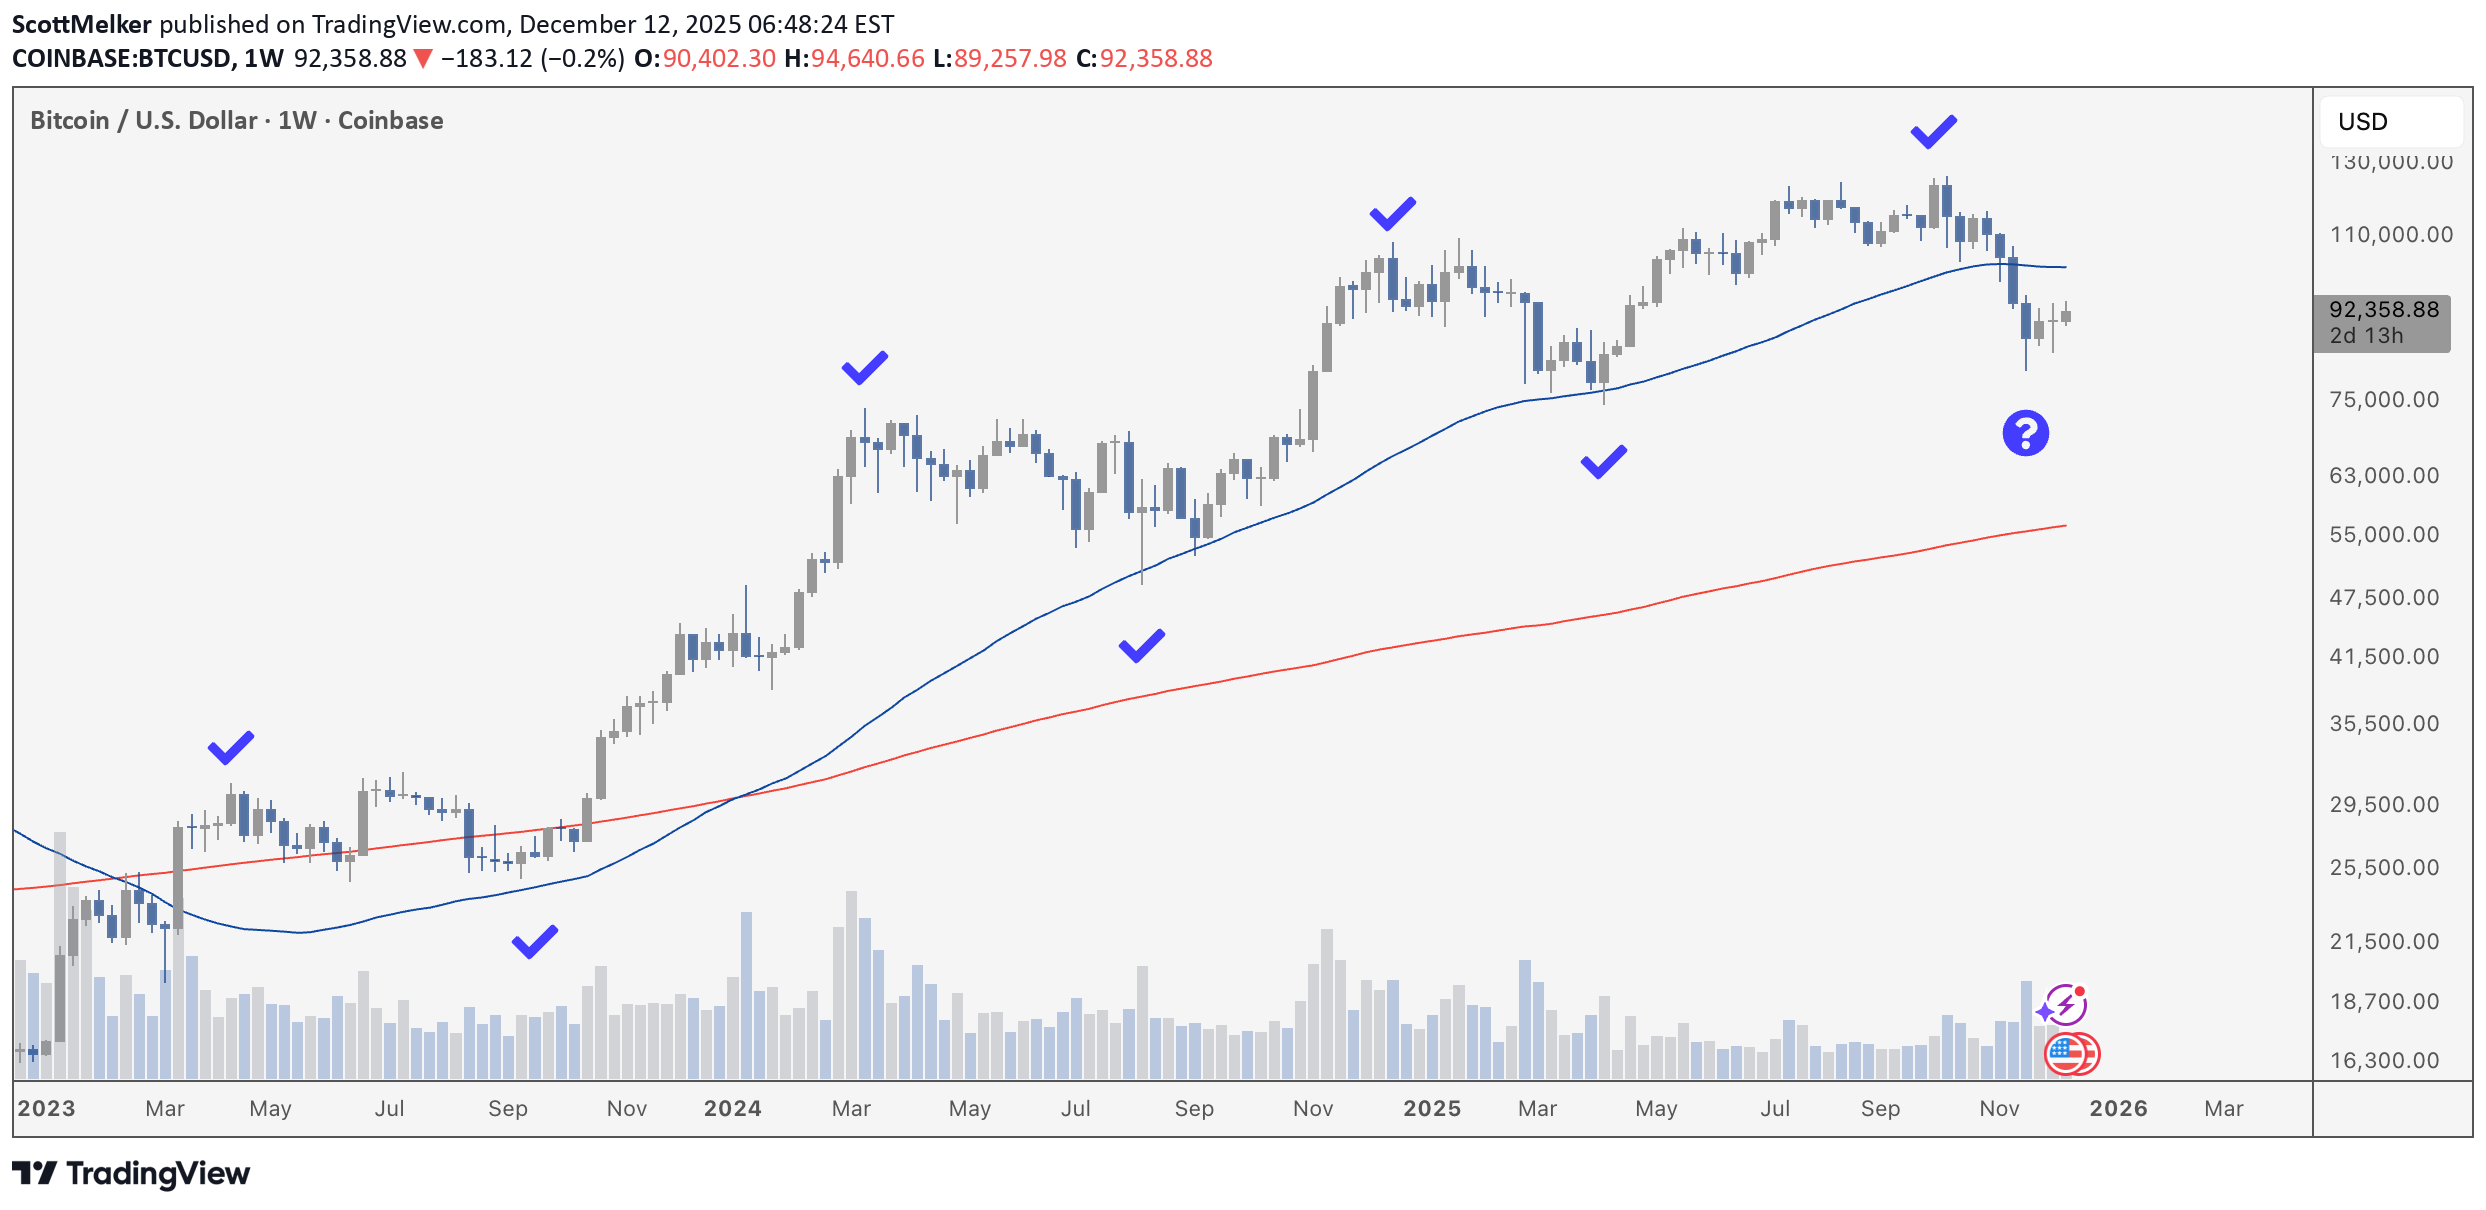
When in doubt, zoom out. There are countless ways to define a bull or bear market, and each technical analysis seemingly has their own approach. That said, the most typical definition of a bull trend is an unbroken series of higher highs and higher lows. Bitcoin has been in an uptrend since bottoming after FTX. The recent 80K low “could” be another higher low in this series. It would technically be confirmed with the next higher high - a new ATH.
ScottMelker
Bitcoin Approaches The Daily 50 MA
Not much is happening on the Bitcoin chart, but it is worth noting that descending resistance is in line with the 50 MA on the daily, a key level that traders and algorithms will be watching as resistance. A strong push through that level could be a great signal that the bottom is in.
ScottMelker
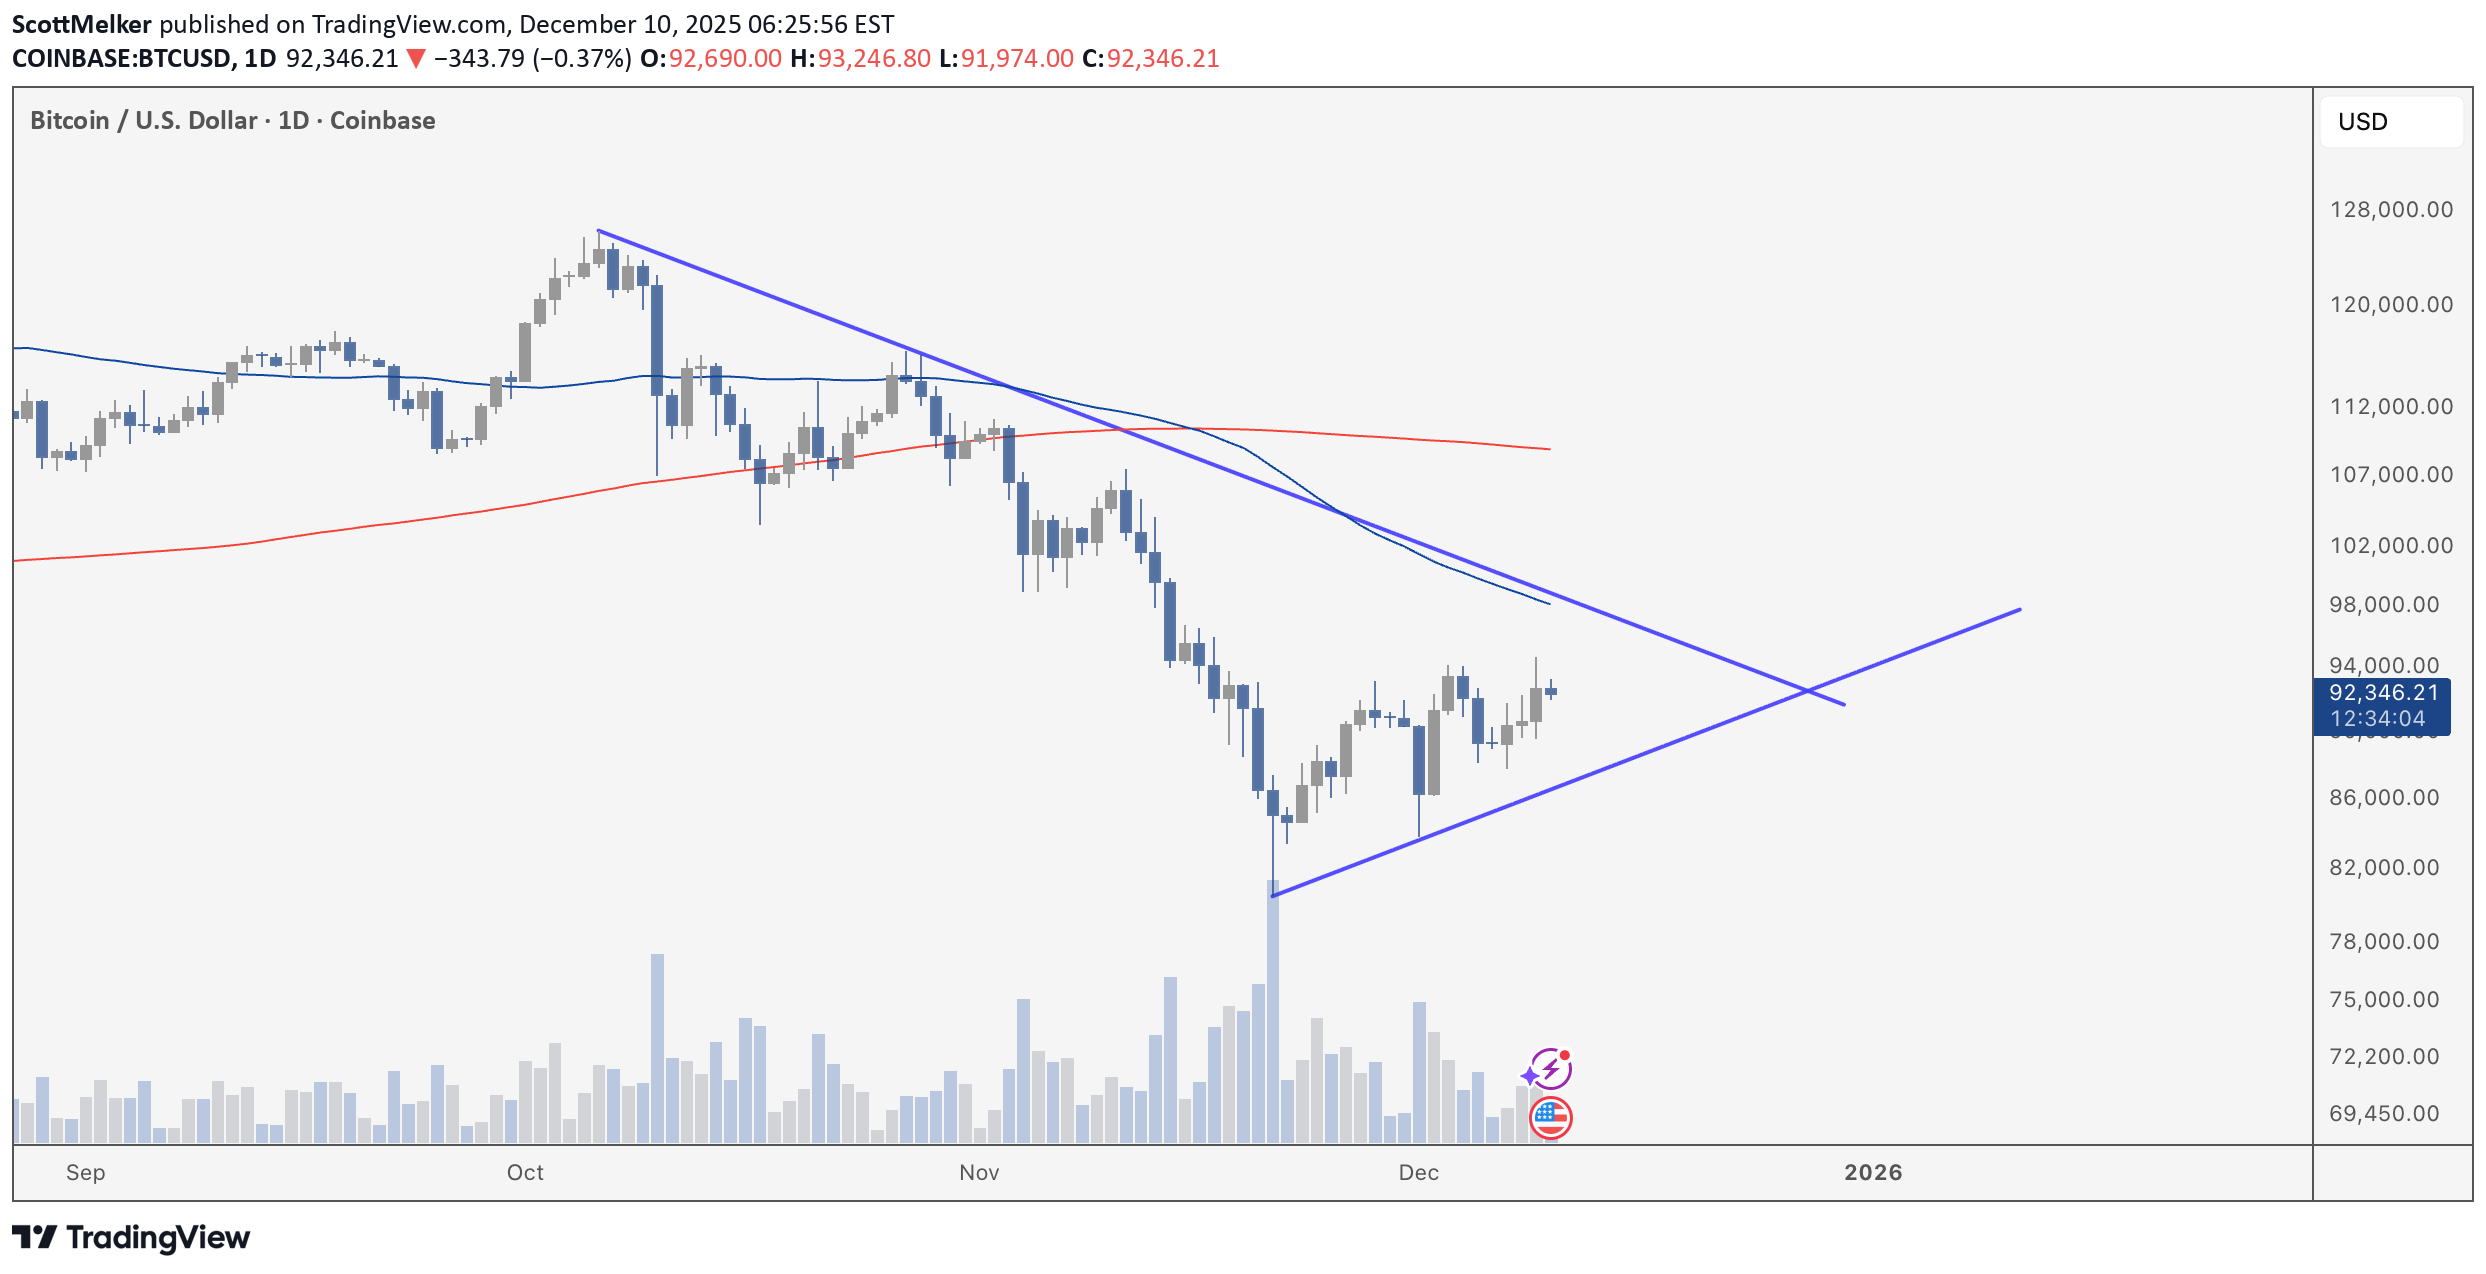
BTC IS SIDEWAYS
itcoin continues to struggle to find a clear direction. The weekly 50 MA is still around 102K - even if we are in a bear market, that should be retested as resistance, like it has in every past “cycle.” For now, I remain in the camp that we are likely in a normal bull market correction and that we will eventually see further upside. In the short term, we can use this chart as a guide for a break up or break down. Right now, we remain sideways.
Disclaimer
Any content and materials included in Sahmeto's website and official communication channels are a compilation of personal opinions and analyses and are not binding. They do not constitute any recommendation for buying, selling, entering or exiting the stock market and cryptocurrency market. Also, all news and analyses included in the website and channels are merely republished information from official and unofficial domestic and foreign sources, and it is obvious that users of the said content are responsible for following up and ensuring the authenticity and accuracy of the materials. Therefore, while disclaiming responsibility, it is declared that the responsibility for any decision-making, action, and potential profit and loss in the capital market and cryptocurrency market lies with the trader.