Technical analysis by Trend_logic about Symbol BTC on 8/18/2025

Trend_logic
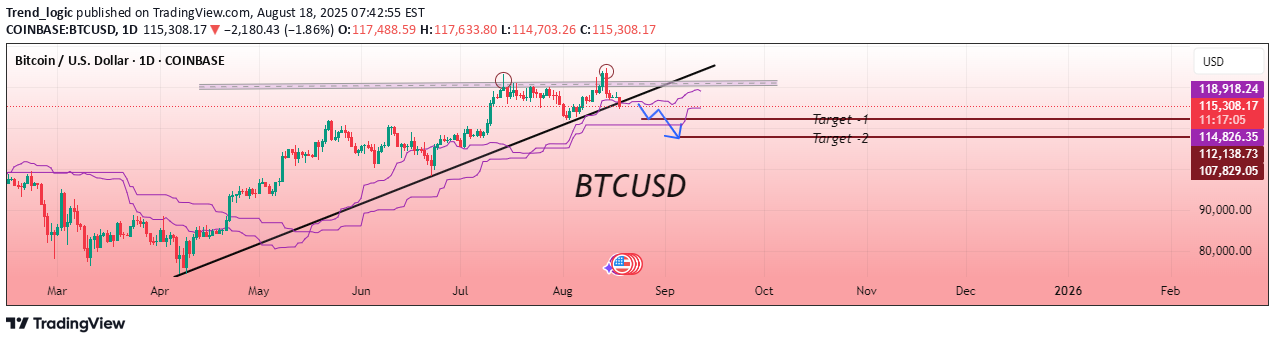
This BTC/USD daily chart highlights a bearish reversal setup after price rejection from a strong resistance zone. Two clear rejections at the same horizontal level suggest a possible double-top formation, which typically signals downside risk. The ascending trendline has been broken, indicating fading bullish strength. With price now moving below the trendline, momentum points to a bearish continuation. The Ichimoku cloud offers some support, but the projection with arrows suggests Bitcoin could decline further. If sellers remain in control, the chart structure favours a deeper retracement toward key lower levels in the coming days. Targets🎯 1st Target: 112,100 2nd Target: 107,800 If you found this analysis helpful, don’t forget to drop a like and comment. Your support keeps quality ideas flowing—let’s grow and win together! 💪📈
