
Trend_logic
@t_Trend_logic

What symbols does the trader recommend buying?
Purchase History
پیام های تریدر
Filter
Trend_logic
سیگنال خرید طلا (XAU/USD): طلوع دوباره خریداران با شکست خط روند نزولی!
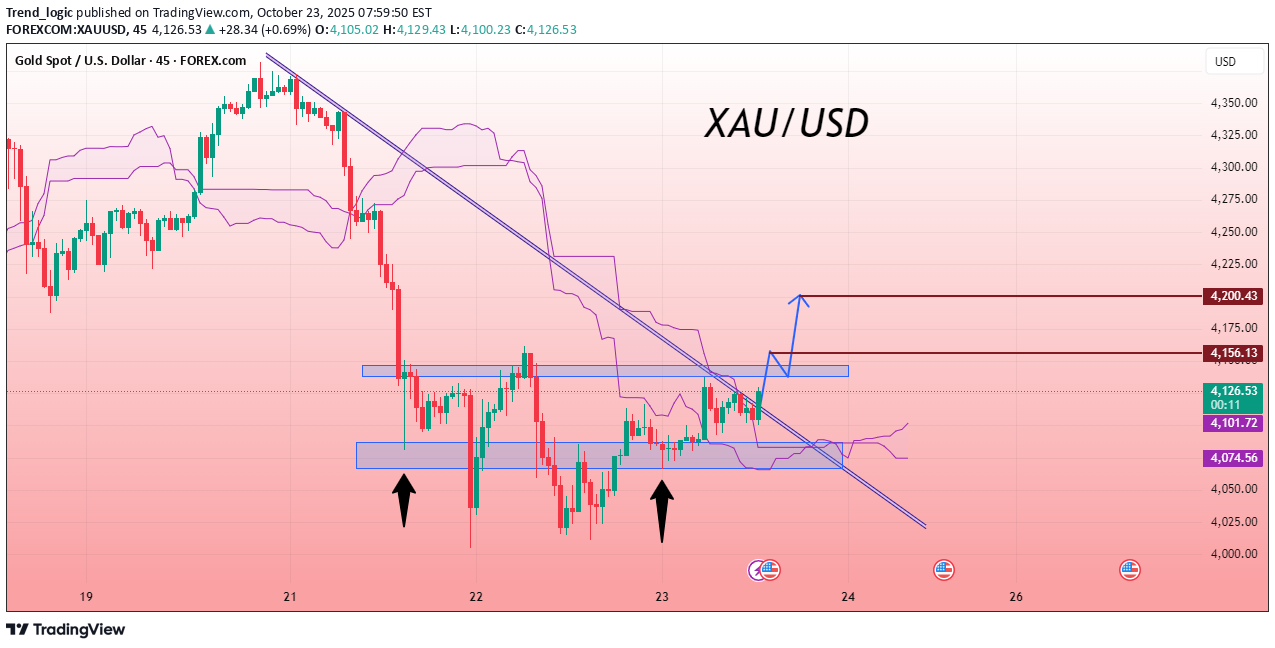
Gold is attempting a recovery after reacting from the lower zone marked on the chart. Price action has broken above the descending trendline, signaling a weakening of the bearish leg. The consolidation band in the mid-range is now being tested as a potential support-to-resistance flip area, which is critical for continued strength. The Ichimoku structure is beginning to soften on the downside and price is trying to build above it, which supports an early bullish narrative. If candles hold above this reclaimed band, upward continuation becomes likely. However, if price fails to sustain above the breakout area, it may slide back into the earlier sideways range and pause momentum. Entry Zone: Buy 🎯 Target 1 : 4156 🎯 Target 2 : 4200 If you found this analysis helpful, don’t forget to drop a like and comment. Your support keeps quality ideas flowing—let’s grow and win together! 💪📈
Trend_logic
طلای جهانی (XAU/USD): ادامه صعود با حمایت قوی! تحلیل تکنیکال و سطوح ورود و هدف جدید
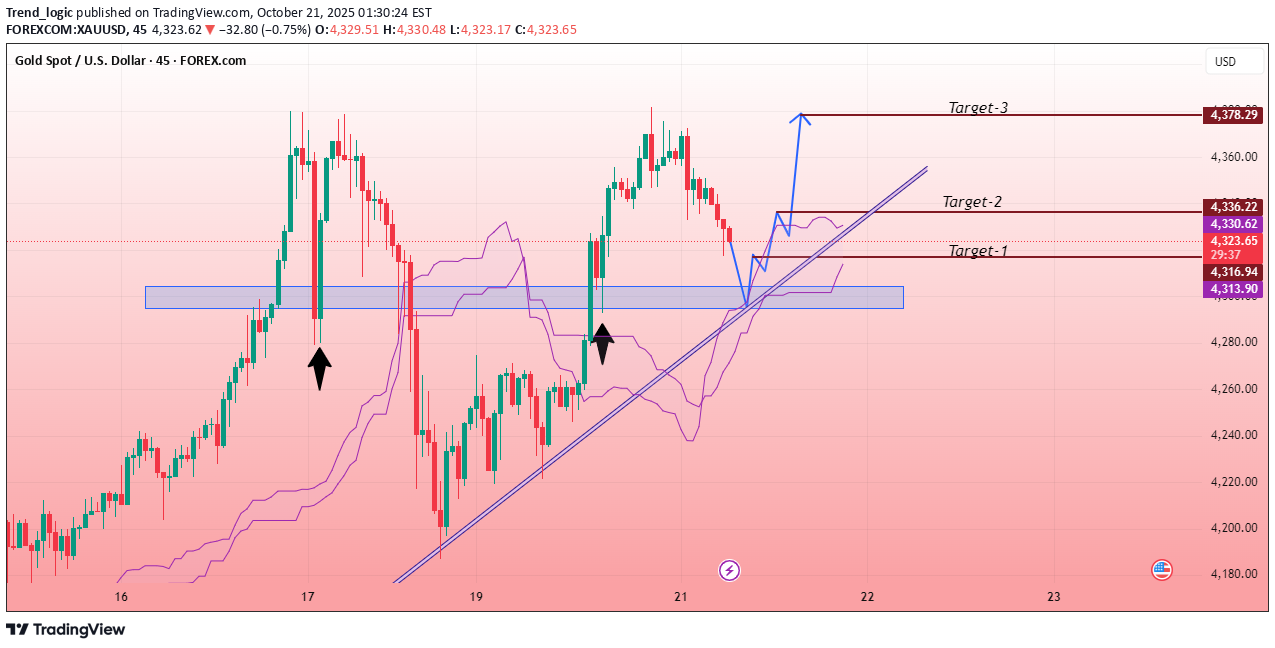
Gold is trading around its current level, showing a slight dip. The 45-minute chart with the Ichimoku indicator shows the price holding above an upward trendline, suggesting continued bullish momentum. Recent price movements indicate periods of volatility, while the current consolidation suggests traders are assessing the next move. Ichimoku lines remain below the price, reinforcing positive sentiment. The price action near the trendline support signals potential for a breakout and further upward movement. Overall, the technical setup points to a cautiously optimistic outlook for gold in the near term. Entry Zone: Buy 🎯 Target 1: 4316 🎯 Target 2 : 4336 🎯 Target 3 : 4380 If you found this analysis helpful, don’t forget to drop a like and comment. Your support keeps quality ideas flowing—let’s grow and win together! 💪📈
Trend_logic
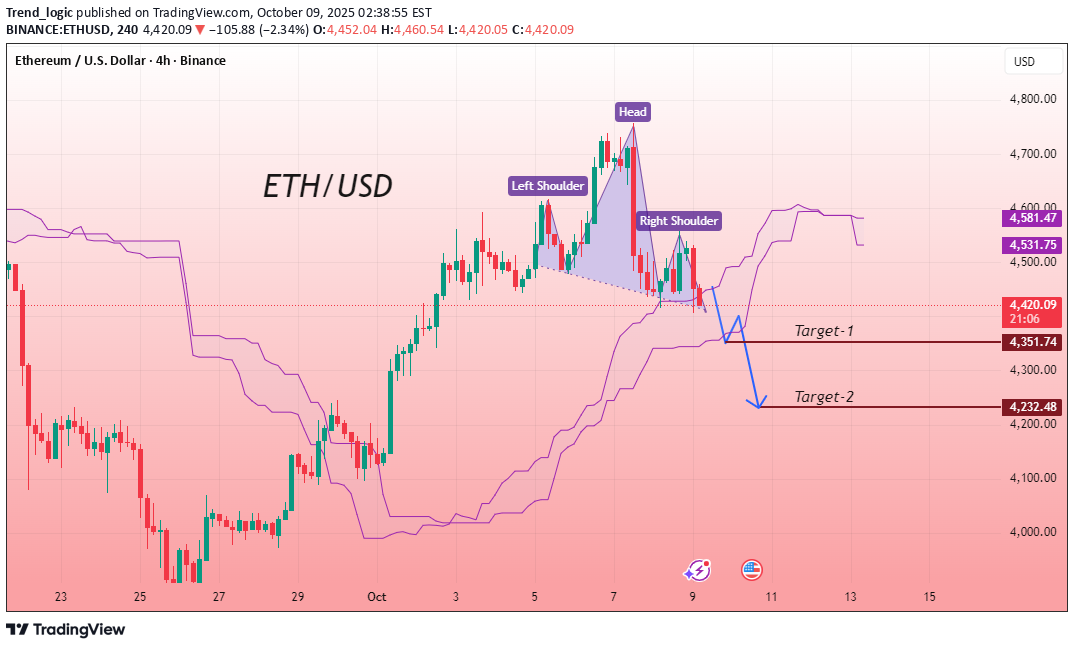
تحلیل تکنیکال اتریوم (ETH/USD): شکست خط روند صعودی و ورود به منطقه نزولی!
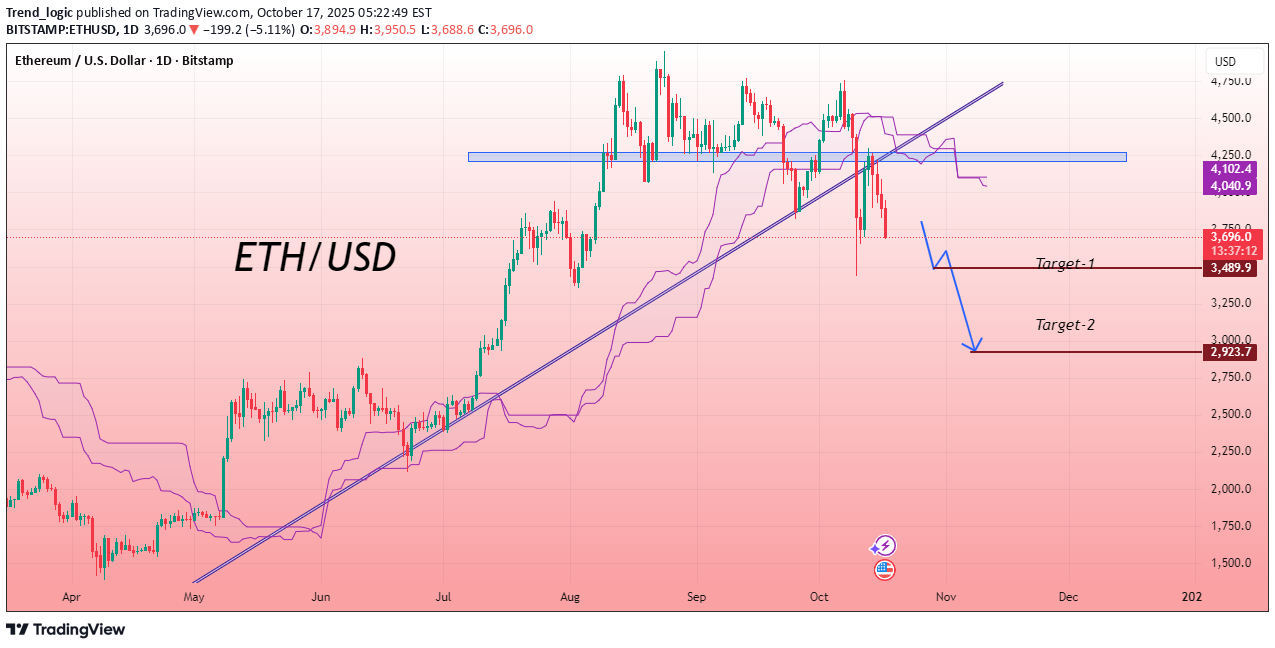
The Ethereum (ETH/USD) daily chart indicates a clear shift in momentum as price breaks below its major ascending trendline. After multiple failed attempts to sustain higher levels, bearish pressure has strengthened, leading to a downward structure. The breakdown confirms weakness, with sellers gaining control and the Ichimoku cloud showing continued pressure below resistance zones. Market sentiment appears cautious as buyers lose momentum, suggesting potential for further downside movement if support levels fail to hold. Overall, the chart signals a transition from bullish to bearish territory, highlighting the need for careful monitoring before entering new positions. Entry Zone: Sell 🎯 Target 1 : 3490 🎯 Target 2 : 2920 If you found this analysis helpful, don’t forget to drop a like and comment. Your support keeps quality ideas flowing—let’s grow and win together! 💪📈ETH/USD
Trend_logic
طلا همچنان صعودی: آیا اصلاح تا 4211 فرصت خرید است؟
The XAU/USD chart shows a strong bullish structure, moving smoothly within an ascending channel. Price continues to form higher highs and higher lows, reflecting consistent buying pressure. A possible pullback may occur toward the 4211 region, where buyers are likely to re-enter the market and push prices higher again. This level aligns with a key support zone that has previously held well during minor corrections. The Ichimoku cloud remains below the price, providing additional confirmation of the ongoing uptrend. Overall, the structure remains positive, and as long as price stays above the support area, gold is expected to maintain its bullish tone, with buyers continuing to dominate short-term market movements. Entry Zone: Buy 🎯 Target : 4300 If you found this analysis helpful, don’t forget to drop a like and comment. Your support keeps quality ideas flowing—let’s grow and win together! 💪📈
Trend_logic
بیت کوین در کف قیمتی مستحکم شد: آیا خریداران کنترل بازار را پس میگیرند؟ (سیگنال خرید صعودی)
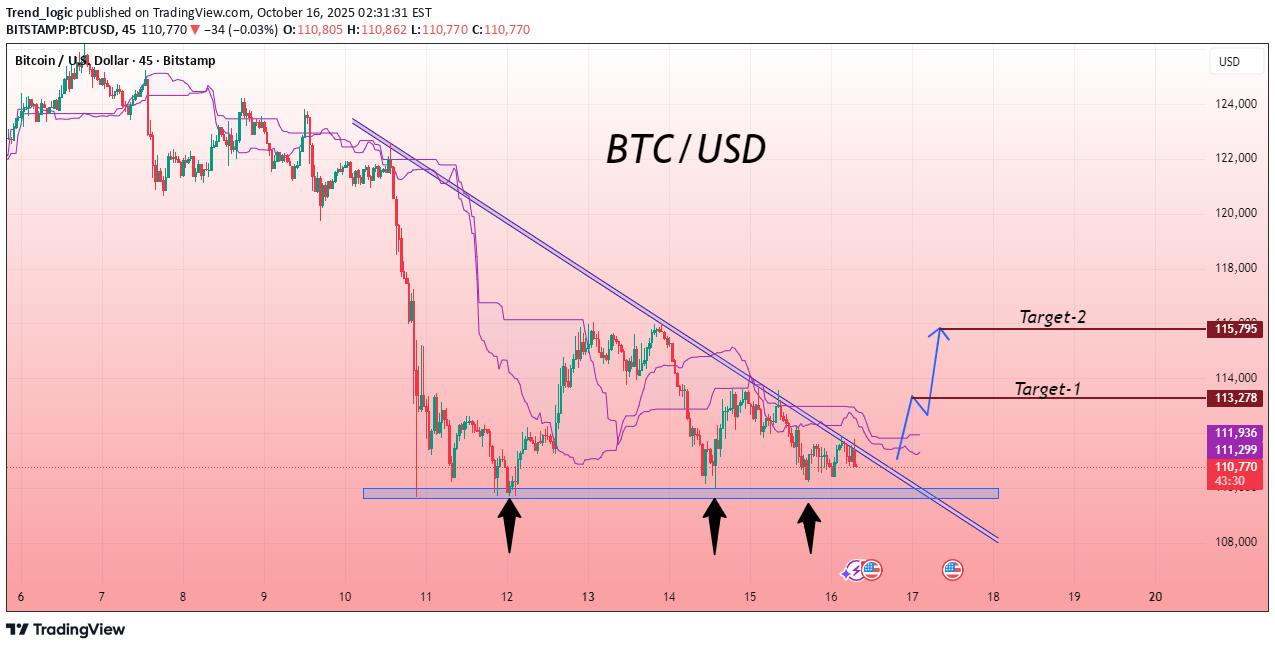
The Bitcoin/USD chart illustrates a strong accumulation phase forming near a significant support area, shown by multiple rebounds marked with arrows. Each retest of this zone demonstrates that buyers are actively defending the level, preventing further downside movement. A clear descending trendline reveals consistent selling pressure; however, recent candles indicate that bearish momentum is losing strength. This repeated defense at the bottom suggests growing buyer interest and potential preparation for a bullish reversal. If price manages to close above the descending line, it may confirm a shift in market sentiment from selling to buying. Overall, the chart reflects stabilization after a prolonged decline, with increasing signs that buyers are gradually regaining control over the market direction. Entry Zone: Buy 🎯 Target 1 : 113,270 🎯 Target 2 : 115,795 If you found this analysis helpful, don’t forget to drop a like and comment. Your support keeps quality ideas flowing—let’s grow and win together! 💪📈
Trend_logic
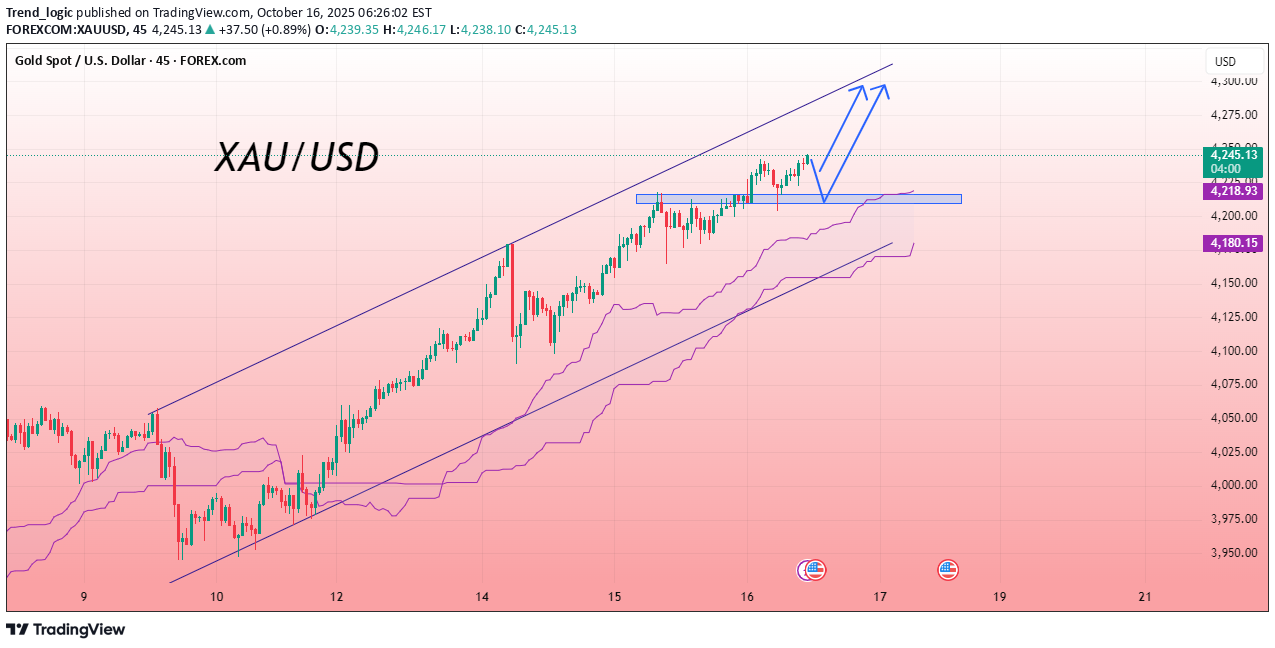
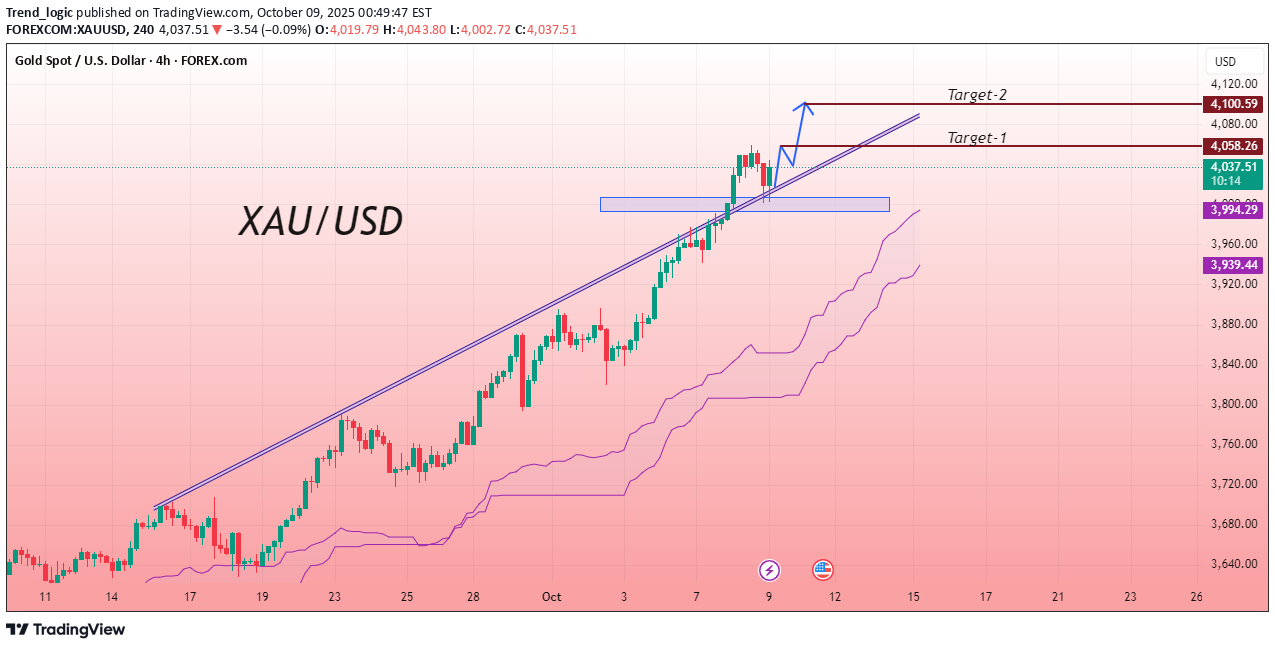
طلا شکست 4058 را اعلام کرد: ورود به منطقه صعودی قدرتمند!
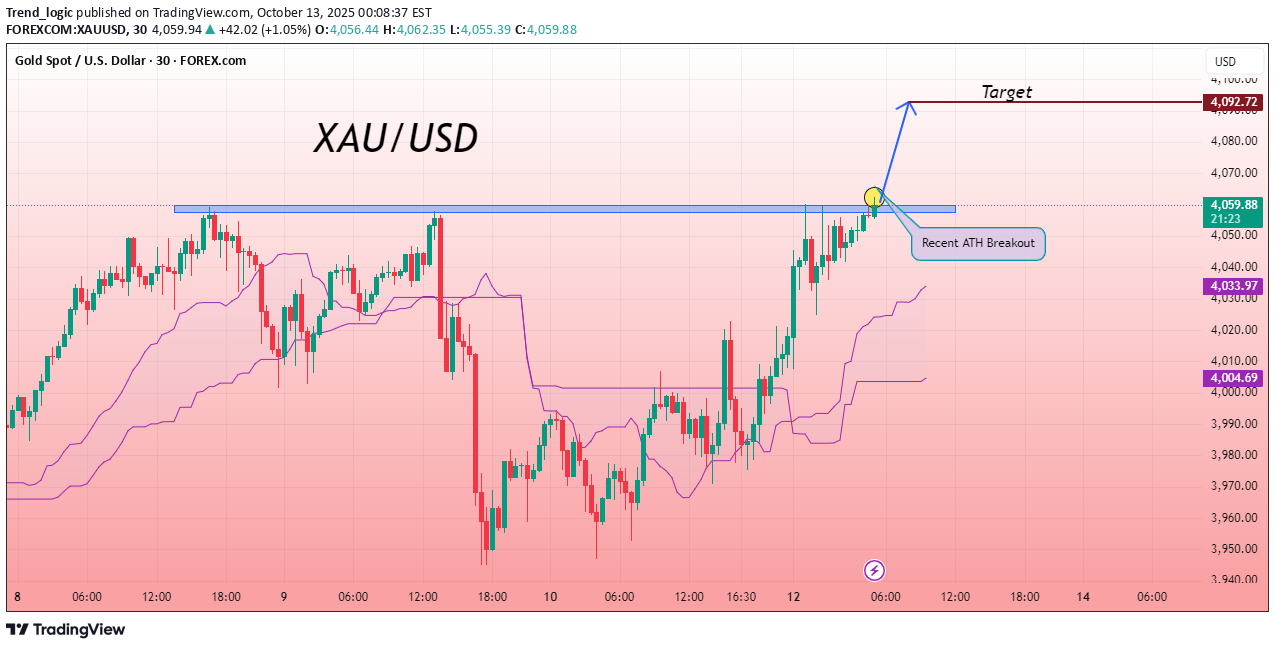
The XAU/USD chart displays a bullish formation, with price attempting a breakout near the 4058 level, a zone that previously served as strong resistance. The move above this level highlights renewed buying pressure and growing market confidence. The Ichimoku indicator further reinforces this outlook, as price action remains clearly above the cloud, suggesting ongoing positive momentum. Sustaining stability above the 4058 breakout area could signal continuation of the upward phase, confirming that buyers currently dominate the market. The overall chart sentiment points toward increased optimism in gold, as traders anticipate further price expansion while maintaining strength above key support regions, reflecting a constructive and controlled bullish trend in the short-term outlook. Entry Zone: Buy 🎯 Target: 4092 If you found this analysis helpful, don’t forget to drop a like and comment. Your support keeps quality ideas flowing—let’s grow and win together! 💪📈140+Pips Secured!
Trend_logic
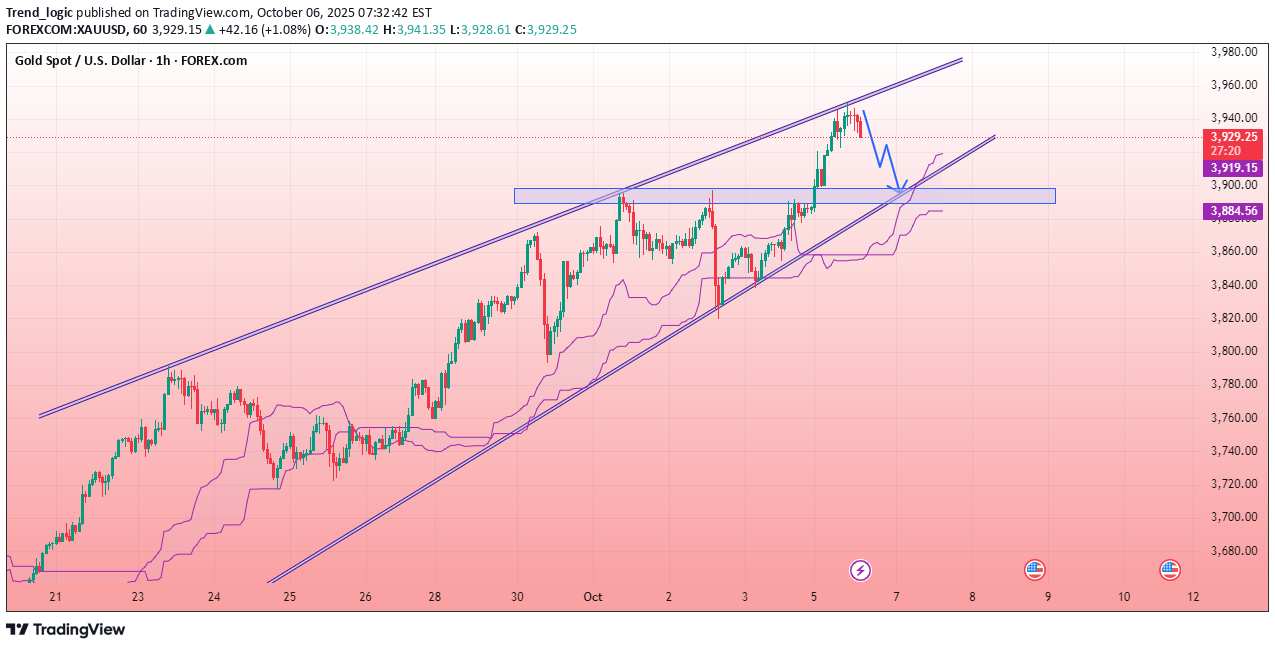
طلا (XAU/USD) در مسیر صعودی قوی: اهداف جدید و ورود به موقعیت خرید!
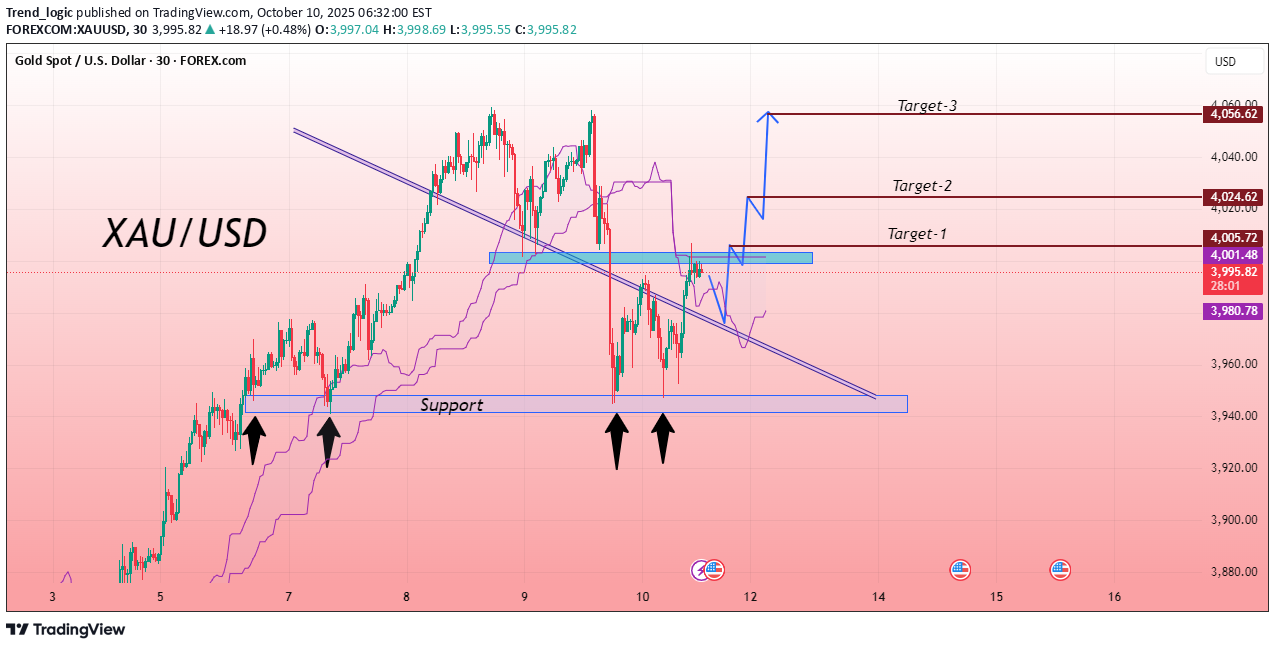
The XAU/USD chart shows strong bullish momentum after rebounding from a key support zone near the lower trendline. Multiple touches at the support level confirm its strength, indicating buyers are defending this area. Price has also broken above the descending trendline, suggesting a potential upward continuation. The highlighted blue zone acts as a retest region, where price may consolidate before moving higher. As momentum builds, gold could aim for successive upward moves toward higher resistance levels. Overall, the structure signals renewed buyer control, with the support area remaining crucial for sustaining the ongoing bullish trend in the short term. Entry Zone: Buy (3976) 🎯 Target 1 : 4005 🎯 Target 2 : 4024 🎯 Target 3 : 4056 If you found this analysis helpful, don’t forget to drop a like and comment. Your support keeps quality ideas flowing—let’s grow and win together! 💪📈✅ Update: First Target 4005 reached successfully. Second Target almost 4024 reached — XAU/USD touched 4021. 🔥 Total 450+ pips secured.
Trend_logic
احتمال سقوط اتریوم: آیا الگوی سر و شانه، روند صعودی را میشکند؟
The 2-hour chart of Ethereum shows a clear Head and Shoulders pattern, indicating a potential bearish reversal after a strong bullish phase. The price has broken below the neckline, confirming selling pressure in the market. Trading below the Ichimoku cloud also supports a bearish outlook. Momentum appears to be weakening, with sellers gaining control while buyers struggle to hold higher levels. If this structure continues, Ethereum could extend its downside move, with any minor pullbacks likely facing resistance near the neckline area before continuing lower. The overall sentiment remains cautious and slightly bearish for now. Entry Zone: Sell 🎯 Target 1 : 4350 🎯 Target 2 : 4230 If you found this analysis helpful, don’t forget to drop a like and comment. Your support keeps quality ideas flowing—let’s grow and win together! 💪
Trend_logic
پیشبینی طلا (XAU/USD): ادامه صعود قدرتمند و اهداف جدید خرید!
Gold continues its strong bullish momentum, maintaining movement above the rising trendline. After a brief retest of the support zone, price bounced back, confirming buying pressure. The structure suggests that bulls are still in control, and continuation toward the upper resistance levels remains likely. As long as the price sustains above the highlighted support area, upside momentum may extend further. The market could aim for higher levels as shown in the chart, reflecting consistent demand and solid trend structure. Overall sentiment remains positive while price action respects the ascending channel and continues forming higher highs and higher lows. Entry Zone: Buy 🎯 Target 1 : 4058 🎯 Target 2 : 4100 If you found this analysis helpful, don’t forget to drop a like and comment. Your support keeps quality ideas flowing—let’s grow and win together! 💪📈
Trend_logic
سیگنال فروش طلا (XAU/USD): چطور از ریزش قریبالوقوع در الگوی گُوِه صعودی سود ببریم؟
The chart displays a rising wedge pattern on Gold Spot (XAU/USD), signaling potential bearish momentum after a sustained uptrend. The price has been forming higher highs and higher lows within converging trendlines, showing weakening buying strength. A recent rejection near the upper boundary suggests that bullish momentum is fading. If the price breaks below the lower wedge line, it may confirm a short-term reversal toward lower support levels. The Ichimoku Cloud below the current structure provides additional confirmation of potential downside pressure. However, as long as the price remains within the wedge, the trend technically stays bullish, but traders should be cautious of an impending breakout to the downside. Entry Zone: Sell 🎯 Target 1 : 3911 🎯 Target 2 : 3897 If you found this analysis helpful, don’t forget to drop a like and comment. Your support keeps quality ideas flowing—let’s grow and win together! 💪📈
Disclaimer
Any content and materials included in Sahmeto's website and official communication channels are a compilation of personal opinions and analyses and are not binding. They do not constitute any recommendation for buying, selling, entering or exiting the stock market and cryptocurrency market. Also, all news and analyses included in the website and channels are merely republished information from official and unofficial domestic and foreign sources, and it is obvious that users of the said content are responsible for following up and ensuring the authenticity and accuracy of the materials. Therefore, while disclaiming responsibility, it is declared that the responsibility for any decision-making, action, and potential profit and loss in the capital market and cryptocurrency market lies with the trader.