Technical analysis by Trend_logic about Symbol ETH: Sell recommendation (10/9/2025)

Trend_logic
احتمال سقوط اتریوم: آیا الگوی سر و شانه، روند صعودی را میشکند؟
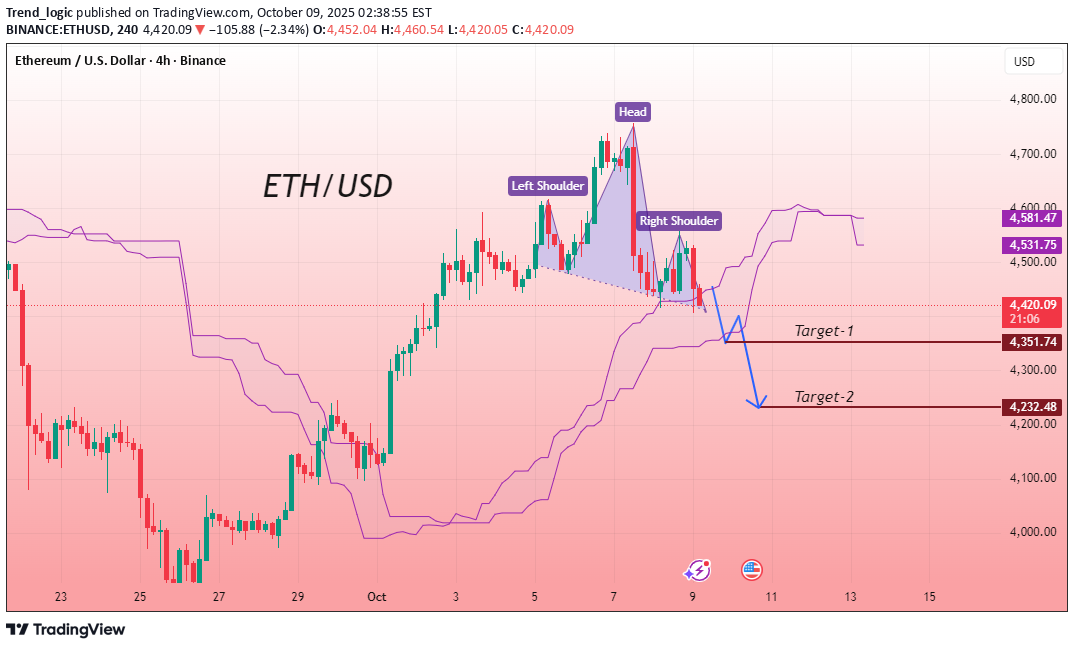
The 2-hour chart of Ethereum shows a clear Head and Shoulders pattern, indicating a potential bearish reversal after a strong bullish phase. The price has broken below the neckline, confirming selling pressure in the market. Trading below the Ichimoku cloud also supports a bearish outlook. Momentum appears to be weakening, with sellers gaining control while buyers struggle to hold higher levels. If this structure continues, Ethereum could extend its downside move, with any minor pullbacks likely facing resistance near the neckline area before continuing lower. The overall sentiment remains cautious and slightly bearish for now. Entry Zone: Sell 🎯 Target 1 : 4350 🎯 Target 2 : 4230 If you found this analysis helpful, don’t forget to drop a like and comment. Your support keeps quality ideas flowing—let’s grow and win together! 💪