Technical analysis by readCrypto about Symbol TRX on 8/16/2025

readCrypto
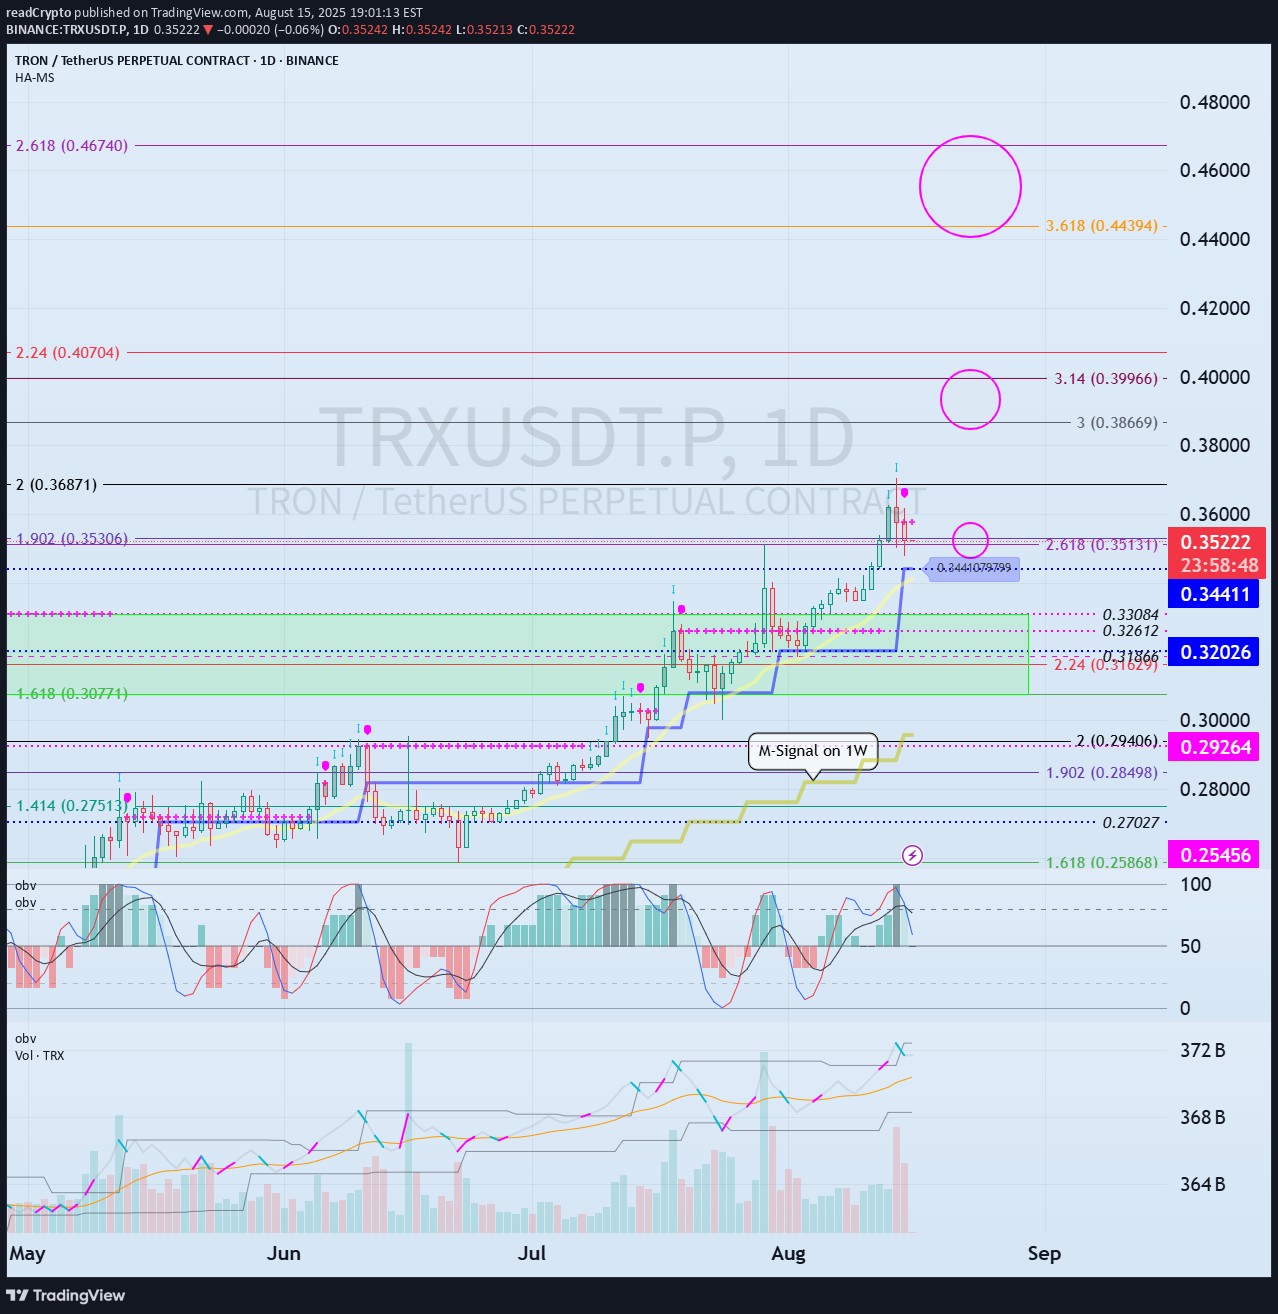
Hello, fellow traders! Follow us to get the latest information quickly. Have a great day! ------------------------------------- (TRXUSDT 1D Chart) TRX is one of those coins (tokens) that has a lot of users, yet feels neglected. For TRX to maintain its uptrend, the price must remain above the 0.30771-0.33084 range. The circled areas represent important support and resistance zones. When the M-Signal indicator on the 1W chart rises near the 0.30771-0.33084 range, a price decline below that level is highly likely to trigger a downtrend. - Thank you for reading to the end. I wish you successful trading. -------------------------------------------------- - This is an explanation of the big picture. (3-year bull market, 1-year bear market pattern) I will explain in more detail when the bear market begins. ------------------------------------------------------
