Technical analysis by MR_gold2 about Symbol BTC: Buy recommendation (8/10/2025)

MR_gold2
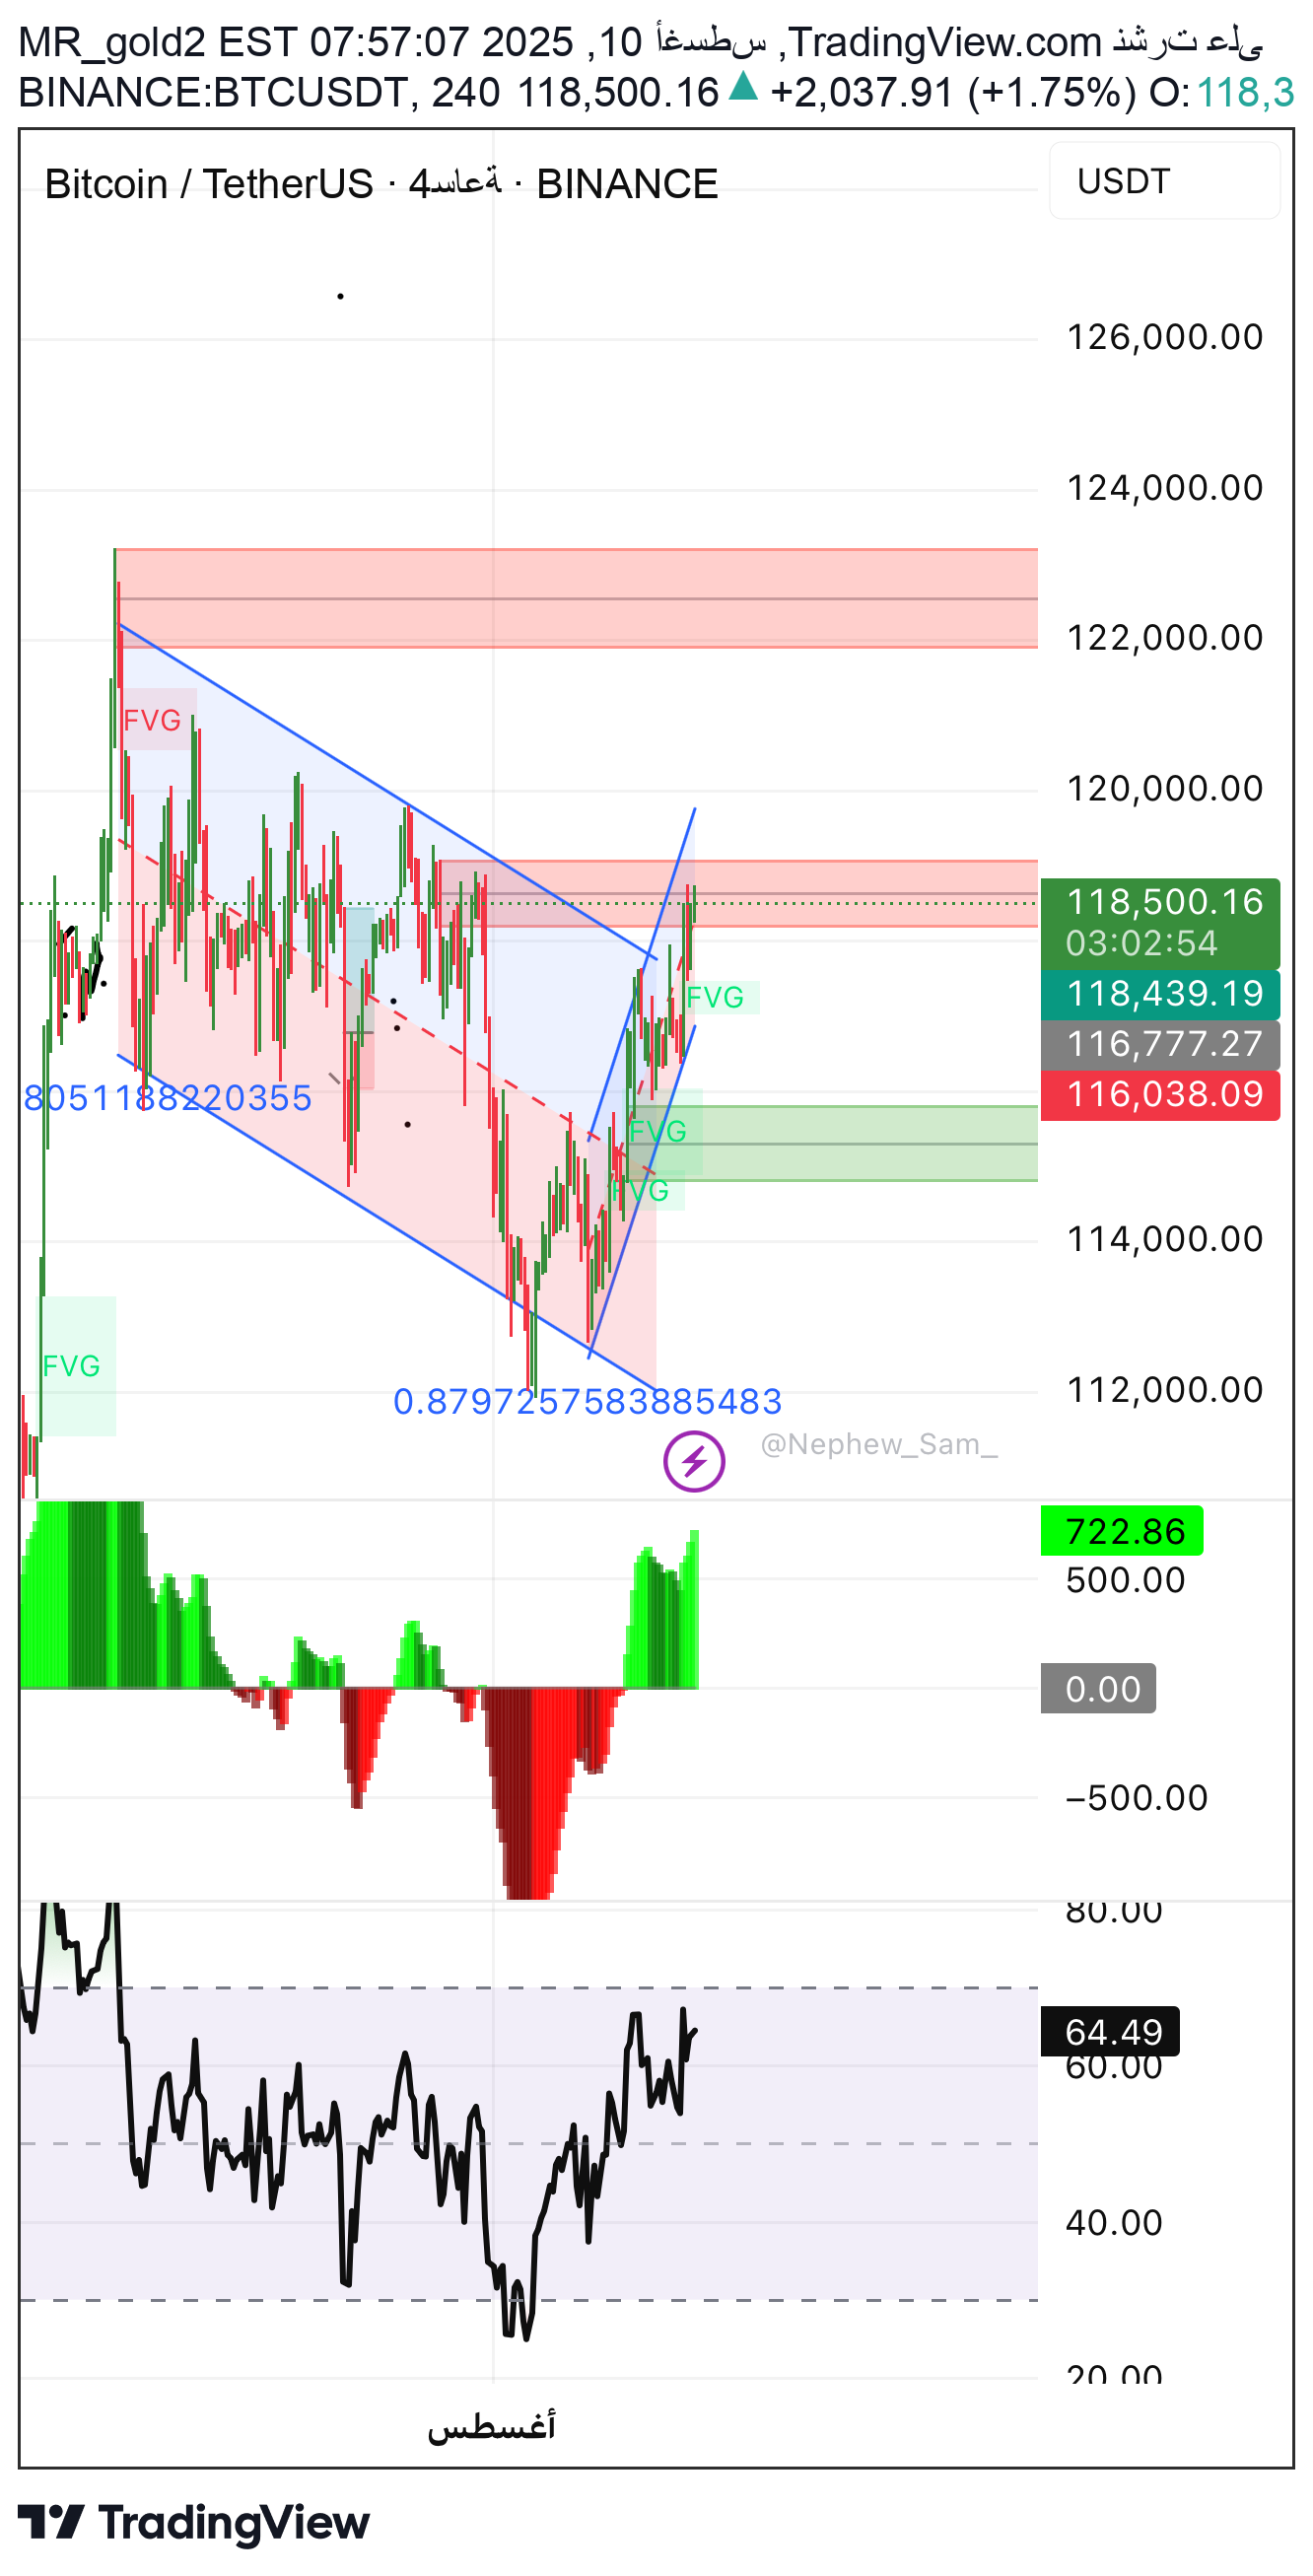
1. Technical Analysis (Technical) • The price is currently at $ 118,680 after a rise of +1.90%. • There is a clear fracture of the previous descending canal, while continuing to move over the green FVG areas (price gaps that may give support). • Indicators: • Maccing or the bottom green indicator gives a strong positive momentum. • RSI relativity index at 66.70 close to the purchasing saturation area, but there is still room for ascending before reaching 70. • The most important lawsuit: 118,439 - 116,777 - 116,038. • The most important resistors: 119,500 - 120,000. ⸻ 2. Elliott wave • It appears that we are in the third emerging wave after a previous correction, which means that there is a possibility of the extension of the wave towards 120,500 - 122,000 before entering the fourth corrective wave. • If we are at the end of the third wave, you should be careful not to corrected nearly 23% -38% of the wavelength. ⸻ 3. Time Analysis • Time, the current emerging movement is in line with a short -term cycle that has started since August 8. • If the momentum continues, the price may reach a new top within 1-2 days before a short correction. ⸻ 4. PRICE Levels & FVG • The price moves between the FVG areas that work as a strong claim. • The closest bullish price goals: 119,200 → 120,500 → 122,000. • In the event that support is broken 116,777, we may see a decline of about 115,000. ⸻ 5. Fundamental • There is no negative news influencing the moment, but Bitcoin strength is backed by the market's demand for digital assets with the weakness of the dollar recently. • The next news about inflation or American interest may affect strongly. ⸻ 6. Technical models (Chart Patterns) • Breaking an uprocessing channel → a rising reflection model. • FVG regions at the bottom of the price support the continuation of the short -term emerging trend. ⸻ 7. Harmonic Patterns • A complete Harmonic model does not appear on the displayed and the previous movement is similar to the beginning of the formation of the AB = CD model in the event of targeting 122,000 levels. ⸻ 8. Price Action • Strong rising candles with short lower tails → indicate the control of buyers. • The lack of strong reflex candles so far. ⸻ 9. Recommendation 📈 General Trend: Rising in the short term. • Buying support areas 118,400 - 117,800, stopping a loss below 116,700. • Goals: 119,500 → 120,500 → Then 122000 Any increase in momentum may reach 130 130,000 For more, I will be organized to my channels https://t.me/+fg1eedlg5imxzwvi
