Technical analysis by ScottMelker about Symbol BTC on 8/6/2025

ScottMelker
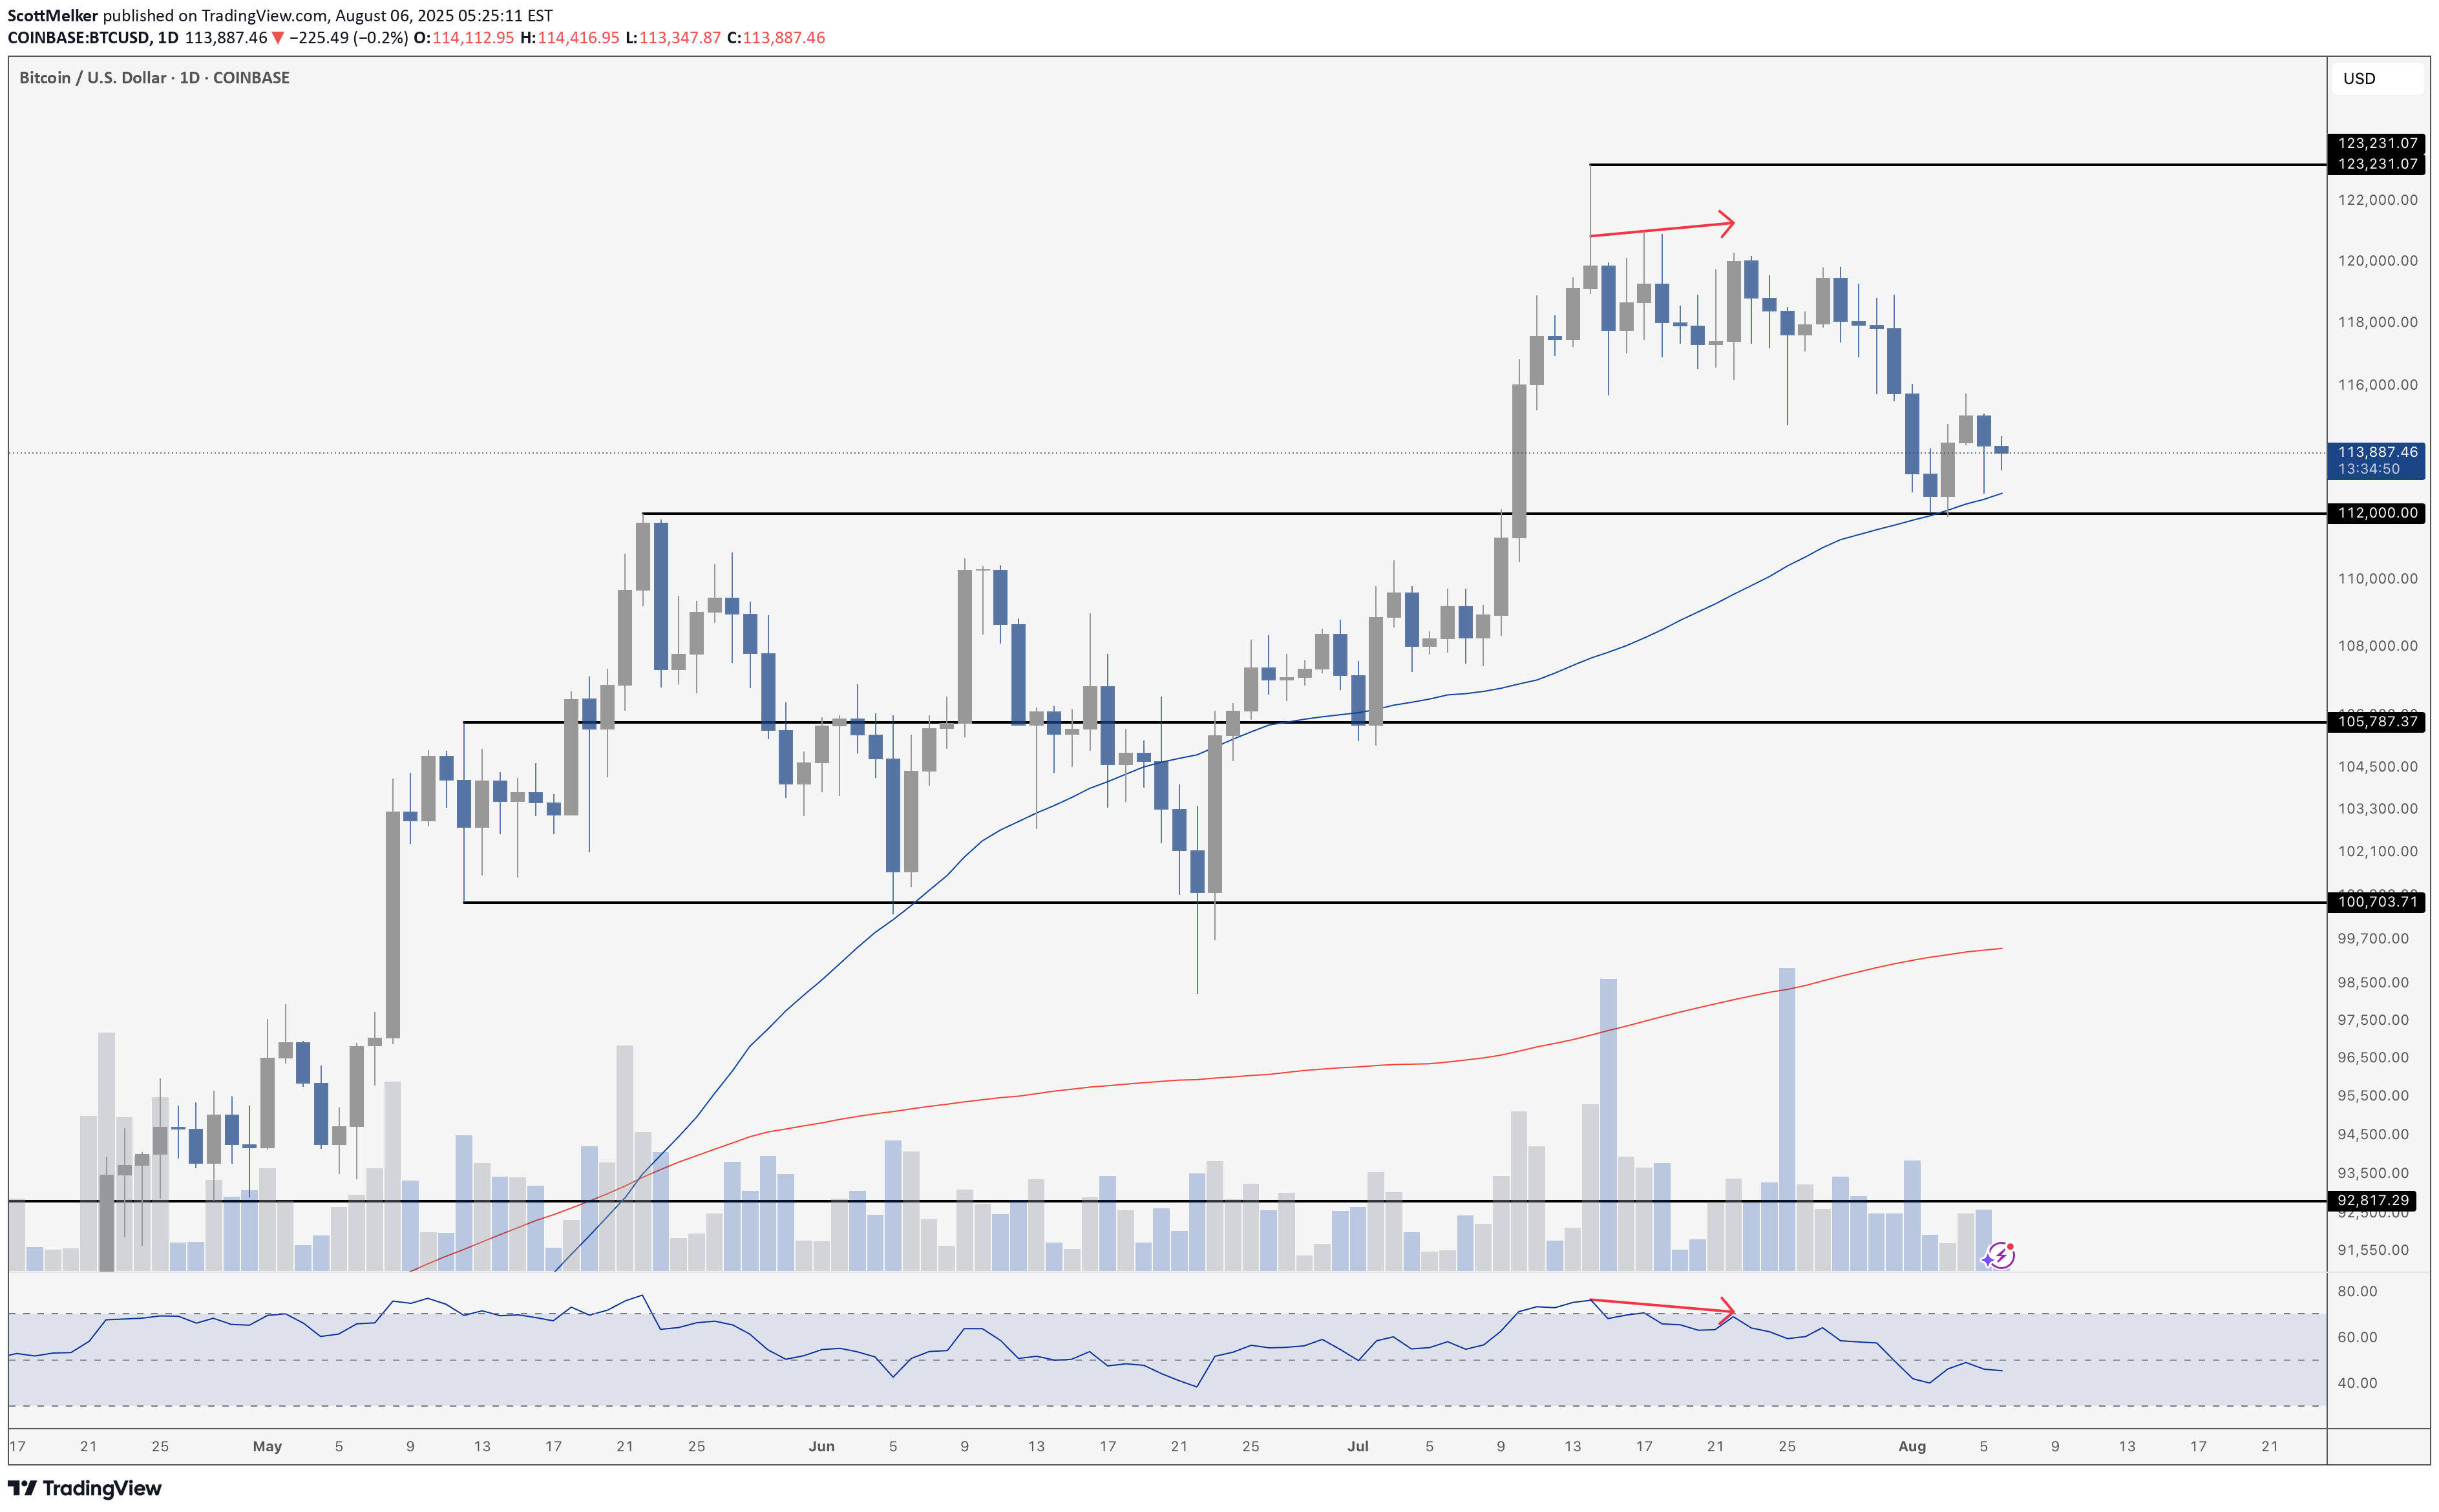
Bitcoin topped out at \$123,231 last month and has been pulling back ever since – but not in a chaotic way. The chart tells a familiar story: bearish divergence on the RSI as price made new highs, momentum quietly faded, and eventually the inevitable correction hit. Classic. Now we’ve pulled back into the \$112,000 region, which happens to align with a critical horizontal support zone and the 50-day moving average. This is where bulls need to make a stand. The good news? The drop came on declining volume, suggesting there’s no real panic here. Sellers aren’t exactly stampeding for the exits. But let’s not pretend buyers have stepped up with any conviction yet either – this is a wait-and-see moment. If \$112K fails, things could accelerate quickly, with downside targets around \$105,787 and \$100,703. That red line lurking around \$97K is the 200-day moving average – the last line of defense before the structure starts to fall apart. Momentum has reset and the RSI is hanging around the neutral zone. That’s not bullish, but it’s not death either. It just means we’re in purgatory – waiting for the next move. If the uptrend is going to stay intact, we need a higher low right here, right now. Bulls better start buying their own bags.
