Technical analysis by Tr8dingN3rd about Symbol BTC: Buy recommendation (8/4/2025)

Tr8dingN3rd
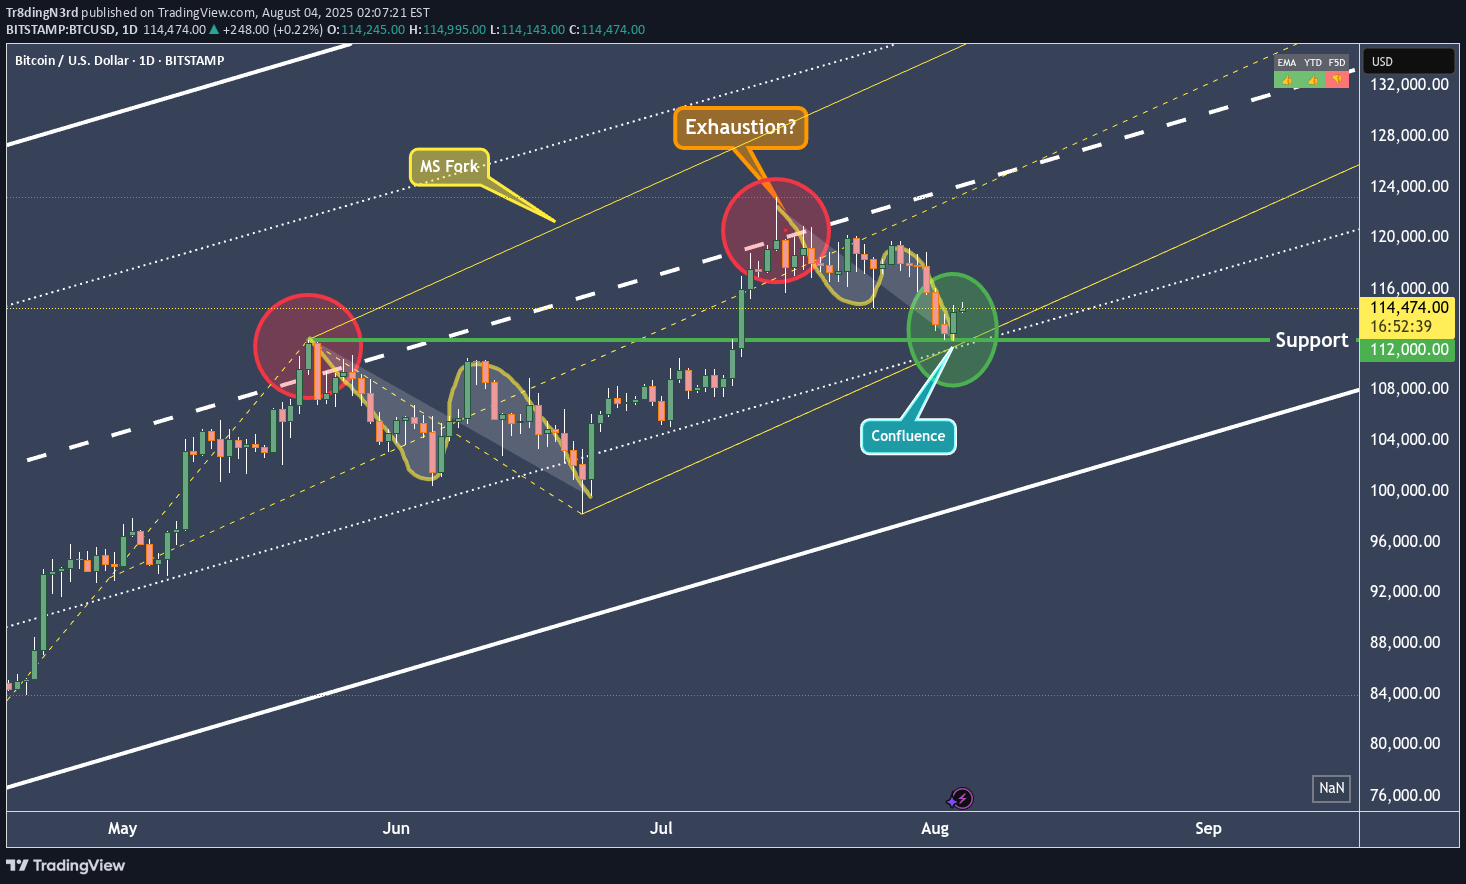
In the last post (see the Linked Chart), I showed why BTCUSD would fall, and I also pointed out where the first price level for a possible pause might be. On Friday, that level was reached, and the market seems to be turning *on the dot*. Will we now see higher prices again, or even a new all-time high? Let’s take a closer look: The “confluence” point is marked by the white fork and the yellow modified Schiff fork. This point lies exactly on the 1/4 line. And this line often indicates temporary levels where at least a pause in the movement can be expected. When we look at what Bitcoin did at this price level in mid-June, it seems likely that it will rise again. The overall pattern, from the centerline to the 1/4 line, looks extremely similar (see the A-B-C Wave Pattern)! And yet, I’m not entirely convinced by the picture. Because this was the second time we reached the centerline. For the brave, this wouldn’t be a bad entry point—or an opportunity to increase the position after this pullback. A possible stop for traders could be placed just below the current low, with targets at the centerline of course. But why not just lean back, enjoy the profits, and switch into observation mode for now… I will also make a video that explains the details and connections more clearly. Happy Monday and stay patient to fight the FOMO! §8-)
