
Tr8dingN3rd
@t_Tr8dingN3rd

What symbols does the trader recommend buying?
Purchase History
پیام های تریدر
Filter
BTCUSD - Nothing broken - so far
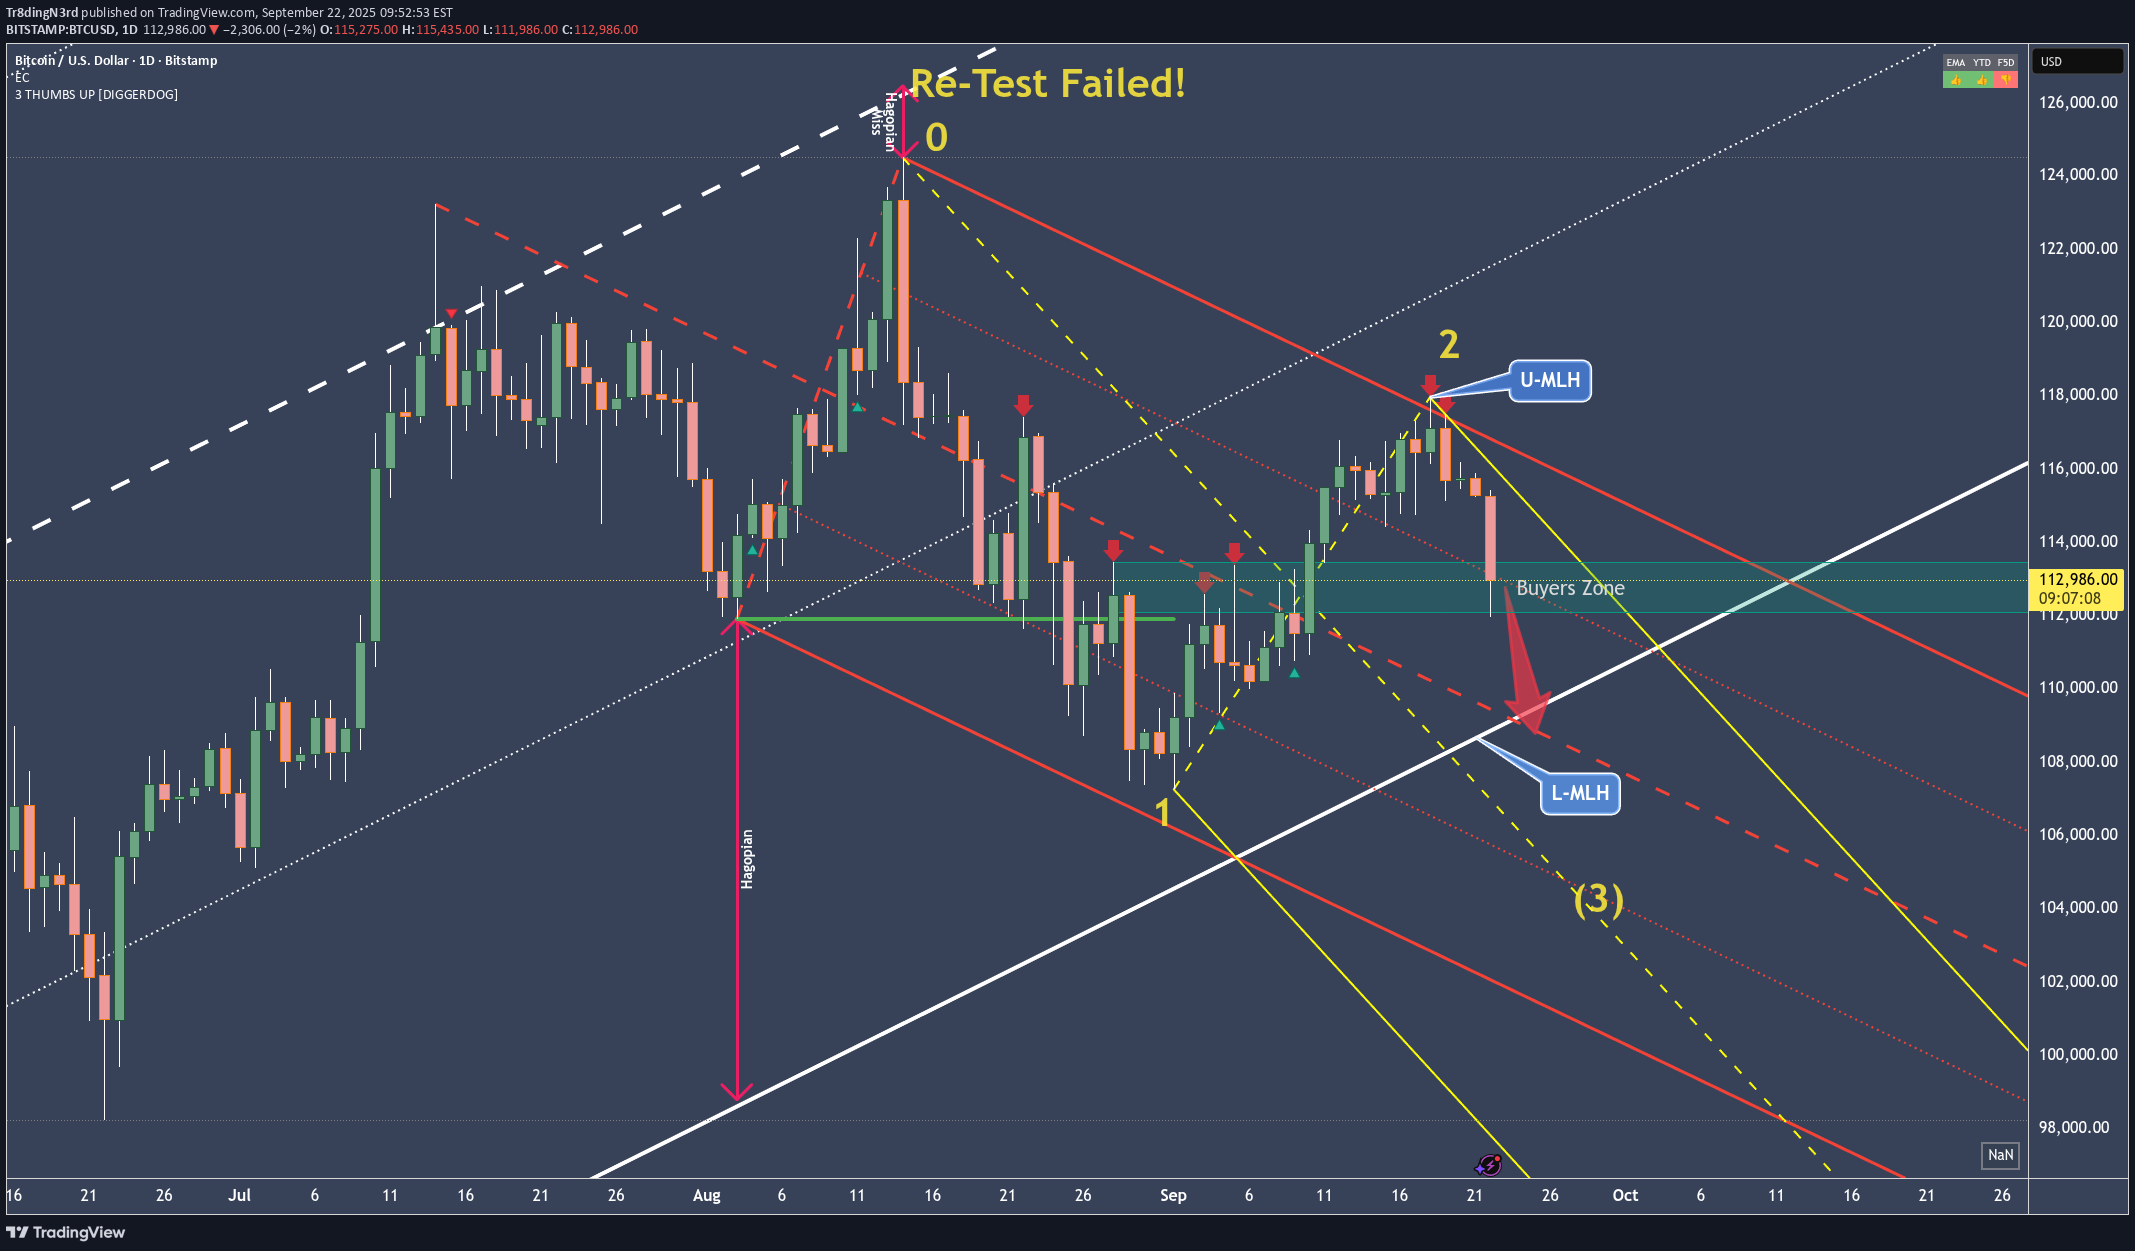
Up where the 0 (zero) is, at the white Centerline, BTC was trying to re-test it, when it came from the white 1/4 line. So a larger Hagopian kicked in, projecting price to go further down than from where it originally came. Price did what was projected by the Hagopian and cracked the low of 111'920. Then from Point 1, Bitcoin made it up to the red U-MLH. It was just natural resistance up there. Now we see a pullback to the south, which I had not expected last week. Even if we stop in the buyers zone, chances that BTC is trading down to the Centerline are around 80%. And down there we will find out if the white L-MLH will hold or not. If not, then we are in a 0 to 5 count to the south and we will see much lower prices. But as long as price can stay within the white Fork, we are still projecting it's most probable path to the upside in the long term timeframe. Happy new week and stay tuned for the news §8-)
TSLA Battery Is still loading - May the Energy be with you.
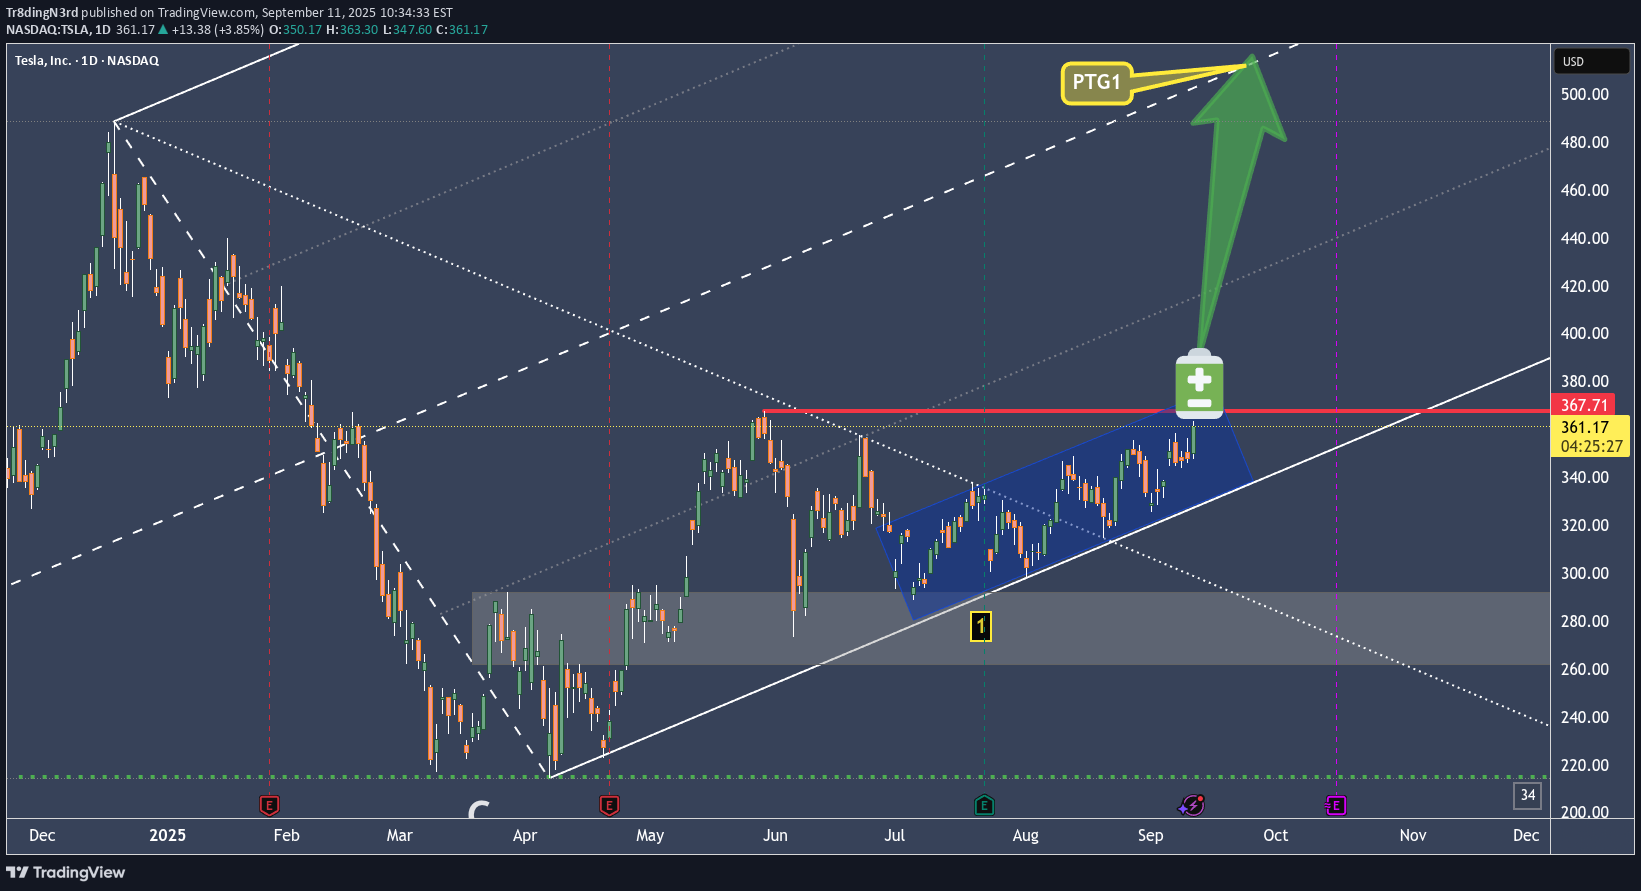
We see the slanted coil. It act's like a Battery loading energy. At one time it will expend it's energy, either up, or down. Forks show the most probable path of price. Forks provide a framework, where a Trader doesn't have to guess. Just trade the rule-book and follow your one plan. Either we get stopped or we are happy Teslonians. May the Energy be with you §8-)
BTCUSD is moving exponential and here's the setup
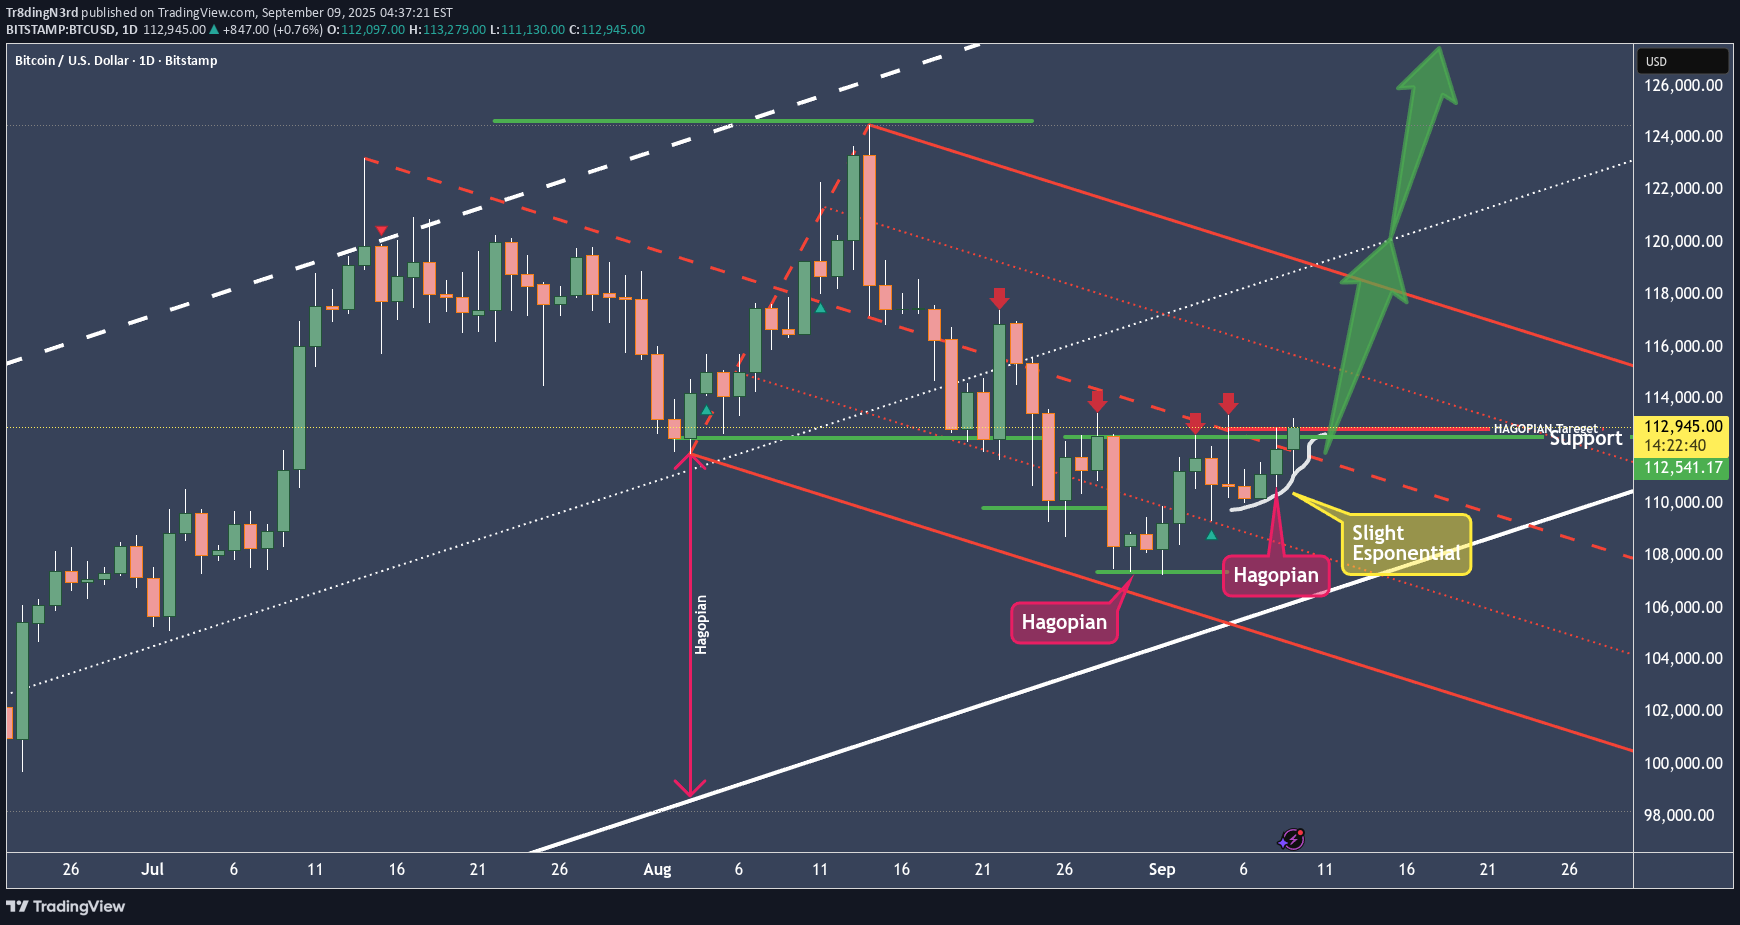
Because BTCUSD couldn't reach the L-MLH of the red fork twice, we have 2 HAGOPIANs cooking. That means, that price will move further in the opposite direction than from where price came. Price came from the Centerline, and that's where the high of the today's Candle peeked through. I expect more upside movement. As for a trade, I want to see price holding above the centerline. From there, PTG1 is the U-MLH and beyond that it's the white Centerline again (...which looks like it's going to the Moon, like XRPUSD). Of course, we seldom can eat the whole Cake. So we manage it and take partial profits on the way up. 🙏😊✨ Thanks for following and boosting folks. 🙏😊✨
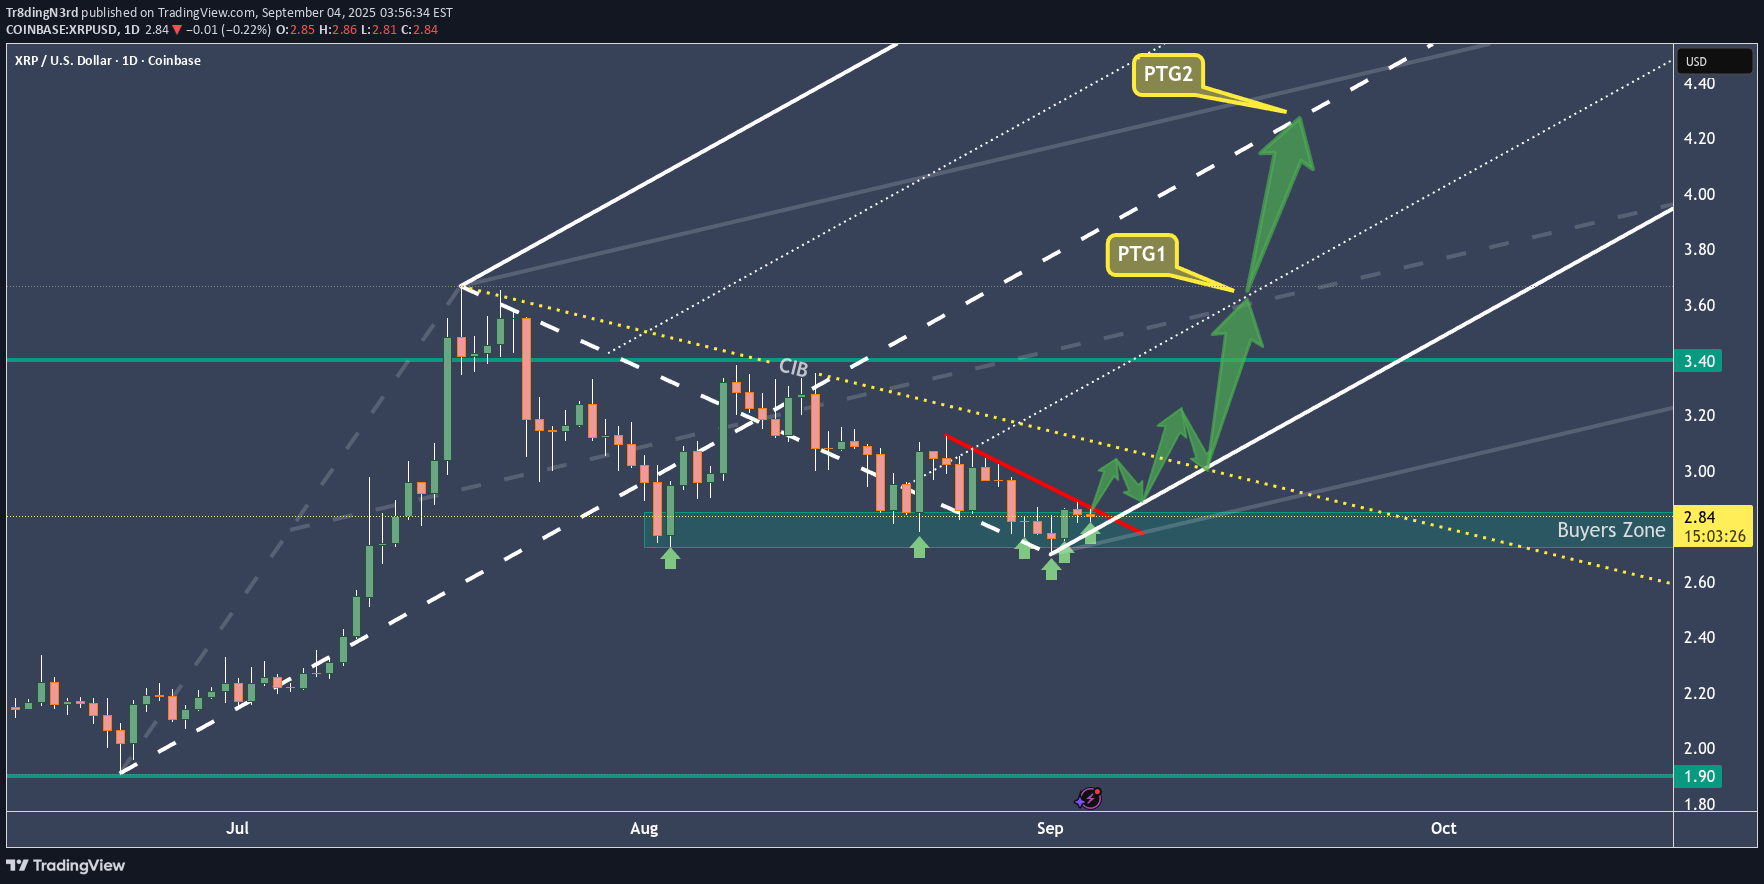
XRPUSD is following our projection
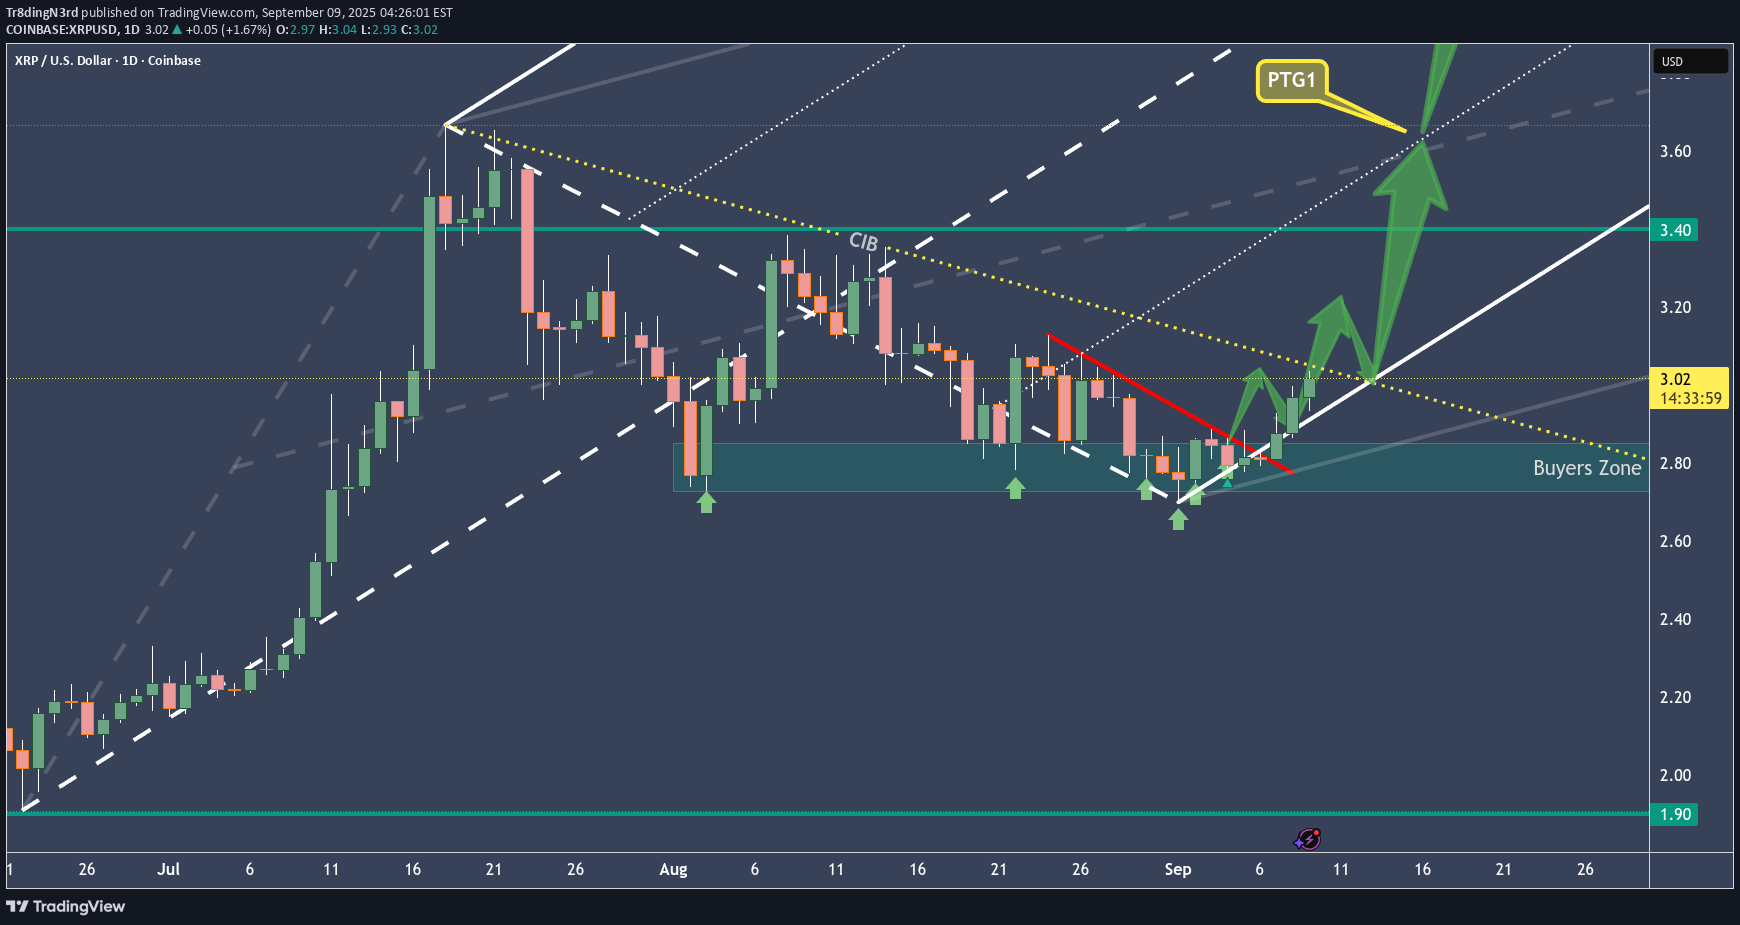
The red pressure line is broken. After dabbling with the L-MLH, price decided to jump back into the fork, projecting a potential huge move ahead. But not so fast! The slope of the white fork is super steep. In such situations I like to throw a Modified-Shiff-Fork, or a Shiff-Fork on the chart too. This gives me often more realistic profit targets. The trade could be managed by using the light-grey fork's centerline as PTG1 and the rest of the position aims for the white mooning centerline §8-) A second steak of the position could be loaded, after the yellow CIB-Line is broken. I like to wait for a test of it after the crack and jump-above. It's the same like a test/retest of a Medianline-Parallel if price broke out of it. Let's have fun here §8-)
XRPUSD - How Ripple is preparing for a potential big move
The white Fork marks the most probable path of price. There is currently no indication, that Ripple really want's to take off to the upside, but: We have some potential points that could give us a clue: 1. Price seems to stabilize at the L-MLH. 2. There's a clear pressing going on (red line), which mostly will vanish when price pops above. 3. The L-MLH and the yellow CIB are pullback levels where price pauses If we trade below the Support Zone, the idea is thrown in the bin. Let's hold the water and see what happens .
Bitcoin is nearing support
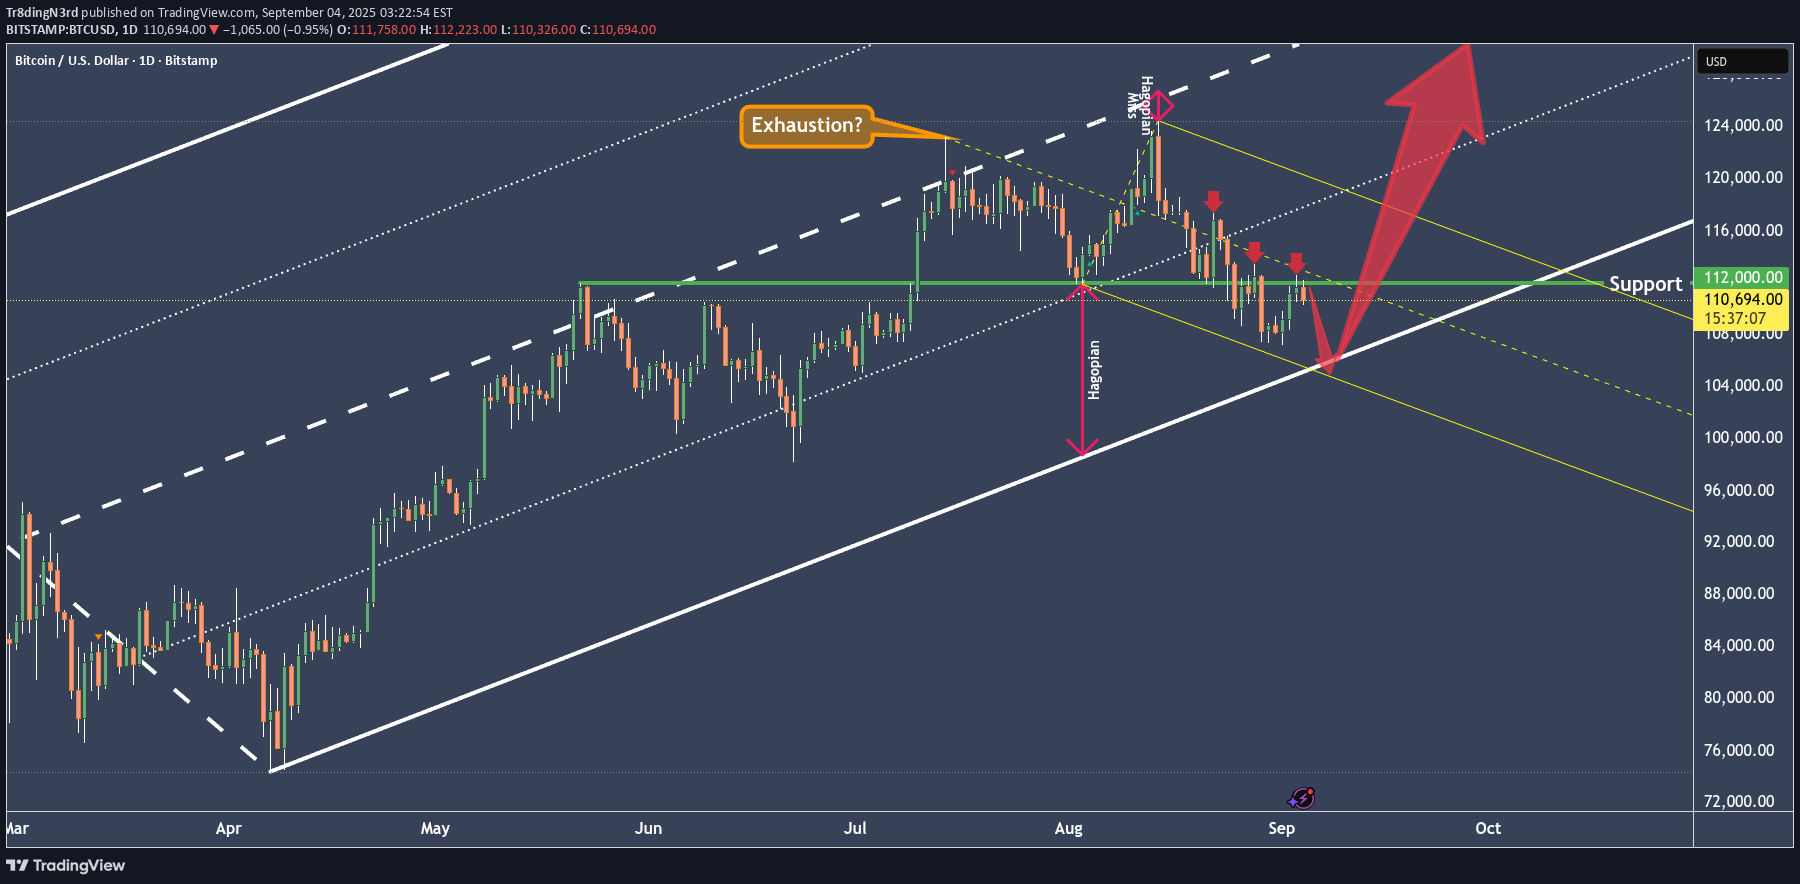
First, we touched the white Centerline twice. The third attempt was a miss and triggered a Hagopian, which got filled in mid-August. Already below the yellow Centerline, Bitcoin wasn’t able to climb back above it. Now, price is near the L-MLH of both Forks, indicating that potential support lies just ahead. Let’s see if we can hold at the white L-MLH and find a long entry, which would hopefully shoot us back up to the Centerline (remember: there’s an 80% chance of reaching the Centerline). Patience is key, so let’s relax, grab some popcorn, and watch this movie §8-)
MSTR - Here comes #5 at the Centerline
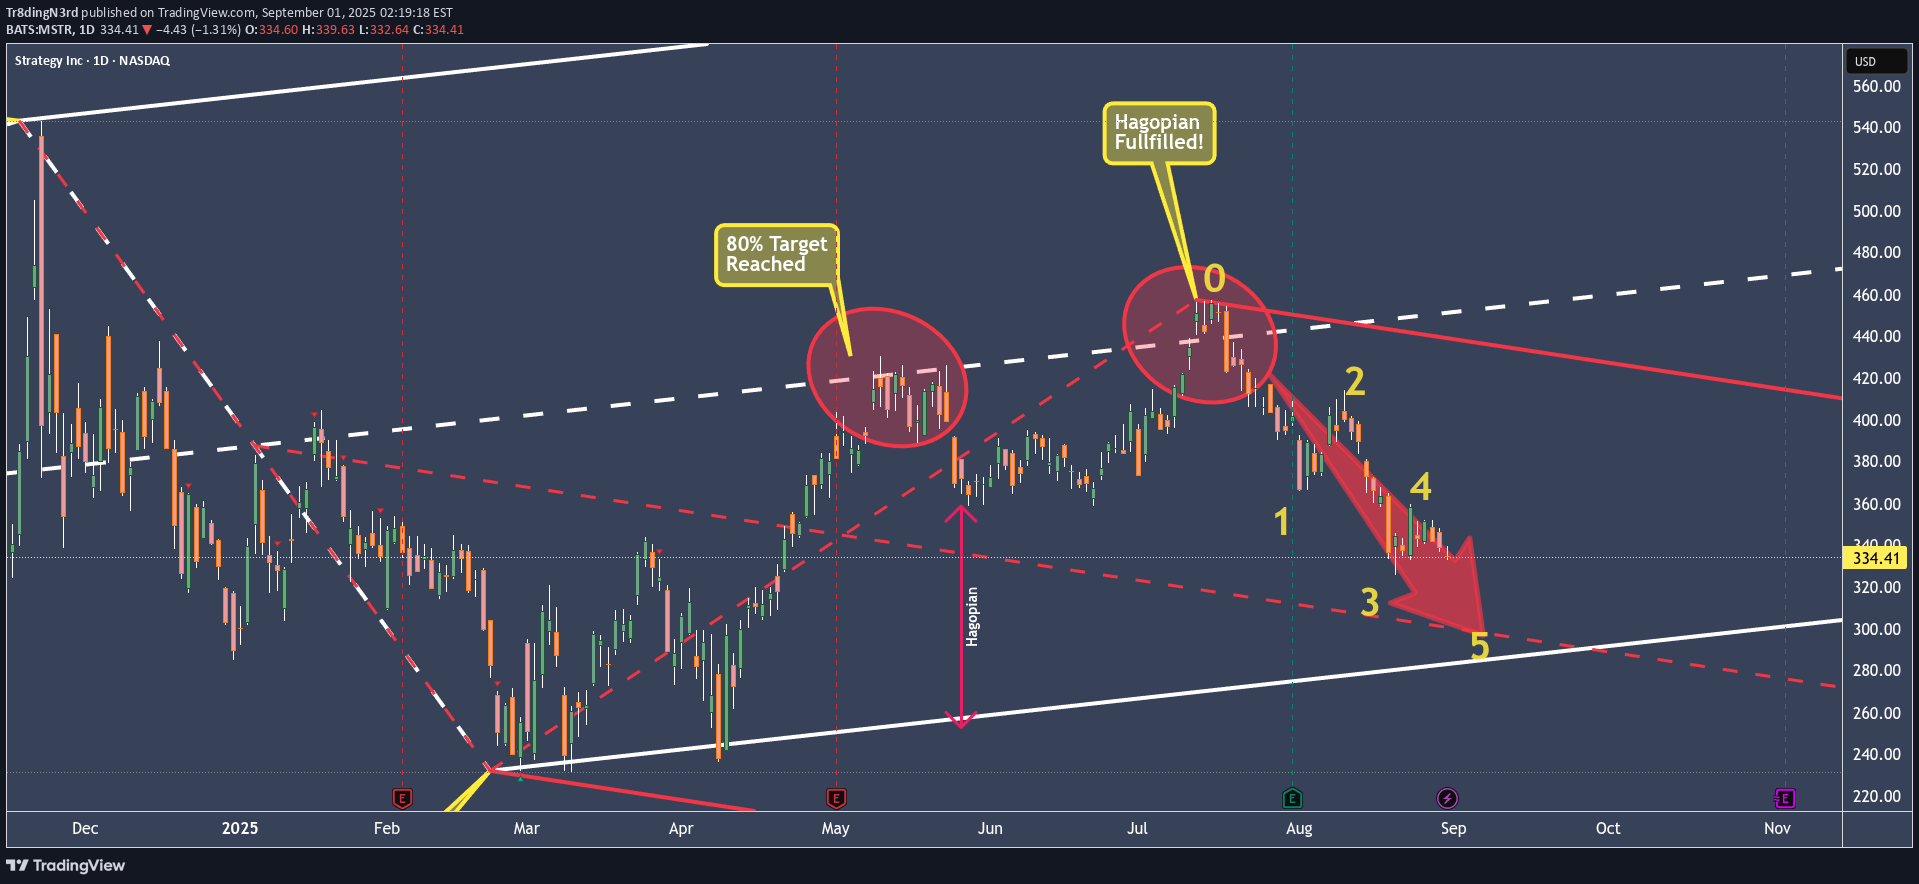
Remember when I said, I do it again Sam? Nothing changed. Only the price in the consolidation at P4. This will temporarily end at P5 (Yellow Count), where I'll take my profit. With a little pressure, price will even make it to the L-MLH. Then I'll relax and watch, how the Chickens run around and create new opportunity. 🐔🐓 Don't be a Chicken, be the 🦊 Fox 🦊, be clever and have patience. Happy new week all §8-)It resists to go down hahaa. Patience, just patience and trailing your profit stop.
NVDA - Watch the show, until the Sh** hits the Fan
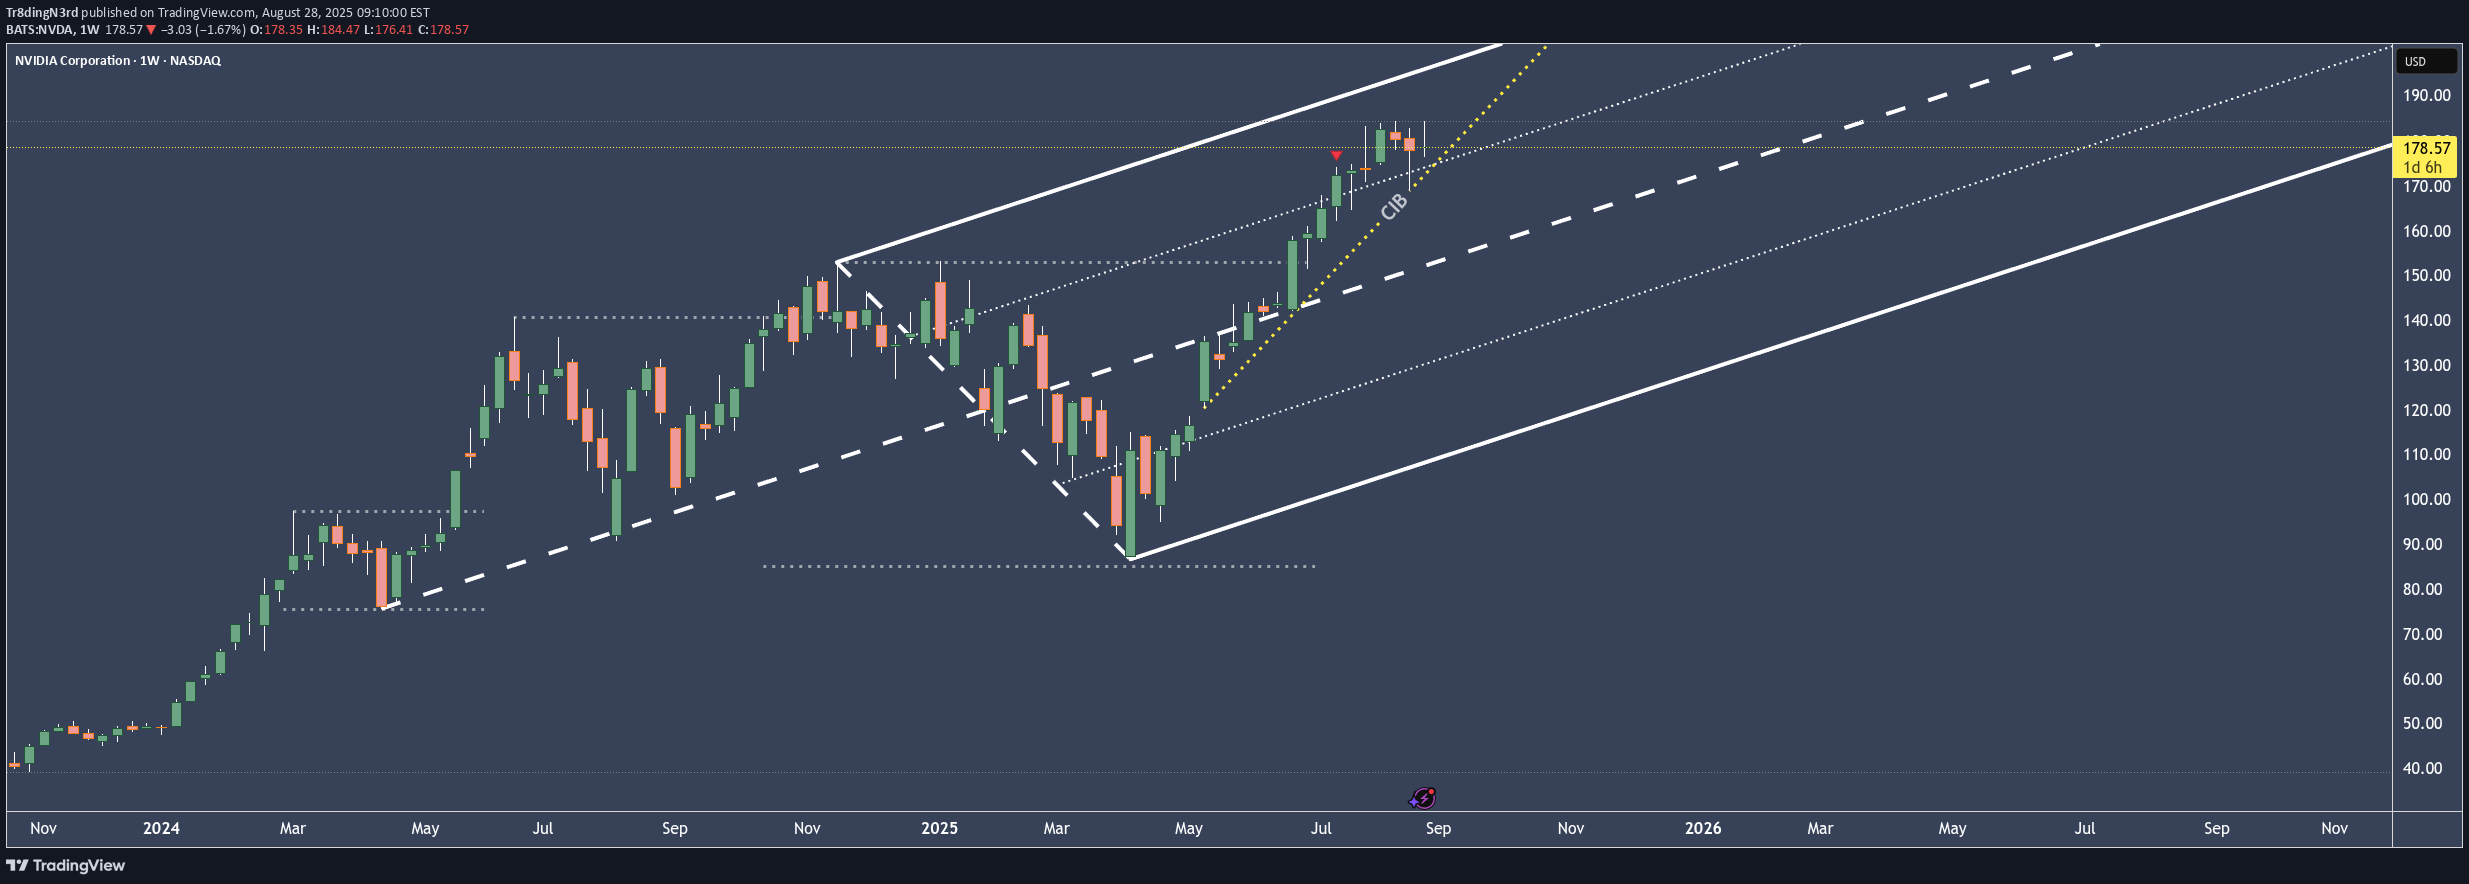
The expected “end of hype” around Nvidia stems from its current inability to forecast H20 chip sales to China, forced production halts, and growing political friction—despite its strong financial performance elsewhere. The tension between U.S. export policy and China’s technological self-reliance is creating real operational and strategic obstacles for Nvidia. In this weekly chart we still have an upward projection. Nonetheless do we all know what a Game NVDA is playing by selling to its one companies. The air is thin, very thin up there. And after the Earnings Report we all know how the books are pimped. A breach of the CIB line would make me go "hmmm....", and starting to look for a short. Until then, just relax and watch the show.
MSTR Ponzi is paying for my yearly steak & lobster subscription
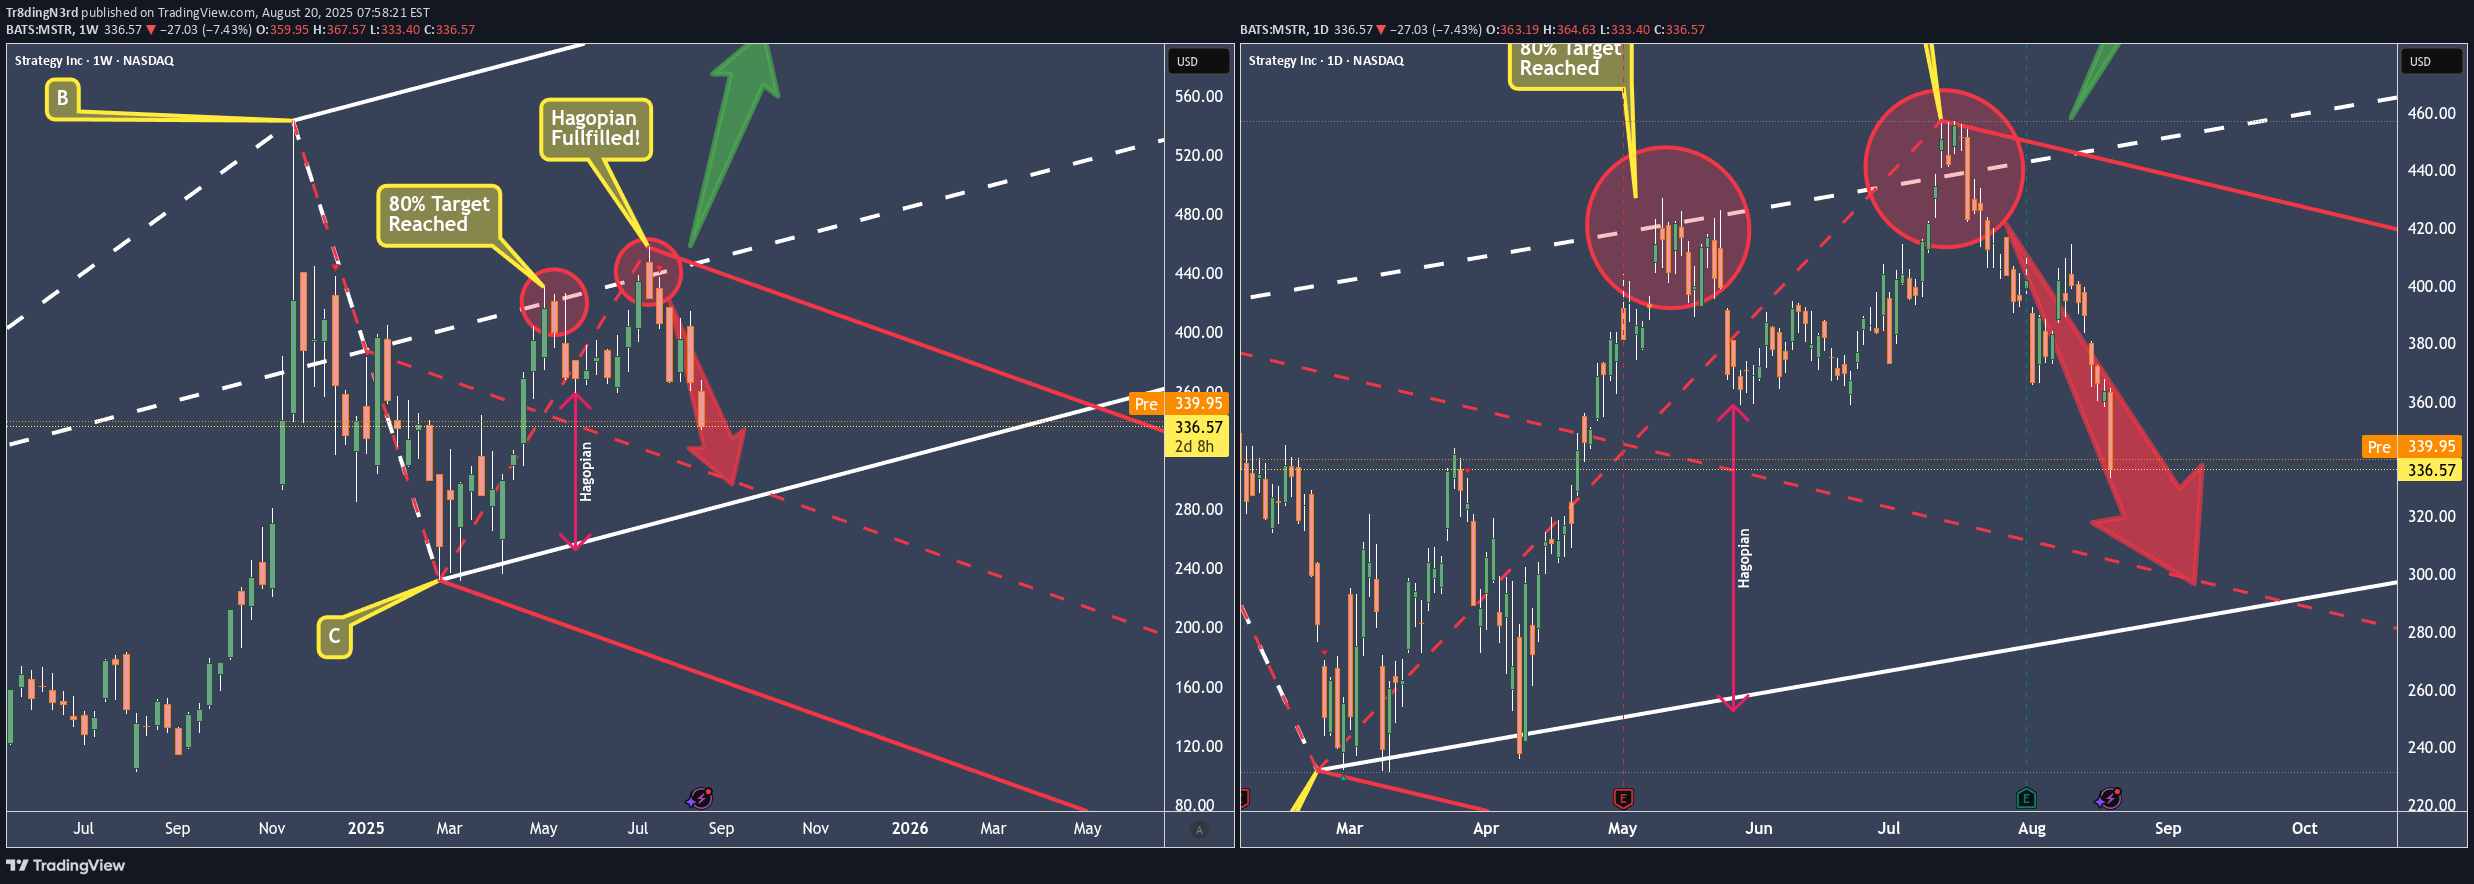
We can see that from the white Centerline, MSTR has only been heading south. In contrast, Bitcoin has held up quite a bit better so far. If you go back through my posts, you’ll see that I’ve been warning for a long time that MSTR is basically feeding itself. That simply can’t end well! Either way – we gratefully take our profit and wait until we reach the lower centerline. Because we know there’s about an 80% chance that the price will fall back into temporary equilibrium, the Centerline And if you’re not too greedy, well then you take 70%–80% of the profits now and let the rest run. Anyone who was able to learn something from this trade or even make profits is welcome to boost and comment. §8-) YT video will be available tomorrow. ...and on we go.
NQ – Nasdaq follows the witch’s SPY prophecy
Not only is the S&P 500 following the oracle in the SPY, but the Nasdaq has also given us a short signal. So, the scenario is the same as with SPY: short down to the Centerline. For the indicator traders, I’ve also added the EMA(10) and EMA(20). Look at how well they’ve provided support so far. If the EMA(20) cracks, things will get hot. And if the CIB line (Change In Behavior) also breaks, then all hell breaks loose! As already mentioned in the SPY post, it wouldn’t be a shame to take at least 50% of the profits you’ve accumulated so far. Because if it goes further up, e.g. above the U-MLH, you still have 50% left to benefit. If it goes down, we’ve already bagged 50%. BTW: At the 1/4 line, we can usually expect support. Exciting times, when maybe it’s better to sit still and keep your hands to yourself. I’ll create the YT video with details tomorrow. Happy profits to you all!
Disclaimer
Any content and materials included in Sahmeto's website and official communication channels are a compilation of personal opinions and analyses and are not binding. They do not constitute any recommendation for buying, selling, entering or exiting the stock market and cryptocurrency market. Also, all news and analyses included in the website and channels are merely republished information from official and unofficial domestic and foreign sources, and it is obvious that users of the said content are responsible for following up and ensuring the authenticity and accuracy of the materials. Therefore, while disclaiming responsibility, it is declared that the responsibility for any decision-making, action, and potential profit and loss in the capital market and cryptocurrency market lies with the trader.