Technical analysis by Innotrade_AJ about Symbol LINK: Buy recommendation (7/29/2025)

Innotrade_AJ
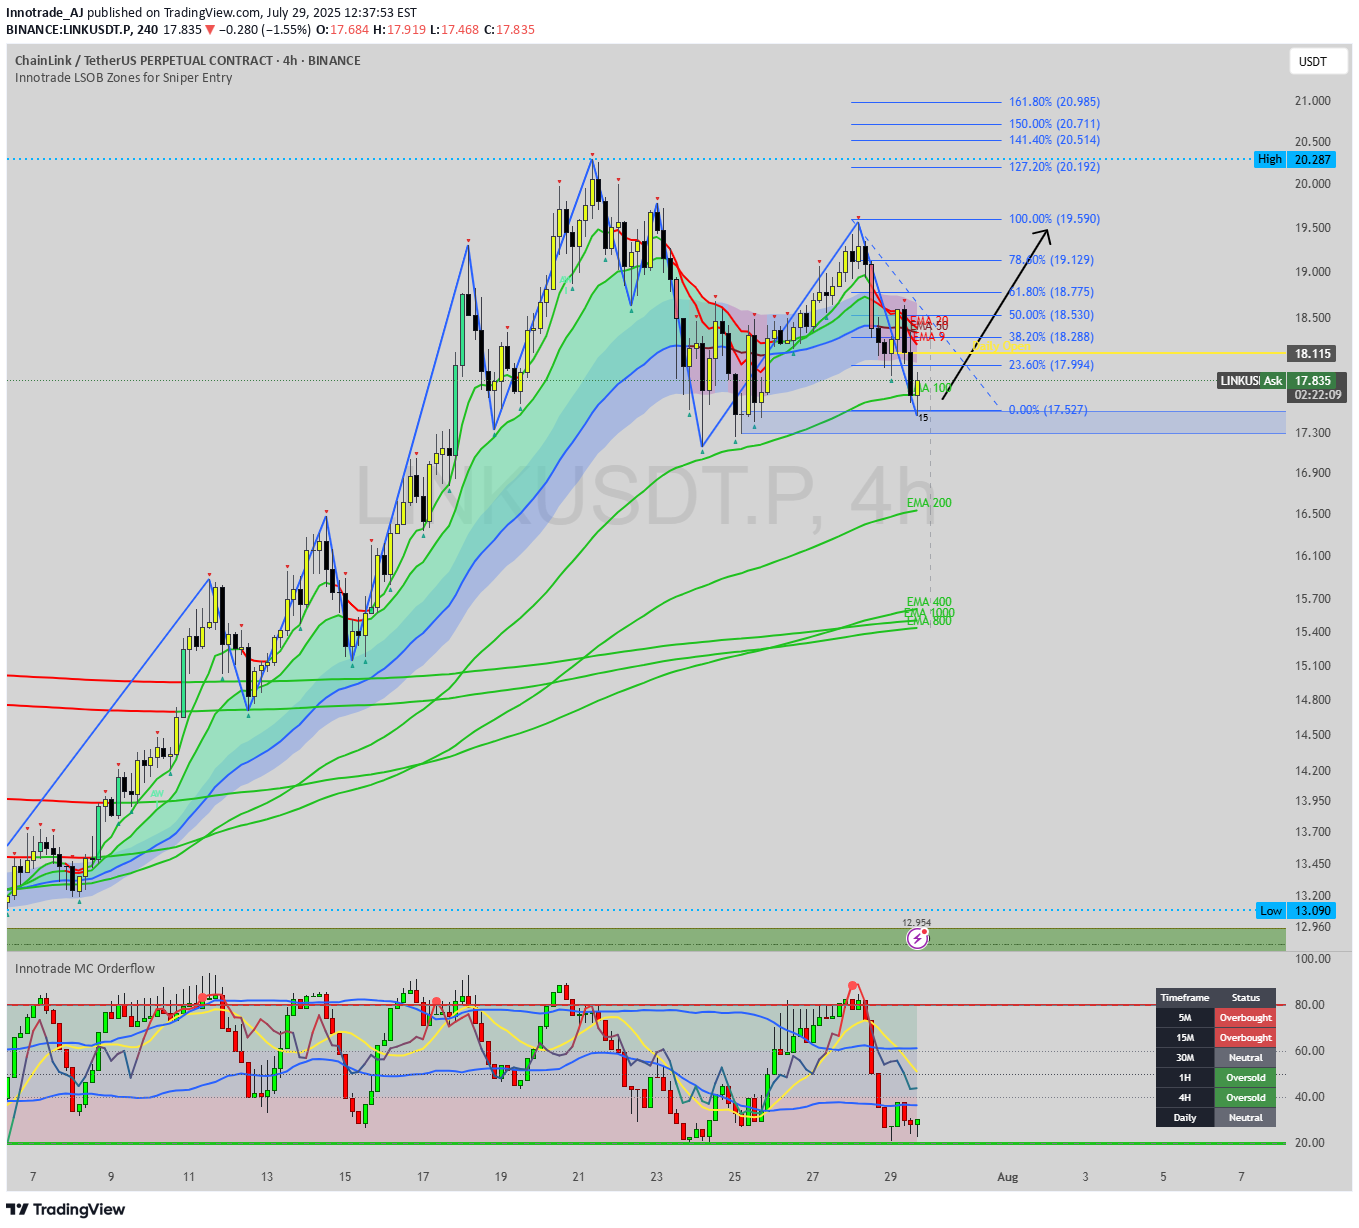
Today we're analyzing Chainlink (LINK), which is currently testing a critical support level after a sharp pullback from the $20.28 highs. The price is now situated at a technical crossroads that will likely determine its next major directional move. This analysis will detail the powerful confluence of technical factors that make the current zone a high-probability area for a bullish reversal. This is an educational breakdown of how to stack multiple signals to identify a strong "buy the dip" opportunity within a larger uptrend. The Analysis: A Convergence of Bullish Factors The most reliable trade setups occur when several independent indicators all point to the same conclusion. On this 4-hour chart for LINK, we have a textbook example of such a convergence. 1. The Overarching Bullish Structure: First, let's look at the big picture. The Zig-Zag indicator shows a clear and healthy uptrend, defined by a series of higher highs and higher lows. This establishes our primary bias. The current downward move is corrective, not a trend reversal, meaning our focus should be on finding logical entry points to rejoin the dominant trend. 2. The Critical Support Cluster: LINK is currently testing a powerful floor of support between $17.30 and $17.80. This is not just one level, but a cluster of three key support elements: Prior Swing Low: The price is testing a key structural low, a natural point where buyers are expected to show interest. Demand Zone / Order Block: A significant demand zone (the blue-shaded area) is located here, representing an area of prior institutional buying interest. The EMA 100: Providing a strong layer of dynamic support, the EMA 100 is flowing directly into this structural and order block zone. The confluence of these three factors creates a formidable support area. 3. The Momentum Exhaustion Signal: This provides the crucial timing for our setup. While the price has been dropping, our momentum dashboard shows that sellers are running out of steam precisely as price hits this key support cluster. The 1H and 4H timeframes are both registering as "Oversold." This indicates that on the timeframes most relevant to our chart, selling pressure is exhausted. It's a classic sign that the corrective move is overextended and a reversal is likely. The Potential Trade Plan Based on this strong alignment of structure, support, and momentum, here is a potential trade plan: Entry Zone: The current support cluster between $17.30 and $17.80 is the ideal zone to watch for bullish price action and potential entries. Stop Loss: A logical stop loss can be placed just below the recent swing low and the demand zone, around $17.10. A break below this level would invalidate the immediate bullish thesis. Potential Targets: Target 1: A reclaim of the Daily Open at $18.11. Target 2: A test of the overhead resistance and the descending short-term MAs in the $18.80 - $19.20 area. Target 3: A full retest of the major swing high at $20.28. Conclusion We have a powerful confluence of bullish factors: the price is respecting a primary uptrend structure, it has entered a key support cluster (swing low + demand zone + EMA 100), and multi-timeframe momentum is signaling that sellers are exhausted. This presents a compelling, high-probability setup for a long position on Chainlink. Disclaimer: This analysis is for educational purposes only and does not constitute financial or investment advice. Trading involves a high level of risk. Always conduct your own thorough research and consult with a licensed financial advisor before making any trading decisions.
