Technical analysis by cryptodailyuk about Symbol BTC on 7/24/2025

cryptodailyuk
BTC/USD 4H Chart Review
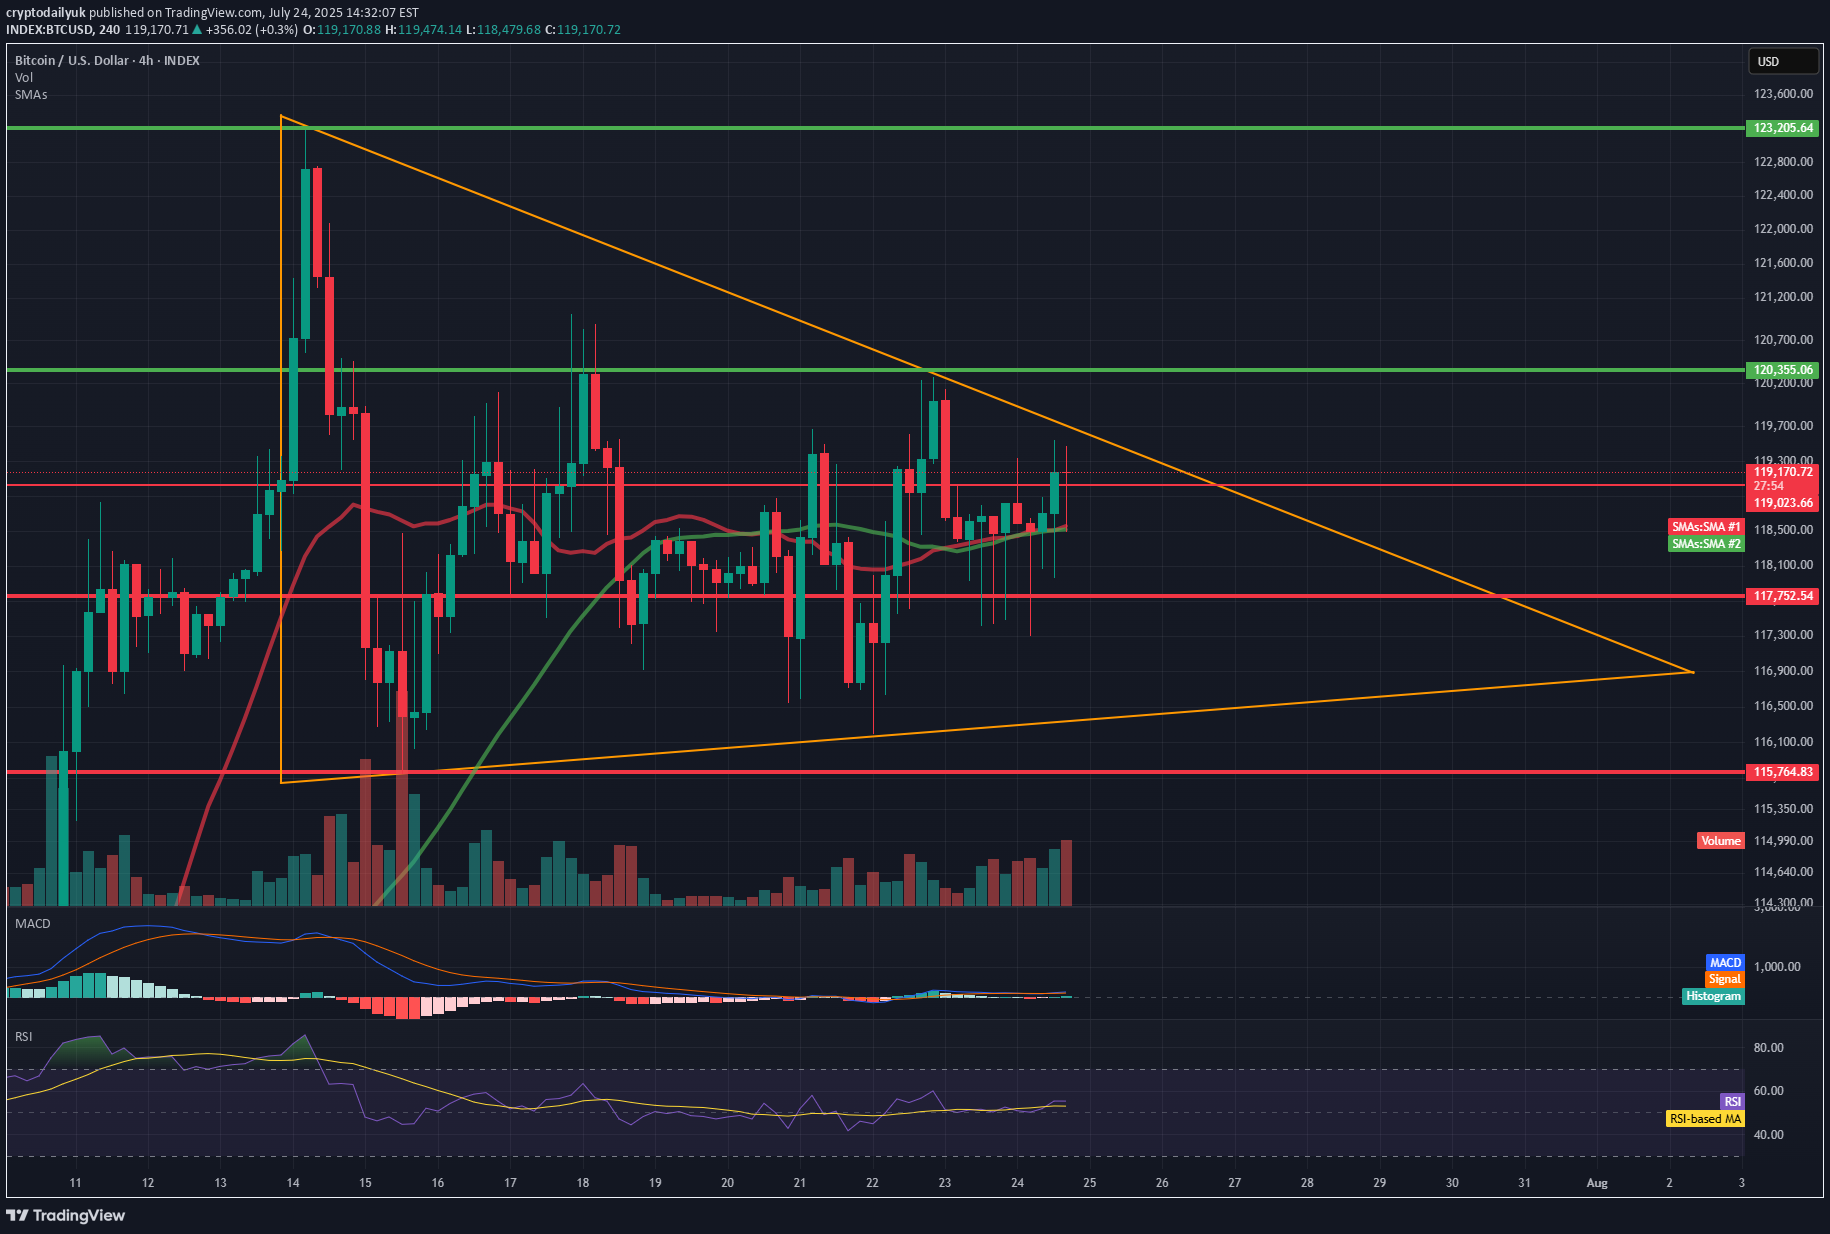
📊 Technical Structure (Symmetrical Triangle) Formation: The symmetrical triangle (orange lines) remains intact—price continues to move within it. Approaching the apex: The closer to the intersection of the triangle's arms, the greater the probability of a breakout. The current candle is testing the upper boundary of the formation (around $119,300), but has not yet broken it. Direction: The formation is neutral, but tension is increasing. A breakout of either line (the upper boundary ≈$119,500 or the lower boundary ≈$117,700) could trigger a dynamic move with a range of around $3,000 (the height of the triangle at its widest point). 🧱 Support and Resistance Levels (Red and Green Lines) Type Level (USD) Description Resistance 123205 All-Time High – Possible Target After an Upward Breakout Resistance 120556 Local Resistance – Triangle Breakout Range Resistance 119200–119300 Currently Tested Level Support 117752 Lower Triangle Boundary – Critical Defense Line Support 115764 Next Local Support 📈 Technical Indicators 🔵 RSI (Relative Strength Index) Currently: ~55 – indicates a neutral situation, having broken down from the overbought level (~74). Indicates that the market has temporarily cooled down after a previous impulse. There is still room for further upward movement without exceeding 70. 🔵 MACD The MACD and signal lines are approaching a crossover – if the MACD crosses the signal line upward, it could be a bullish signal. The histogram is slightly positive – indicating weak but growing bullish momentum. 📊 Volume Slightly increasing in the last candles – no confirmation of a strong breakout yet, but upward pressure is building. 🧠 Interpretation Scenario Technical Conditions Movement Objective 🔼 Upward Breakout Candlestick close above $119,500 USD 122,000–$123,200 USD 🔽 Downward Breakout Close below 117,750 and confirmed by volume at 115,700, then 114,000 USD 🔄 Consolidation Inconclusive, continued sideways movement Between $117,700 and $119,500 USD ✅ Summary Bitcoin is still in a neutral symmetrical triangle formation but is approaching a turning point. The RSI has broken out of the overbought range, and the MACD is signaling a potential upside breakout. Volume confirmation is still lacking, but technical conditions favor the bulls – if it manages to break above 119,500 and hold above, a move towards 122,000–123,000 USD can be expected. In the event of a rejection, maintaining 117750 will be key; breaking it opens the way to 115700 and below.