Technical analysis by Mentor_Michael03 about Symbol XRP: Sell recommendation (7/23/2025)

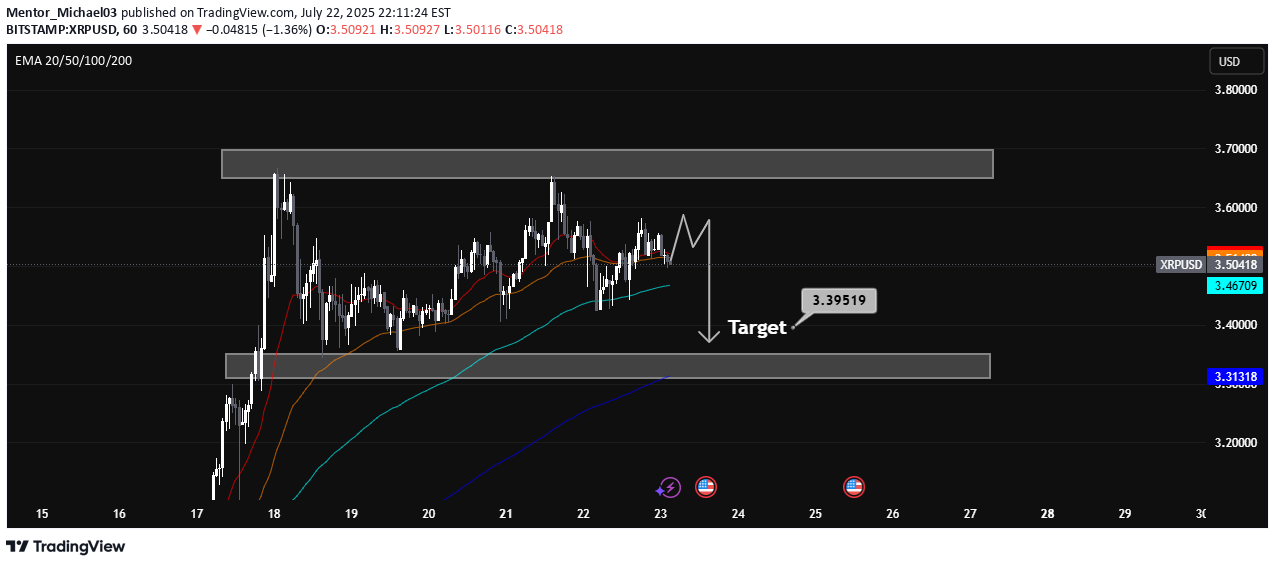
XRPUSD Technical Analysis — Bearish Retracement in Play Overview: XRPUSD is currently exhibiting signs of bearish momentum after failing to break through a key resistance zone. Price action suggests a potential retracement towards the marked target level of 3.39519, supported by multiple technical indicators and price structure. Key Technical Levels: Immediate Resistance: 3.70 – 3.75 (strong supply zone; price rejected here multiple times). Support Zone: 3.30 – 3.39 (prior demand zone and EMA confluence). Target: 3.39519 (short-term bearish target as marked on chart). Current Price: 3.50 (as of chart time). Indicators & Price Action: EMA Analysis: EMA 20/50 (red/orange) are flattening out, indicating weakening short-term momentum. EMA 100 (cyan) acts as current dynamic support. EMA 200 (blue) is far below, suggesting room for deeper retracement if sentiment weakens. Price Structure: XRPUSD formed a double top near resistance, followed by lower highs. Recent candle patterns show indecision and possible distribution. Projected bearish leg toward 3.39519 suggests sellers are in short-term control. Conclusion: XRPUSD is likely to retest the 3.395 support level after rejecting the upper resistance zone. The bearish structure is supported by EMA alignment, price action, and repeated failure to break resistance. A break below 3.395 could open further downside towards 3.31. However, a strong bounce from support could invalidate this setup. Trade Bias: Short-term bearish toward 3.395, watching for reaction at support.XRP Chart Update XRP successfully hit the support zone target, confirming the expected move from the resistance rejection. Price reacted precisely at the marked level, showing respect for the technical structure. Watching now for potential bounce or breakdown.
