
Mentor_Michael03
@t_Mentor_Michael03

What symbols does the trader recommend buying?
Purchase History
پیام های تریدر
Filter
Mentor_Michael03
اتریوم در آستانه انفجار قیمتی: نشانههای جمعآوری توسط نهنگها و سطوح کلیدی پیش رو
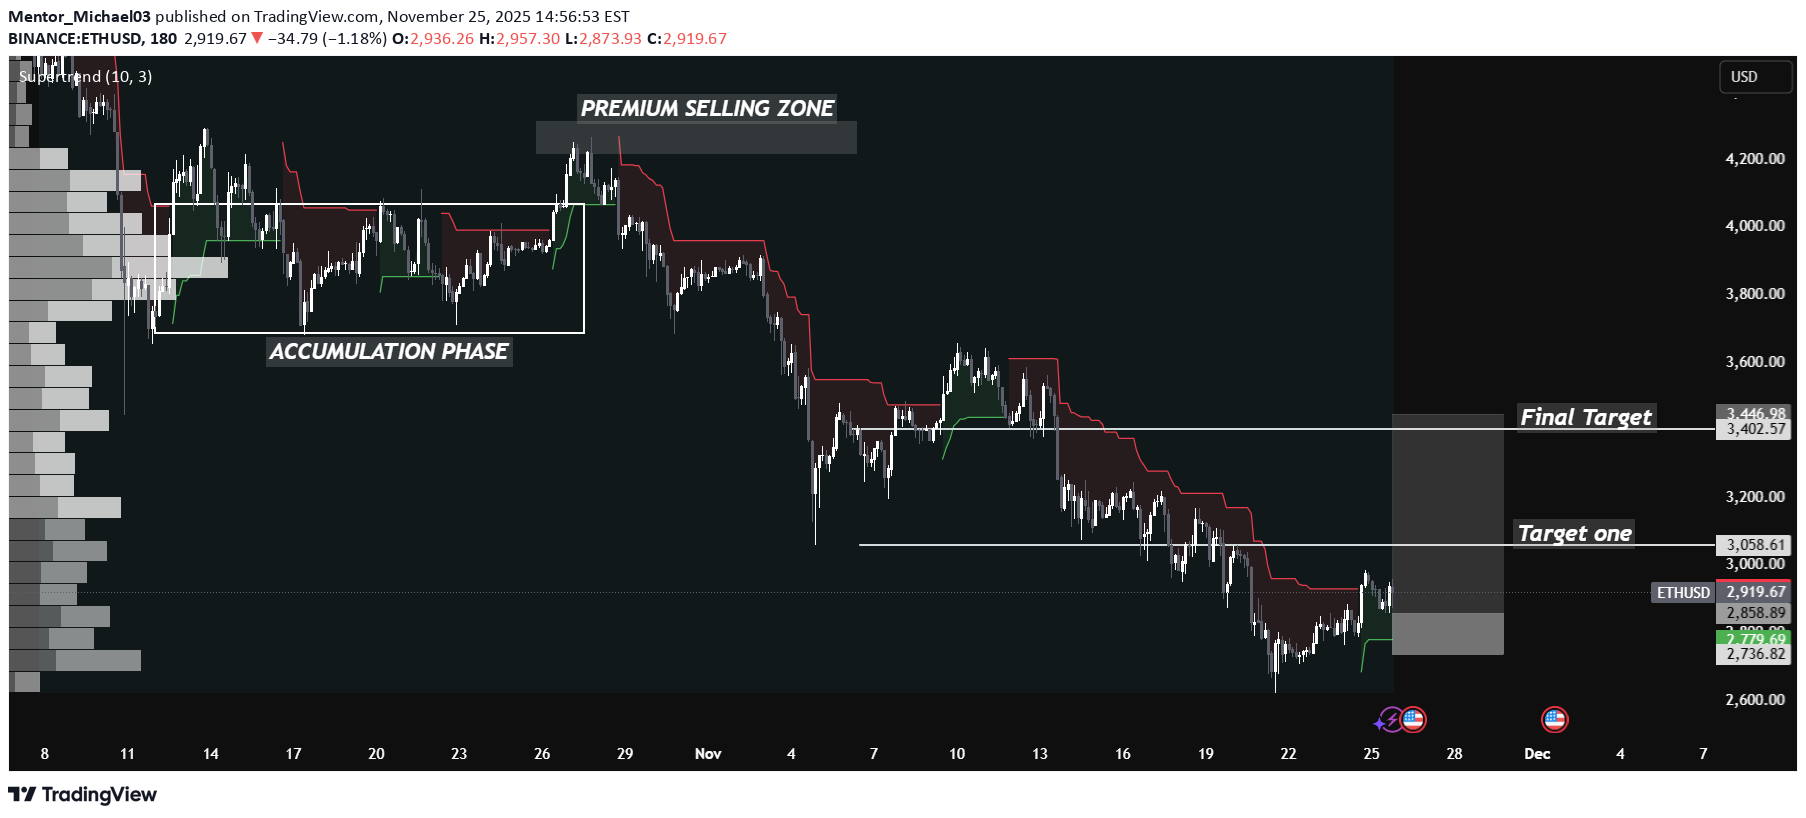
Trend Structure & Market Context Mid-term Trend: Ethereum had a significant drop through October-November, falling out of its previous bullish range. The decline found stability near $2,736–$2,779, forming a rectangle accumulation phase on your chart. Supertrend & Price Action: The supertrend indicator shifted from red to green, visualizing a subtle transition from selling to buying pressure. This shift aligns with a possible start of a new trend, but it should be confirmed by sustained higher highs and volume. 2. Volume Profile & Accumulation Volume Profile (VPVR): On your chart, the left-candles show a high density of trading volume in the accumulation zone. This suggests: Whales and large traders accumulated ETHUSD within this range. Volume support is present at $2,736–$2,779, providing a floor unless broken decisively. Distribution & Premium Selling Zone: Above $4,000, the chart suggests prior distribution, where smart money sold into retail interest. This phase ended, and price reversed sharply. 3. Targets & Key Levels Target One: $3,058 represents the first meaningful resistance. It aligns with historical pivots and a volume spike. Price action toward this level will test whether buyers can absorb further supply. Final Target Zone: $3,402–$3,446 is identified as the major upside zone, matching previous consolidations and the top of the volume distribution area. 4. Momentum & Oscillators Momentum Shift: Recent rebounds (+5% move reported 1–2 days ago) show that Ethereum is attracting buyers again, possibly driven by oversold conditions. Oscillators: TradingView’s comprehensive technical summary is neutral to slightly bullish, based on moving averages and oscillators—not strongly biased to either direction. 5. Macro & On-Chain Fundamentals On-chain Data: Activity shows a reduction in transfer volumes and fee revenue, indicating calmer conditions despite the price rebound. This suggests less speculative trading and more long-term positioning. Profitability: Many holders (short-term, especially) are underwater, suggesting capitulation may be nearing completion. Historically, when most are at a loss, a trend reversal is possible as strong hands accumulate. 6. What Could Invalidate the Bullish Deep Structure? A weekly close below $2,736 would break the accumulation zone, reactivating bears for another leg down. Watch for failure to make higher highs above $3,058. Conclusion (Analytical, Not a Signal) ETHUSD shows the following deep technical characteristics: A period of accumulation is visible, combined with a meaningful uptick in momentum and volume at recent lows. Resistance zones—particularly $3,058 and the $3,402–$3,446 region—will be critical in validating any upside continuation. Macro fundamentals are mixed, with both cautious sentiment and signs of underlying accumulation by strong holders. The supertrend shift and higher lows in recent sessions support an improving outlook, but the trend must be confirmed by decisive breaks of resistance and sustained volume. Bottom line: This is a technically constructive environment for Ethereum , showing signs of bottoming, emerging momentum, and structural support. However, until breakout levels are claimed and held, the rally remains tentative and should be assessed in context with broader crypto and macro market factors.Ethereum has successfully reached its first major target, marking a key milestone in the current bullish momentum. The achievement of this half target confirms the strength of recent upward price action and validates the ongoing breakout structure.
Mentor_Michael03
مسیر تاکتیکی بیت کوین: نبرد عرضه، تقاضا و شکست رنج قیمتی
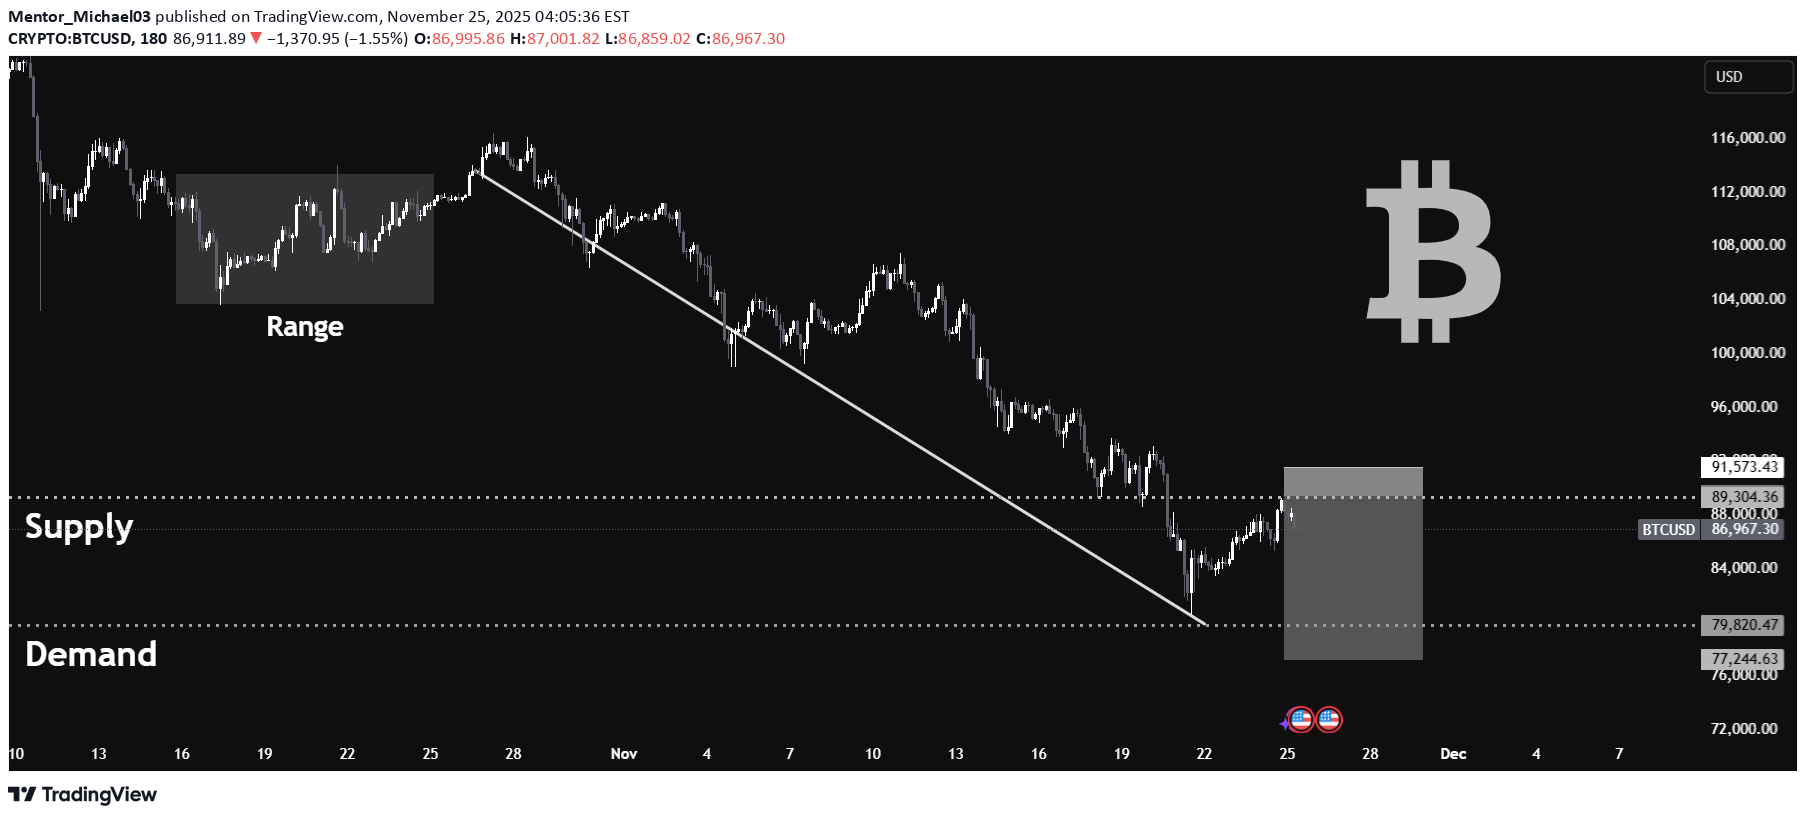
Technical Analysis Bitcoin is undergoing a marked structural transition, as evident on the recent chart. The price action has exited a sustained range, characterized by tight consolidation, and shifted into an impulsive downward leg. Range Breakdown: The period of stability (highlighted “Range”) gave way to new volatility. This transition initiated a pronounced downtrend, confirmed by repeated lower highs and a decisive break of the descending trendline. Supply & Demand Zones: Supply: The zone above $91,500 signals heavy overhead pressure, where sellers have repeatedly absorbed rallies. Demand: Layers around $77,250 to $79,800 represent robust buy-side defense—these are filled with unexecuted orders from earlier lows. Liquidity Structure: Price is oscillating between established liquidity pools. The retracement into the supply zone may invite aggressive responses from sellers, but a hold above demand could open recovery scenarios. Directional Bias: Currently, bearish control dominates as long as price remains below the broken trendline and fails to reclaim the supply overhead. Watch for reversal signals at demand that could ignite short-term bullish momentum. Key Levels: Resistance: $91,573; pivot for short squeeze or further rejection. Support: $77,244; anchor for bullish defense. Conclusion Bitcoin is at a strategic inflection: recovering buyers must defend demand zones to regain momentum, while sellers remain in control near supply. The next move will be defined by how price interacts with these critical liquidity areas—follow confirmation and watch for engineered volatility near the boundaries.tradingview.com/x/0bs6IsOE/Bitcoin BTC chart is active
Mentor_Michael03
راز معاملات هوشمند: چگونه حرکات پول بزرگ (SMC) در بازار را دنبال کنیم؟

Bugün sizlerle en güçlü işlem metodolojilerinden biri olan Smart Money Concept (SMC)’ten bahsedelim. 💡 Smart Money Concept, piyasadaki büyük oyuncuların — kurumların, bankaların ve hedge fonlarının — piyasayı nasıl hareket ettirdiğini anlamakla ilgilidir. Likiditeyi kontrol eden ve fiyatın gerçek yönünü belirleyen traderlar bunlardır. SMC’yi öğrenerek artık onlara karşı değil, onlarla birlikte işlem yapmaya başlarsınız. Odaklandığı başlıca noktalar şunlardır: 🔹 Piyasa Yapısı – Trend değişimlerini ve kilit dip/tepe noktalarını tanıyın. 🔹 Likidite Bölgeleri – Stop avı ve kurumsal hareketlerin gerçekleştiği alanları bulun. 🔹 Emir Blokları – Büyük paranın piyasaya girdiği bölgeleri tespit edin. 🔹 Adil Değer Boşlukları (FVG) – Fiyatın genelde tekrar uğradığı dengesizlikler. 🔹 Yapı Kırılması (BOS) – Trend devamı veya dönüş noktalarını yakalayın. 🔹 Prim & İskonto Bölgeleri – Kurumların alım-satım yapmayı tercih ettiği yerleri bilin. 🎯 Amaç: Piyasanın gerçek akışıyla uyumlu şekilde işlem yapmak — akıllı paranın adımlarını takip ederek, kalabalığın peşinden gitmemek.
Mentor_Michael03
زبان پول هوشمند در طلا: استراتژیهای طلایی برای ترید موفق (XAUUSD)
📈 Hello my friends, traders and investors! Let’s talk about one of the most powerful trading methodologies — Smart Money Concept (SMC). 💡 The Smart Money Concept is all about understanding how the big players — institutions, banks, and hedge funds — move the market. These are the traders who control liquidity and set the real direction of price. By learning SMC, you stop trading against them and start trading with them. Here’s what it focuses on: 🔹 Market Structure – Recognize trend shifts and key highs/lows. 🔹 Liquidity Zones – Find where stop hunts and institutional moves happen. 🔹 Order Blocks – Identify areas where big money entered the market. 🔹 Fair Value Gaps (FVGs) – Imbalances that price usually revisits. 🔹 Break of Structure (BOS) – Spot trend continuation or reversal points. 🔹 Premium & Discount Zones – Know where institutions prefer to buy or sell. 🎯 Goal: Trade in harmony with the market’s true flow — following the footsteps of the smart money, not the crowd.
Mentor_Michael03
بیت کوین در آستانه جهش بزرگ: سطح کلیدی ۱۱۰ هزار دلار کجاست؟
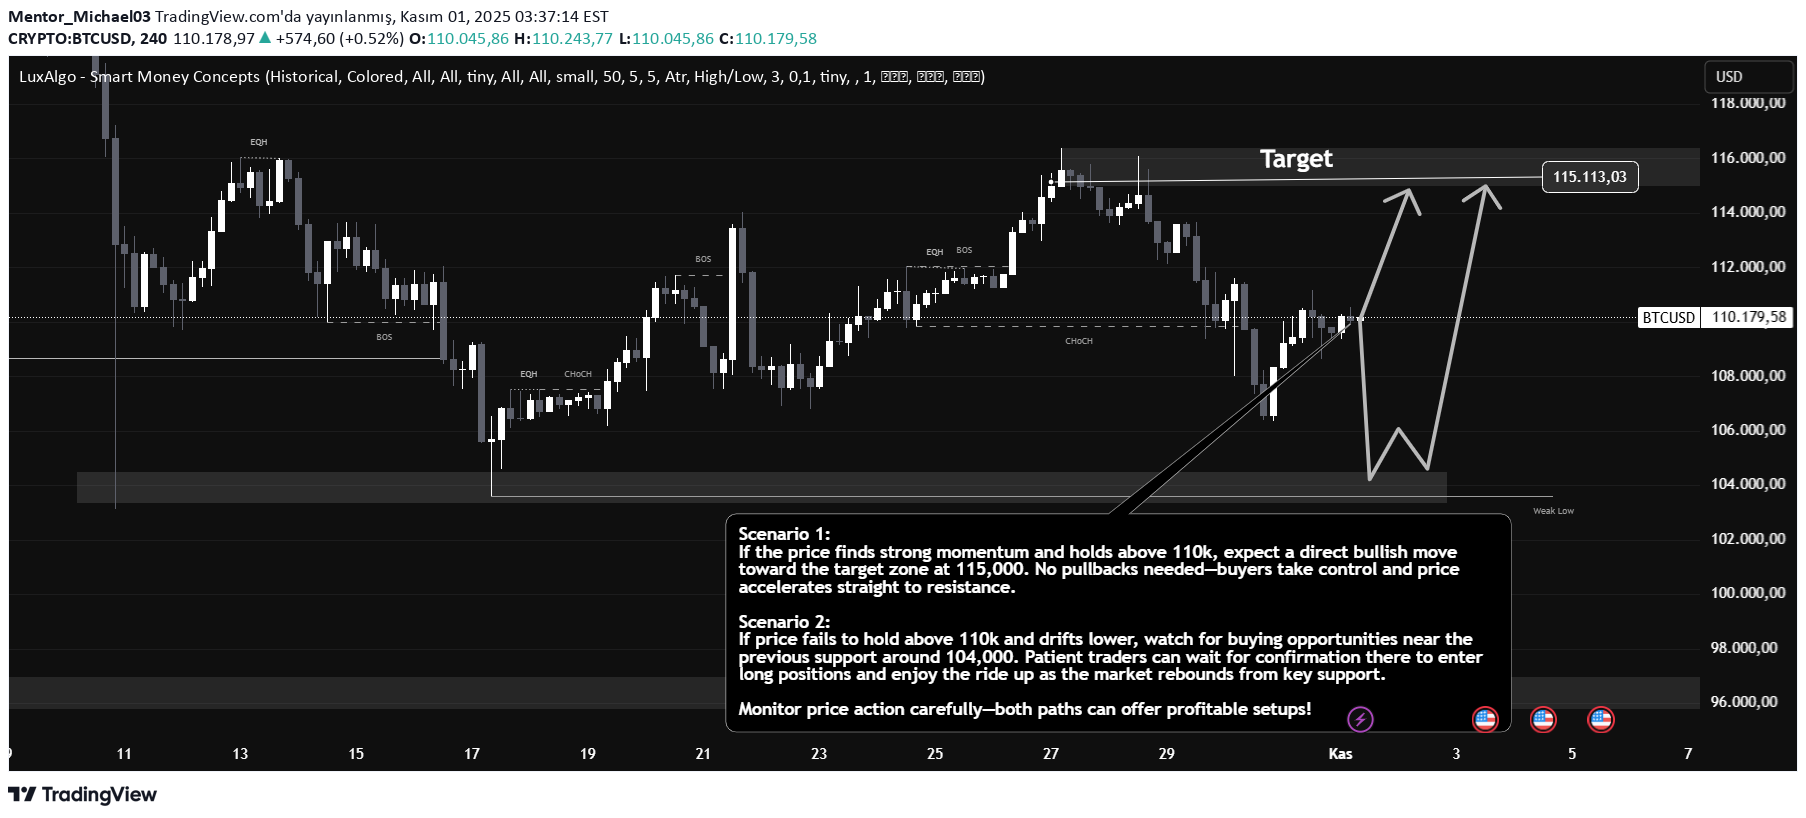
Fiyat, psikolojik ve teknik olarak kritik olan 110.000 civarında dalgalanıyor. Bu tür seviyelerde genellikle trend yönü değişir, kurumsal alıcı/satıcılar aktifleşir. Bir sonraki ana direnç ve ana hedef bölgesi 115.000, grafikte “Target” olarak gösterilmiş. Son dönemde bu bölgeden birkaç defa tepki alınmış, bu yüzden güçlü çıkışlarda kar realizasyonu beklenir. Alt tarafta ise, 104.000 civarındaki önceki destek bölgesi, geçmişte güçlü rallilere başlama noktası olmuştu. Akıllı para genellikle bu tarz seviyelerde birikim yapar ve herhangi bir düzeltmede yine alım iştahı yükselecektir. Senaryolar: Doğrudan Hedefe Yükseliş: Fiyat 110.000 üzerinde güçlü alıcı bulursa, bu bölgeden direkt olarak 115.000’e doğru hızlı bir hareket beklenir. Özellikle 111.000-112.000 bandı güçlü hacimle geçilirse, trend hızlanabilir ve yeni zirve test edilir. Dipten Alım Fırsatı: Fiyat 110.000 üzerinde tutunamaz ve aşağıya sarkarsa, önceki güçlü destek olan 104.000 bölgesinden yeni bir long pozisyon için fırsatlar izlenmeli. Bu bölgede alıcılar açığa çıkarsa, alım teyidiyle büyük bir yukarı hareket için pozisyon alınabilir. Ticaret Stratejisi: Agresif alıcılar, kırılım ve hacim artışıyla 110.000’in üstünden momentumla uzun pozisyon açmalı — hedef 115.000. Sabırlı yatırımcılar, fiyatın 104.000’e çekilmesini bekleyip alım teyidiyle daha düşük riskle uzun pozisyon açabilir. Sonuç: BTCUSD önemli bir harekete hazırlanıyor. Her iki senaryoda da, sabırlı ve disiplinli olanlar için ciddi kazanç fırsatları masada!
Mentor_Michael03
بیت کوین در تقاطع حساس: دو سناریوی اصلی برای حرکت بعدی BTC/USD در محدوده 110 هزار دلار
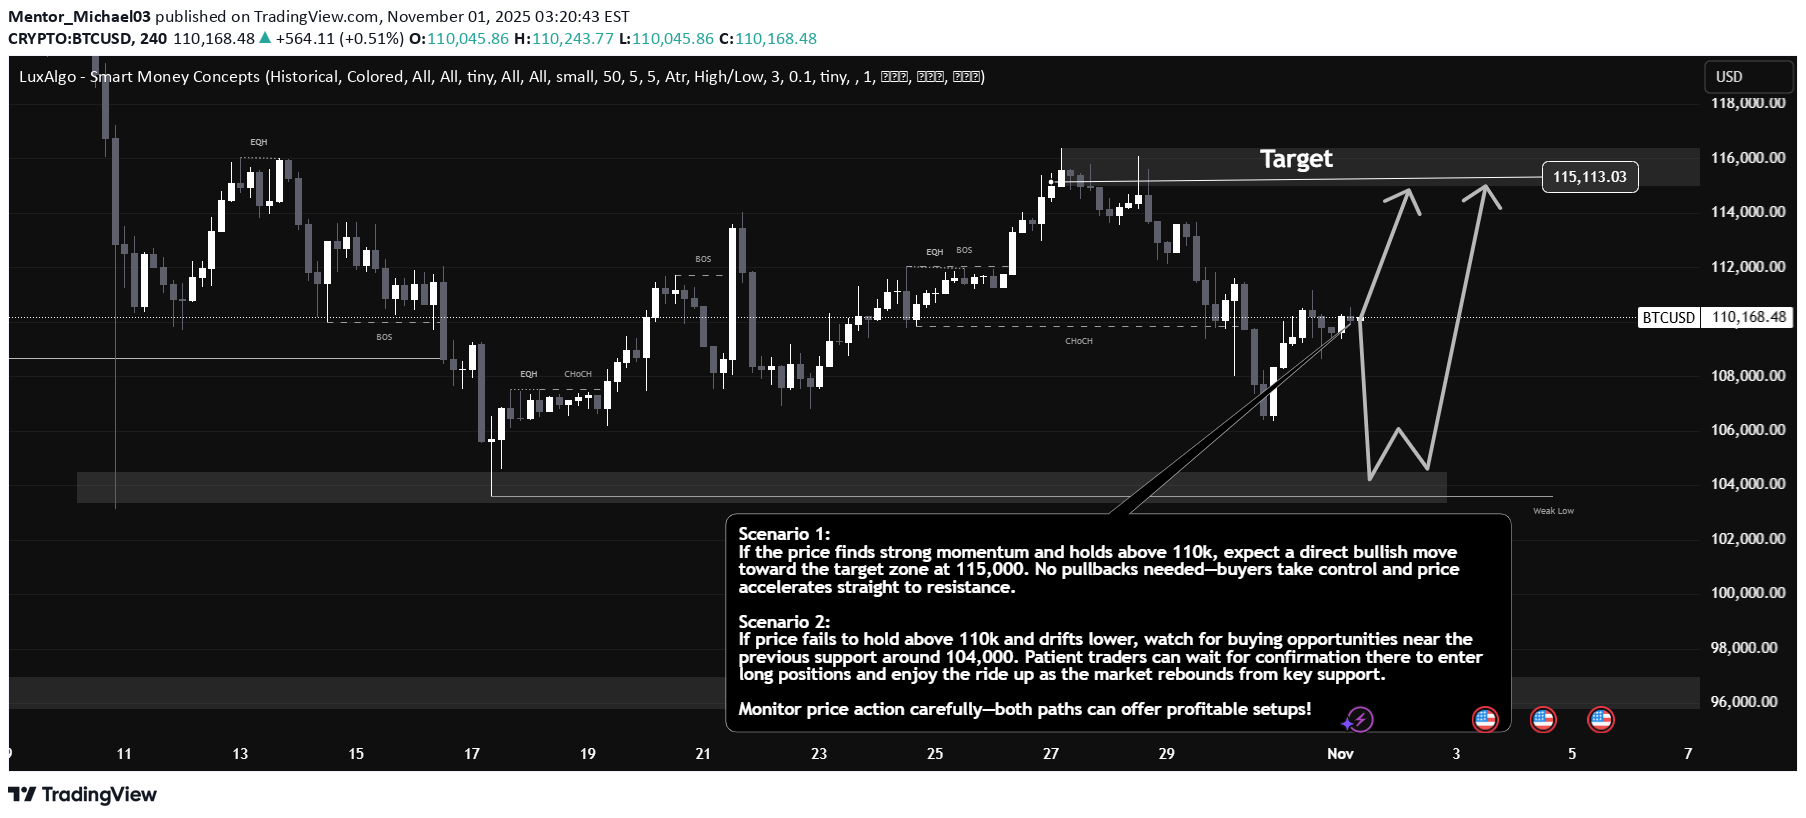
Bitcoin is currently consolidating around the pivotal 110,000 level. Price action and smart money concepts presented in this chart highlight a critical decision point for traders—here’s what the structure tells us: Key Scenarios: 1. Direct Rally to Target If bulls hold 110k and momentum strengthens, expect a clean breakout toward the 115,000 resistance/target zone. Price has shown ability to rally from major support zones, and if buyers manage to absorb supply here, this leg can accelerate quickly as shorts get squeezed and trend-followers pile in. Volume confirmation and strong bullish candle close above 110k will be main signals for entry, with next stop at 115k. 2. Support Bounce Setup If 110k fails and price dips, attention shifts to the well-established support near 104,000. This lower demand zone has triggered bullish reversals before—look for sharp volume spikes or reversal candlestick patterns. When confirmation appears at support, traders should be ready to go long and ride momentum back to the target at 115k. Technical Strengths: Multiple break-of-structure (BOS) and change-of-character (CHOCH) labels mark recent turning points, showing where trend strength can shift rapidly. Smart money demand at 104k is well defined, giving asymmetric risk/reward for buyers. Price has stayed above weak lows and formed higher lows since last major dip—trend bias remains bullish unless those supports are broken. Execution Advice: Monitor 110k for breakout and volume surge; if rejected, set bids at 104k and wait for confirmation. Both strategies offer strong upside potential—the key is trading confirmation, not prediction. This dual-scenario map is exactly what institutional and active traders use to preserve profits and target breakouts with precision.
Mentor_Michael03
نقشه راه طلا (XAUUSD): سطوح حیاتی اسمارت مانی و فرصتهای خرید و فروش دقیق
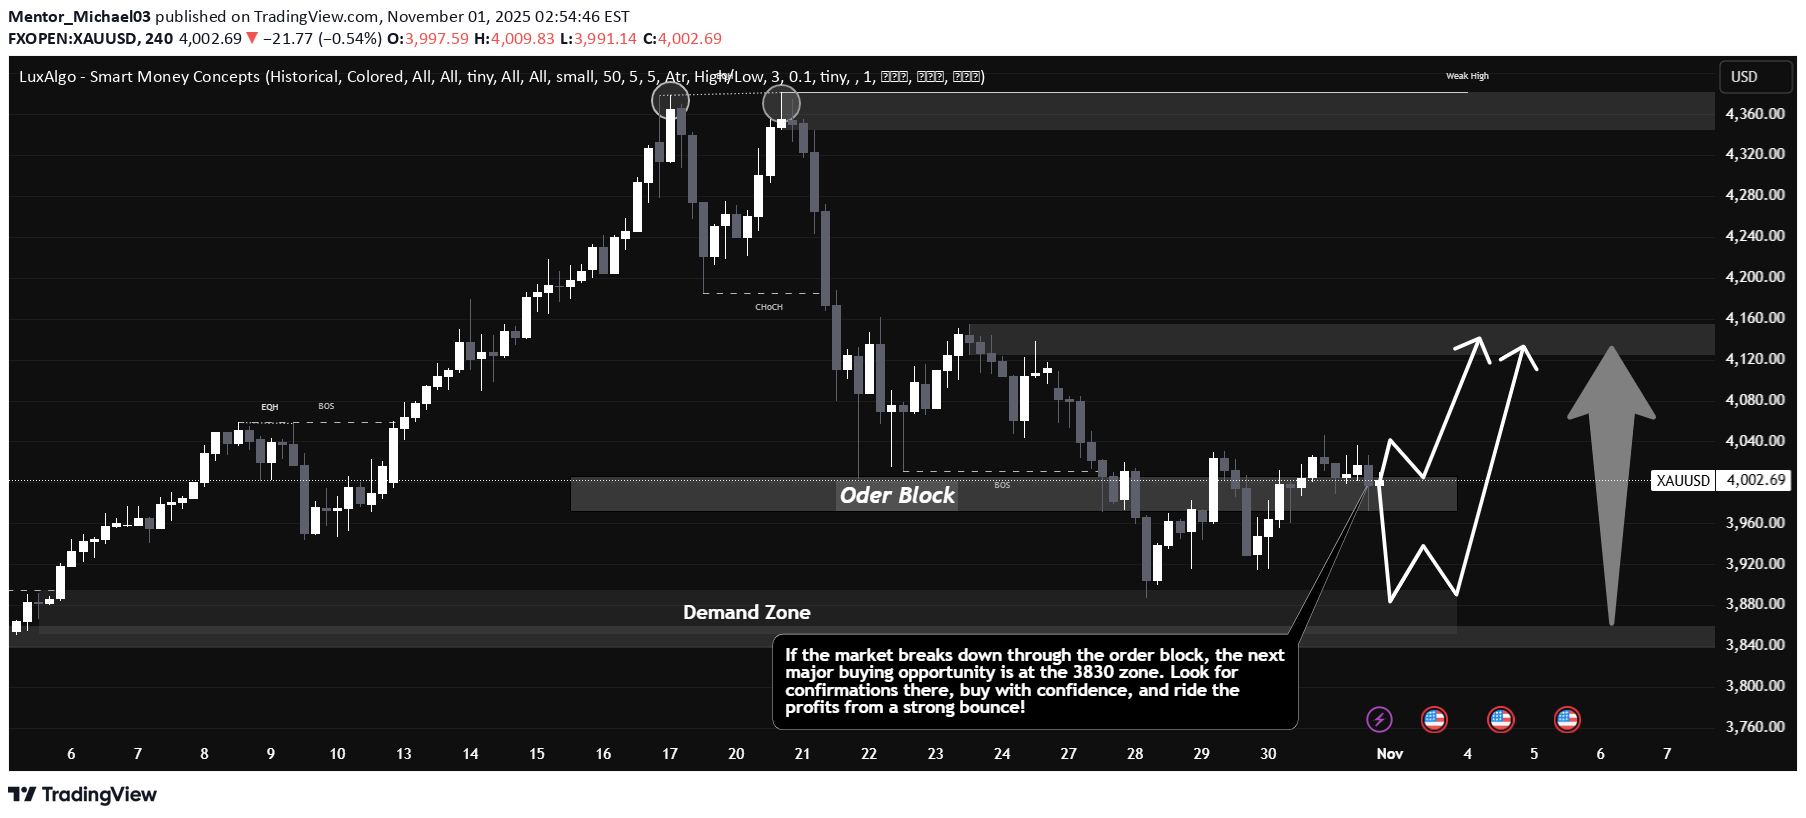
The current chart highlights critical smart money concepts and the interplay between buyers and sellers at strategic price ranges: Order Block & Immediate Price Action: Price sits at ~$4,002 and is currently respecting the order block (approx. $3,990–$4,040). This level historically attracts powerful institutional flows, evident from prior volatile reactions. If bulls can maintain control above the order block, we expect aggressive moves toward the local supply zone ($4,120–$4,160). Price targets in this area should be monitored for reversal candlestick formations and profit-taking by larger accounts. A clean break here could trigger a rally, as indicated by the arrow projection. Demand Zone — Tactical Buy Levels: Should price fail to sustain above the order block and decisively break down, the next compelling buying zone emerges at $3,830. This “demand zone” is well-defined and likely to activate a fresh round of buyer interest and mean-reversion trading setups. Seasoned traders will look for confirmation—such as clear volume spikes or bullish structures—before positioning long at $3,830. The risk-reward improves substantially at this spot, given historical rebounds. Trend Structure & Market Sentiment: Momentum remains neutral-to-bullish as price oscillates between well-established institutional footprints. Positive price reaction above $4,000 can quickly shift sentiment upward, while a breakdown could flush weak hands and present asymmetric buying opportunities lower. Watch for reaction at both key zones to assess where smart money is accumulating or distributing positions. Summary & Execution Plan: The path forward depends on the order block’s defense. A break above triggers momentum to the supply zone; a breakdown highlights $3,830 as a pro buying location. Trade the confirmations and let market structure dictate position management. This approach blends institutional-level mapping with strict price action logic—exactly what pros use to manage risk and capture optimal returns.
Mentor_Michael03
طلا در آستانه انفجار: نقشه راه معاملهگران بزرگ و اهداف هیجانانگیز!
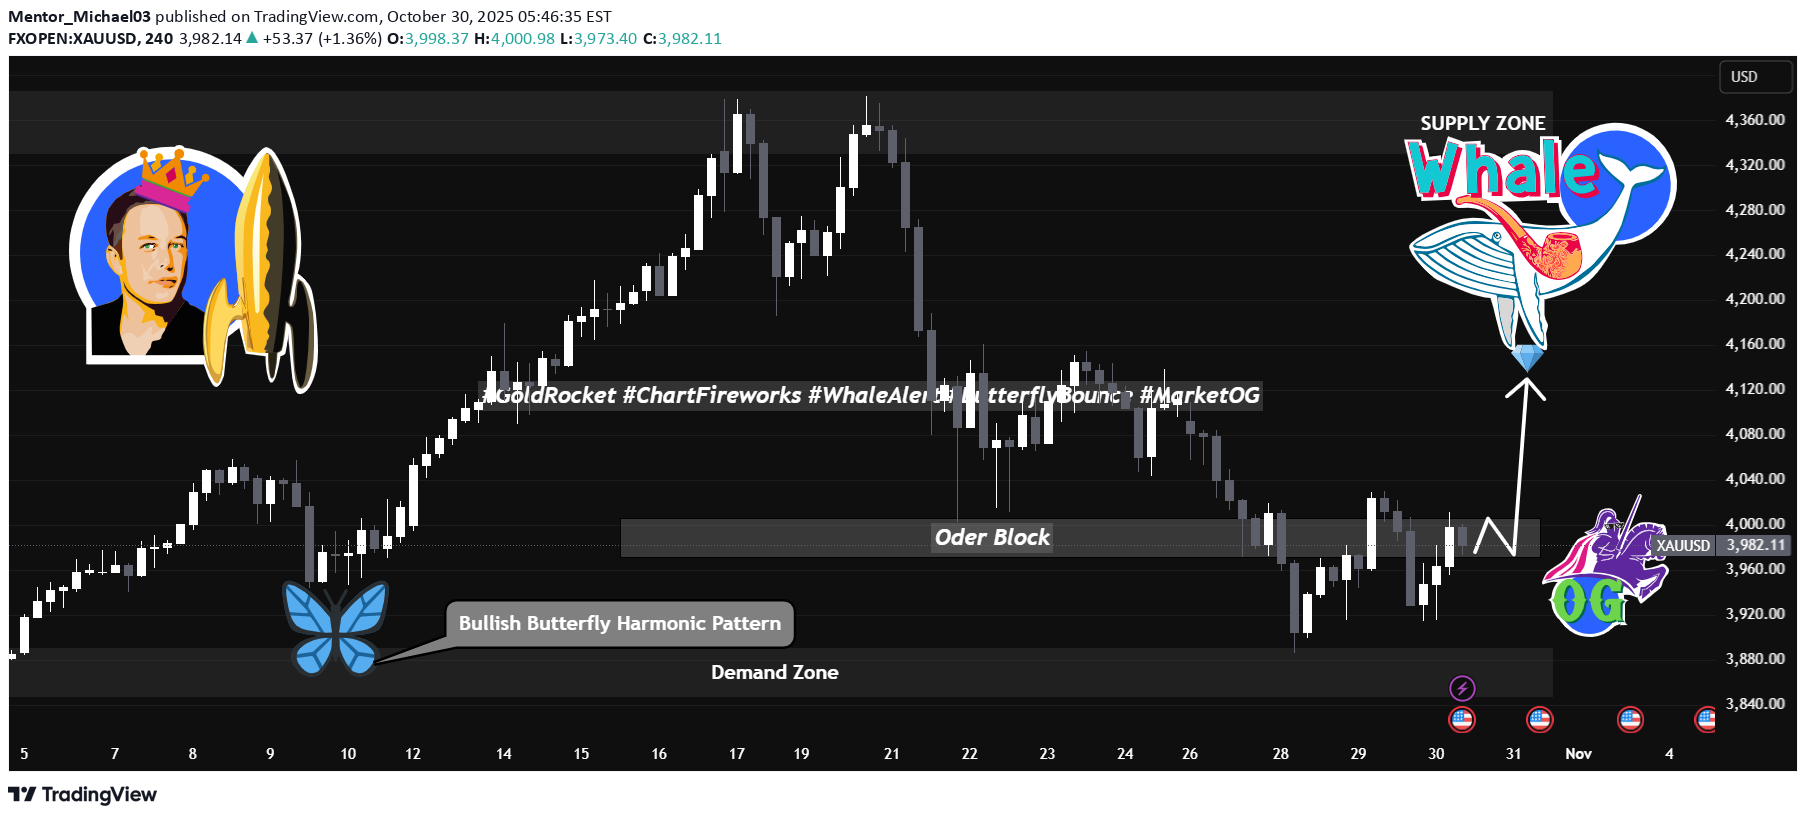
As a trader reviewing this chart, several clues stand out. Price is currently consolidating near 3,981 with visible signs of recent volatility and two important zones: a bullish butterfly harmonic pattern in the lower demand area, and a highlighted order block in the mid-range. Bullish Butterfly Harmonic Pattern: This classic reversal signal appears right in the Demand Zone (3,880–3,950), telling me smart money might be prepping for a push upward. I see this pattern as possible fuel for an impulsive bounce—if buyers defend it, expect a rally! Order Block: Around 4,000, price interacts with a historical level where institutions previously stepped in. For my trading, I monitor order blocks closely—they show where major players have unfinished business. If price can reclaim and hold above this zone, bullish pressure should intensify. Supply Zone: Up at 4,320+, this is a key target. It’s visually marked with a “Whale”—implying big sellers are waiting to take profit up there. Any rally into this region needs watching for sharp reactions or reversal setups. OG Zone: Marked near current price, suggesting a battle between fresh buyers and holders of the previous downside move. Trade Plan: If I get a clear bullish signal in the 3,900–3,950 region, I’d look to go long, with first targets at the order block (4,000–4,040). If price slices through that, then the next stop is the whale supply (4,320+). My stops would go just below the butterfly pattern, minimizing downside. Risk Notes: A failure to hold the demand zone likely signals bears are regaining control—if price closes below 3,880, I step aside and reassess. Summary: Watching for a bullish setup from the harmonic and demand zone for a swing up to supply. If momentum builds and order block flips support, gold could show real fireworks.
Mentor_Michael03
تحلیل زنده طلا: استراتژی معاملاتی لحظهای و کشف نقاط کلیدی ورود و خروج
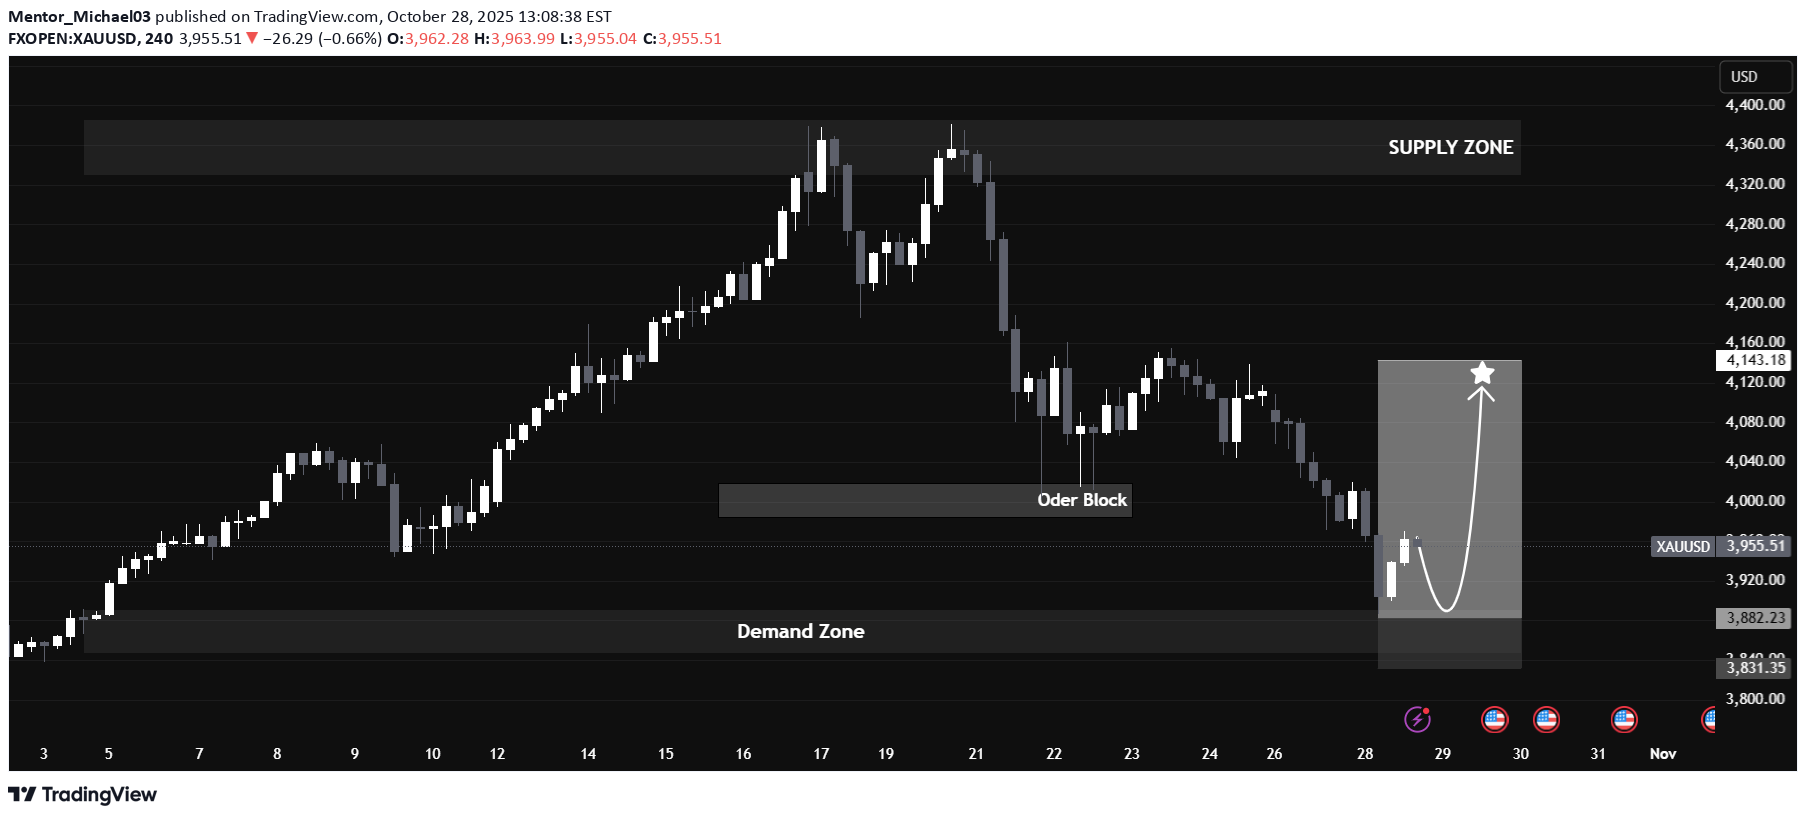
Current Price Action: Gold is trading around $3,958, with recent volatility creating a sharp dip from previous highs. The price is currently testing levels near the Demand Zone, which has previously acted as a strong buying area. Key Zones Highlighted: Supply Zone (~$4,330–$4,400): This area marks the top where significant selling pressure has emerged, reversing major rallies. Order Block (~$4,000): Noticeable buying volume previously occurred, which could again provide short-term support/resistance. Demand Zone (~$3,830–$3,880): Historically, buyers stepped in around this level, supporting price and igniting upward moves. Technical Overview: Trend: After a period of consistent gains, gold experienced a correction. The current move shows an attempted recovery with a possible bullish reversal signaled on the chart. Projected Move: The annotated path suggests a bounce off the demand zone, targeting the $4,150 region if buyers regain momentum. Watch for a confirmation candle to validate this move. Risk Factors: If the recovery fails, a break below the demand zone could trigger further downside toward $3,831. Market Sentiment & Macro Observations: Strong volatility has introduced uncertainty. US yields are rising, which can strengthen USD and pressure gold. The supply zone will be a crucial test for sustained bullish moves. Trading Plan Ideas: Bullish: Enter long on a clear bullish reversal above $3,950, with targets at $4,080 and $4,150. Initial stops below $3,880. Bearish: If gold breaks below $3,880, watch for momentum toward $3,831 or lower. Conclusion: Gold remains at a pivotal level. The demand zone is key for bulls hoping to see a rebound, but close monitoring is needed due to ongoing volatility and macro headwinds. Confirmation signals are essential before taking strong directional positions.
Mentor_Michael03
طلای داغ: آیا XAUUSD به مرز 4500 نزدیک میشود؟ (تحلیل فنی و بنیادی)
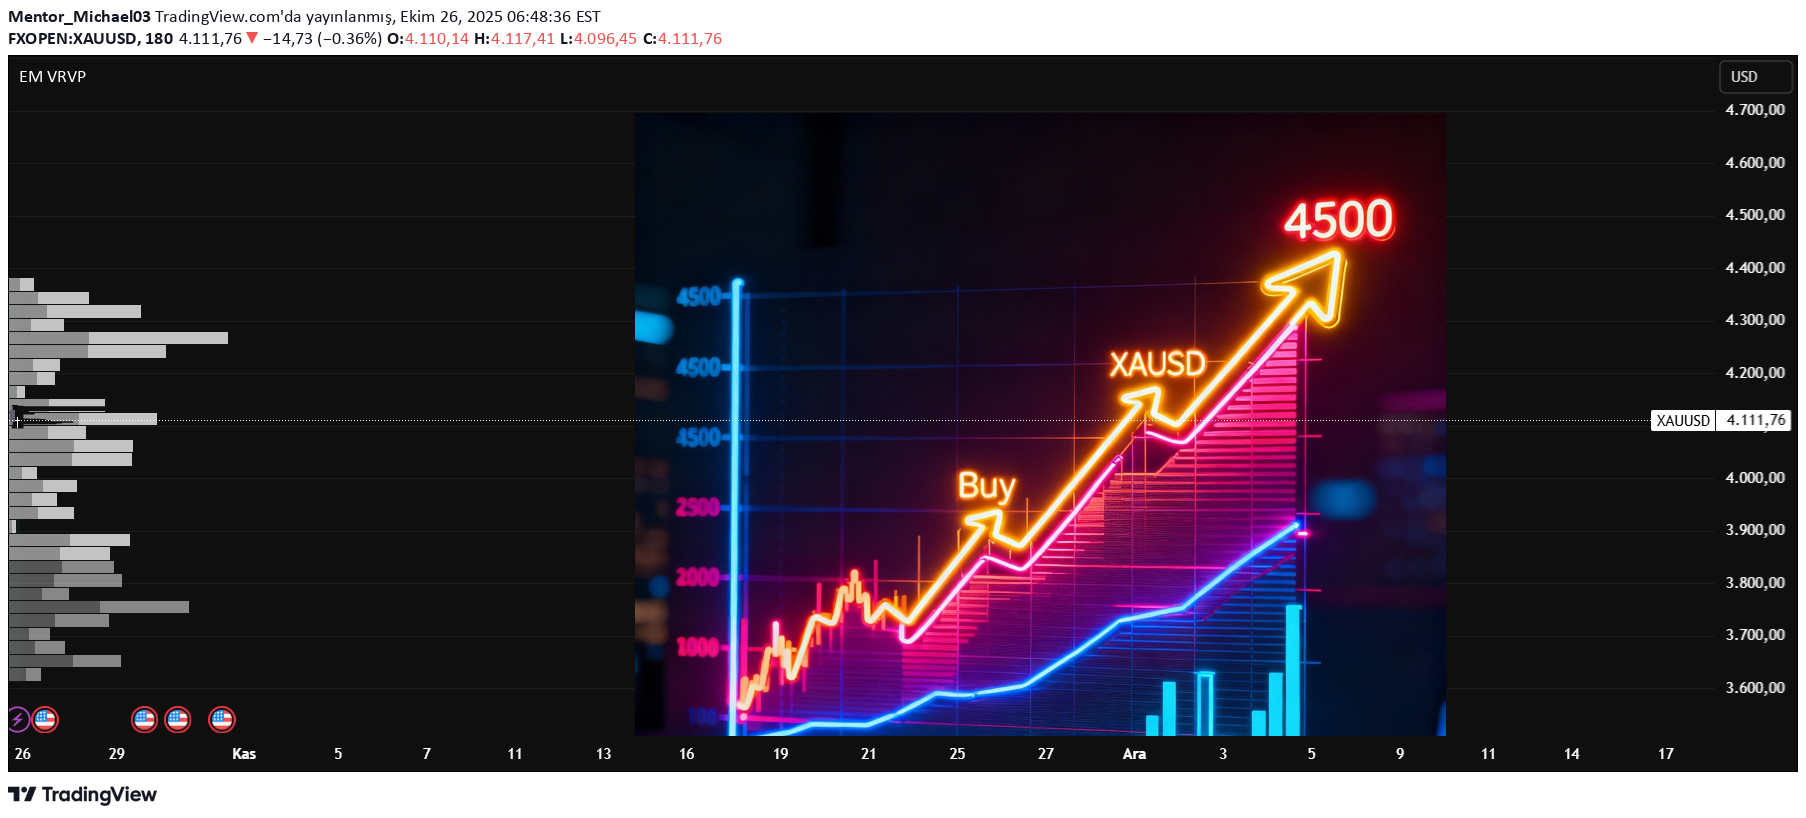
Fiyat, kritik dirençleri kırarak yukarı yönlü trendini sürdürüyor. Hareketli ortalamalar ve göstergeler, alış baskısının yoğunluğunu doğruluyor. Güçlü işlem hacmi ve mum formasyonları, piyasadaki boğaların kontrolü ele aldığını gösteriyor. 4200 seviyesi kısa vadede önemli destek rolü üstlenirken, 4450'nin aşılması agresif yükselişi tetikleyebilir. Temel Göstergeler: Küresel enflasyon baskısı ve merkez bankalarının altın talepleri artarak devam ediyor. ABD Doları’ndaki zayıflama, altını yatırımcılar için cazip kılıyor. Jeopolitik riskler ve ekonomik belirsizlikler, güvenli liman talebini güçlendiriyor. Strateji ve Risk Yönetimi: 4200 ve altına yakın geri çekilmelerde alış fırsatları değerlendirilebilir. 4450 direncinin üzerinde kalıcı kapanışlar, 4500 ve üzerine doğru hızlı hareketi beraberinde getirebilir. Stop-loss seviyeleri 4150’nin hemen altına yerleştirilmeli. Ekonomik veri akışı ve Fed açıklamaları yakından izlenmelidir. Sonuç: Teknik ve temel güçlü faktörlerin etkisiyle, altında 4500 seviyesi kısa vadede ulaşılabilir bir hedef olarak öne çıkıyor. Yatırımcılar fırsatları dikkatli bir şekilde değerlendirmeli ve risklerini doğru yönetmelidir.
Disclaimer
Any content and materials included in Sahmeto's website and official communication channels are a compilation of personal opinions and analyses and are not binding. They do not constitute any recommendation for buying, selling, entering or exiting the stock market and cryptocurrency market. Also, all news and analyses included in the website and channels are merely republished information from official and unofficial domestic and foreign sources, and it is obvious that users of the said content are responsible for following up and ensuring the authenticity and accuracy of the materials. Therefore, while disclaiming responsibility, it is declared that the responsibility for any decision-making, action, and potential profit and loss in the capital market and cryptocurrency market lies with the trader.