Technical analysis by EA_GOLD_MAN_COPY_TRADE about Symbol BTC on 7/19/2025

EA_GOLD_MAN_COPY_TRADE
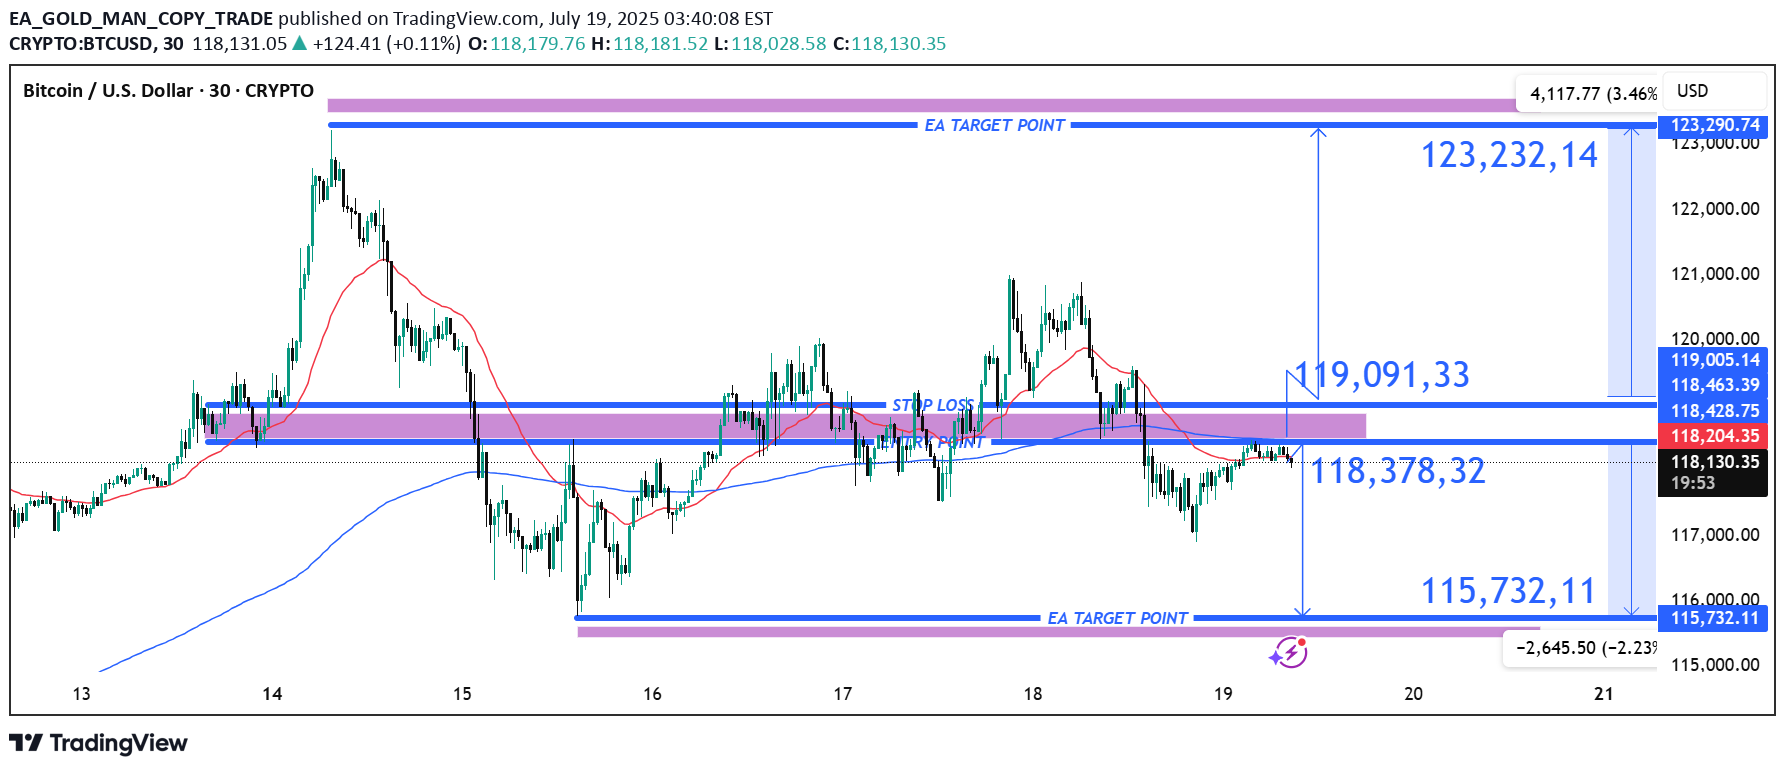
BTC/USD 30-Minute Chart Analysis (As of July 19, 2025) 🔍 Overview: The chart shows a structured trading setup using technical zones, EMA lines, and a clear risk-reward strategy. The current price sits at $118,076.56, with strong confluence zones and directional targets marked. 📊 Key Zones & Levels: Entry Zone (Marked in Purple Box): ~$118,378.32 This zone represents a breakout/retest structure, showing past support and resistance flips. Stop Loss Level: ~$119,091.33 Placed just above a local resistance to protect from fakeouts and bullish reversals. Target 1 (Bearish): ~$115,732.11 Primary bearish target, assuming price fails to reclaim the mid-range and breaks below. Target 2 (Bullish): ~$123,232.14 / $123,290.74 If price reclaims above the stop-loss region and gains momentum, this is the upside target. 📉 Current Trend Bias: The price is below the 50 EMA (red) and testing the 200 EMA (blue) from underneath — this usually indicates short-term bearish pressure. Multiple rejections from the $118,428–$118,462 resistance band strengthen the bearish outlook unless this zone is broken decisively. 📈 Risk-Reward Setup: Risk (Stop Loss - Entry): ~$713 Reward (Entry - Bearish Target): ~$2,646 Reward/Risk Ratio: ≈ 3.71 – very favorable for short trades. 📌 Conclusion: As long as BTC stays below the $118,462–$119,091 resistance, the bias remains bearish, targeting $115,732. A break above $119,091 invalidates the short setup and opens the door to a rally toward $123,290.
