Technical analysis by SiDec about Symbol BTC: Sell recommendation (7/16/2025)

SiDec
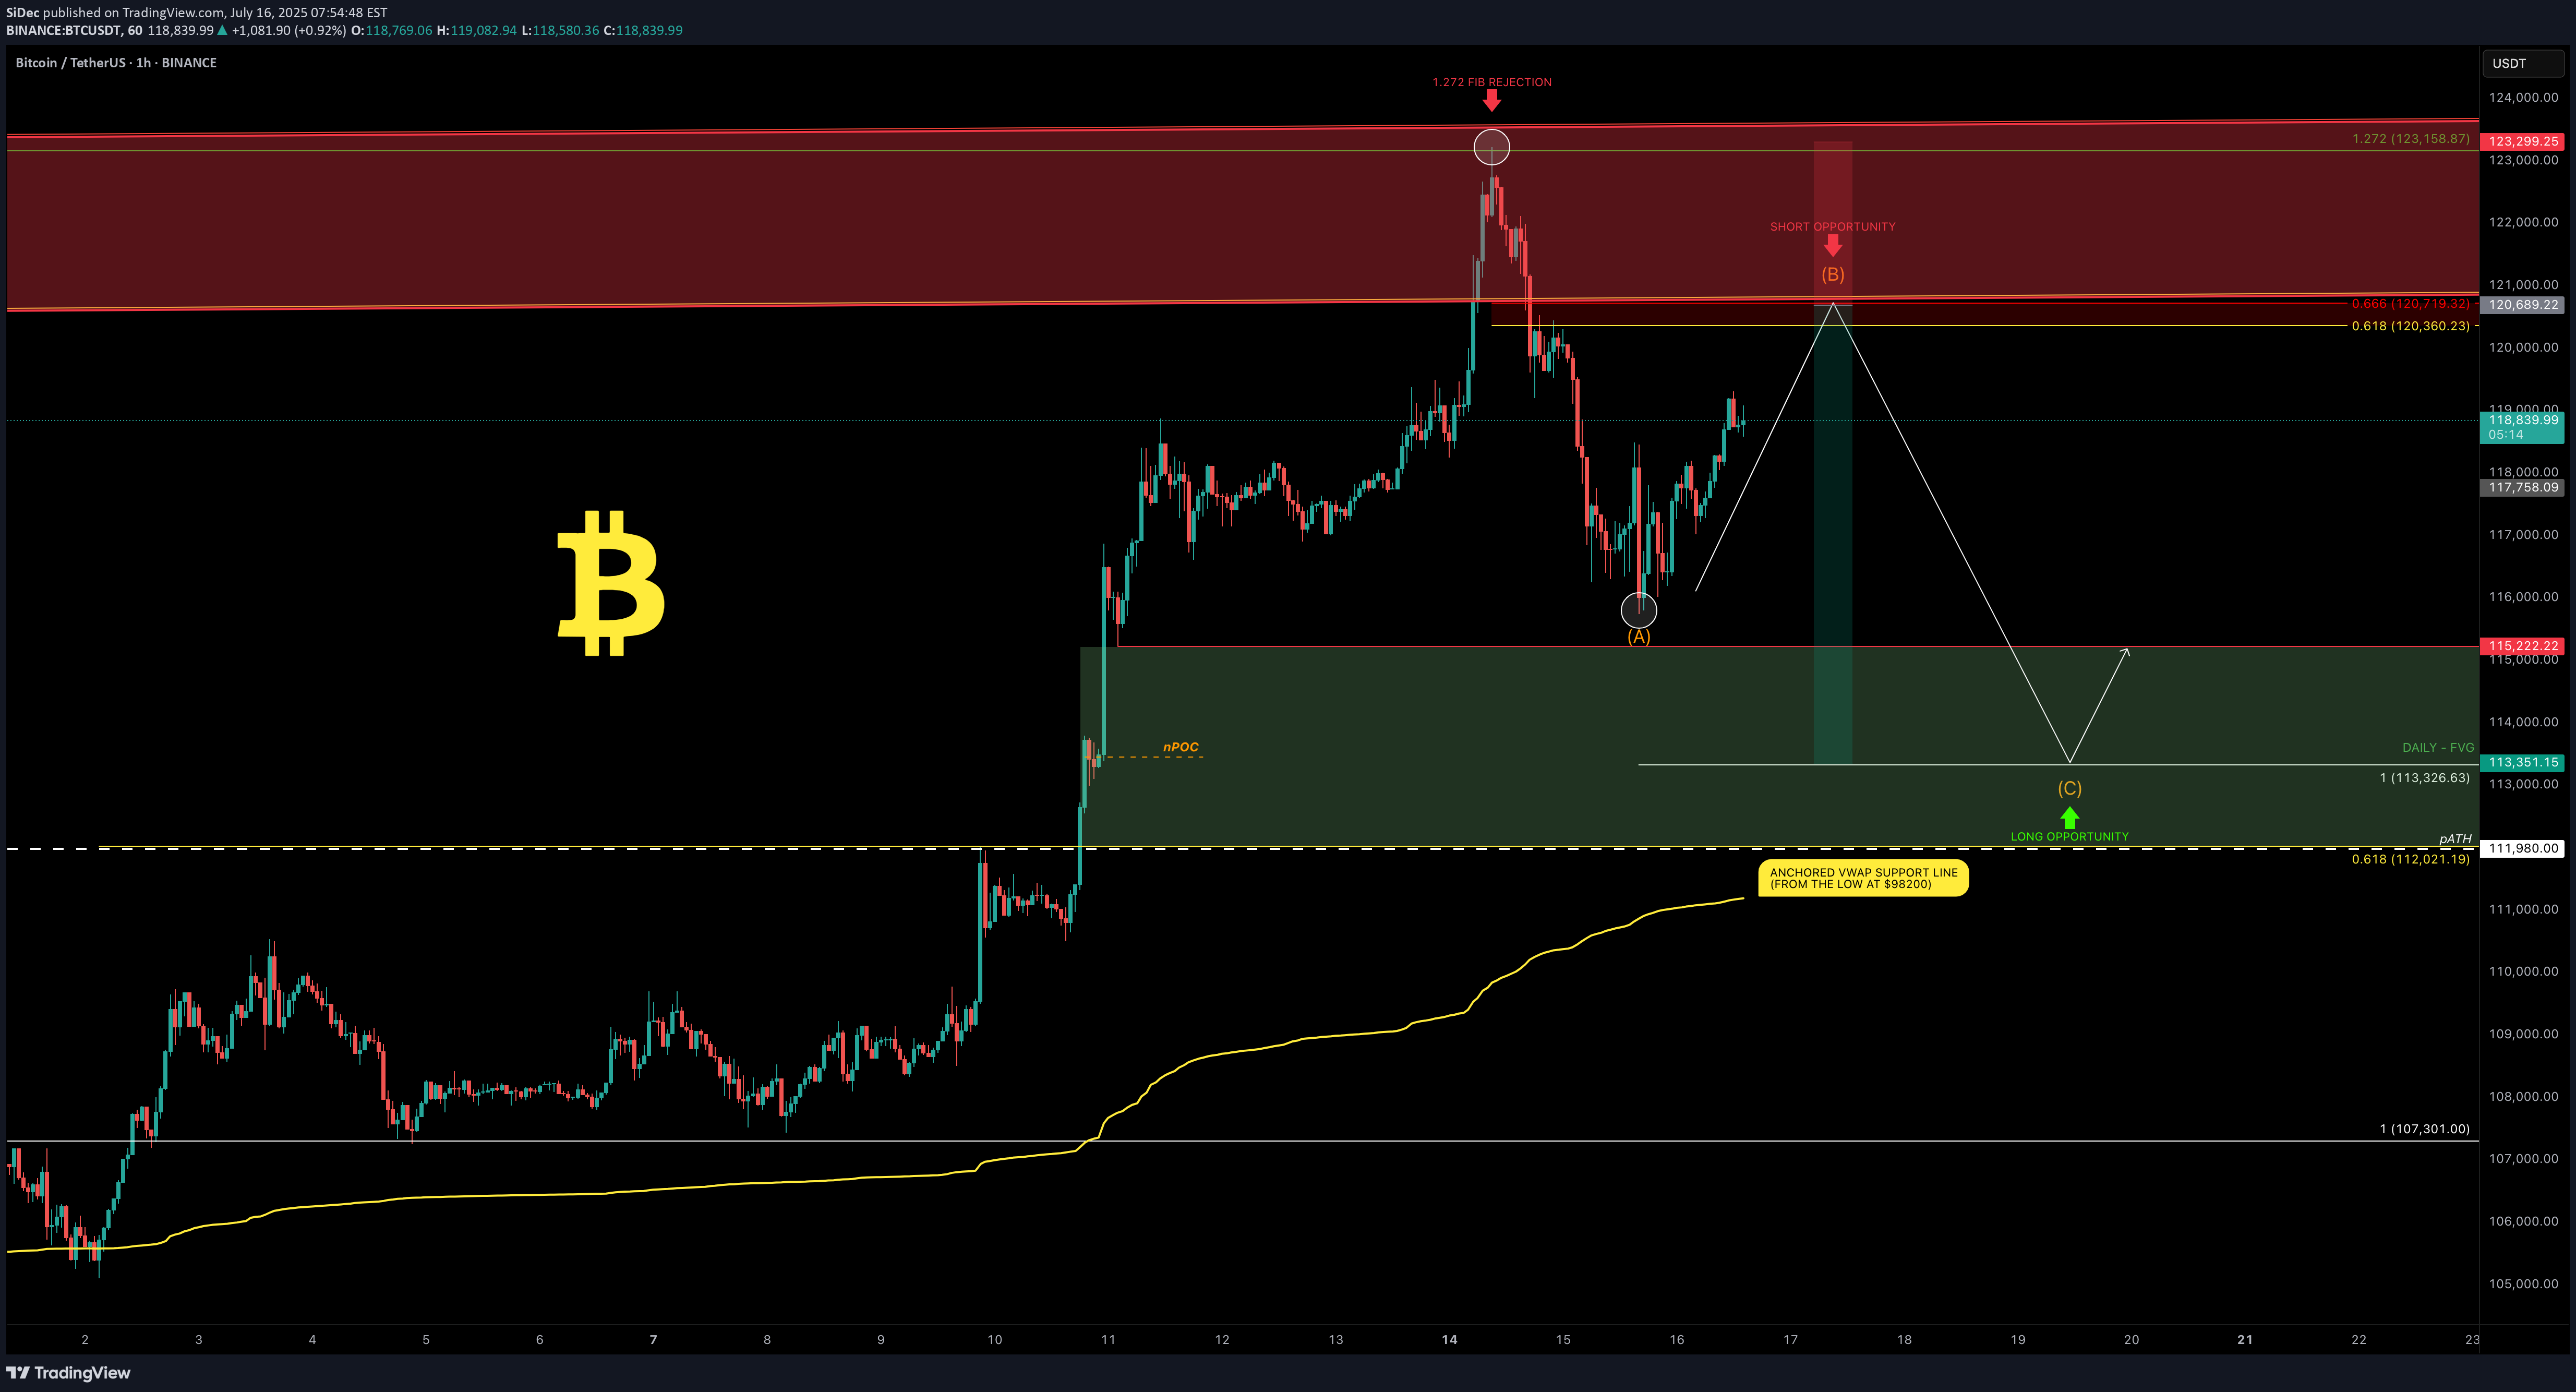
Bitcoin had an incredible run, breaking the old all-time high ($111,980) with strong bullish momentum and setting a fresh ATH at $123,218 (Binance). We just witnessed the first major corrective move of ~6% and a decent bounce so far — but the big question is: What’s next? Will Bitcoin break higher over the summer or form a trading range here? Let’s dive into the technicals. 🧩 Higher Timeframe Structure May–June Range: BTC was stuck between $110K–$100K, forming an ABC corrective pattern. Using trend-based Fib extension (TBFE) from A–B–C: ✅ C wave completed at $98,922 (1.0 TBFE) ✅ Upside target hit at $122,137 (-1 TBFE) Full Bull Market TBFE: ➡️ 1.0 → $107,301 → previously rejected ➡️ 1.272 → $123,158 → recent rejection zone Pitchfork (log scale): ➡️ Tapped the upper resistance edge before rejecting. Previous Bear Market Fib Extension: ➡️ 2.0 extension at $122,524 hit. 2018–2022 Cycle TBFE: ➡️ 1.618 at $122,011 tapped. Macro Fibonacci Channel: ➡️ Connecting 2018 low ($3,782), 2021 ATH ($69K), 2022 low ($15,476) → 1.618–1.666 resistance band: $121K–$123.5K. ✅ Conclusion: Multiple fib confluences mark the $122K–$123K zone as critical resistance. Daily Timeframe ➡️ FVG / Imbalance: Big daily Fair Value Gap between the prior ATH and $115,222 swing low. BTC broke the prior ATH (pATH) without retest → a pullback to this zone is likely. Lower Timeframe / Short-Term Outlook We likely saw a completed 5-wave impulse up → now correcting. The -6% move was probably wave A, current bounce = wave B, next leg = wave C. ➡ Wave B short zone: $120K–$121K ➡ Wave C target (1.0 TBFE projection): ~$113,326 ➡ Confluence at mid-FVG + nPOC Trade Setups 🔴 Short Setup: Entry: $120,300–$121,000 Stop: Above current ATH (~$123,300) Target: $113,500 R:R ≈ 1:2.3 🟢 Long Setup: Entry: Between Prior ATH and $113,000 Stop: Below anchored VWAP (~$110,500) Target: Higher, depending on bounce confirmation. 🧠 Educational Insight: Why Fibs Matter at Market Extremes When markets push into new all-time highs, most classic support/resistance levels disappear — there’s simply no historical price action to lean on. That’s where Fibonacci extensions, channels, and projections become powerful tools. Here’s why: ➡ Fibonacci extensions (like the 1.272, 1.618, 2.0) help estimate where trend exhaustion or profit-taking zones may appear. They are based on the psychology of crowd behavior, as traders anchor expectations to proportional moves from previous swings. ➡ Trend-Based Fib Extensions (TBFE) project potential reversal or continuation zones using not just price levels, but also the symmetry of prior wave moves. ➡ Fibonacci channels align trend angles across multiple market cycles, giving macro context — like how the 2018 low, 2021 ATH, and 2022 low project the current 1.618–1.666 resistance zone. In short: When you don’t have left-hand price history, you lean on right-hand geometry. That’s why the $122K–123K zone wasn’t just random — it’s a convergence of multiple fib levels, cycle projections, and technical structures across timeframes. ⚡ Final Thoughts Bitcoin faces major resistance around $122K–$123K backed by multiple fib and structural levels. A retest of the prior ATH zone (~$112K–$113K) looks probable before the next big directional move. Watch lower timeframe structure for signs of completion in this corrective phase. _________________________________ 💬 If you found this helpful, drop a like and comment! Want breakdowns of other charts? Leave your requests below.
