Technical analysis by ScottMelker about Symbol BTC on 7/16/2025

ScottMelker
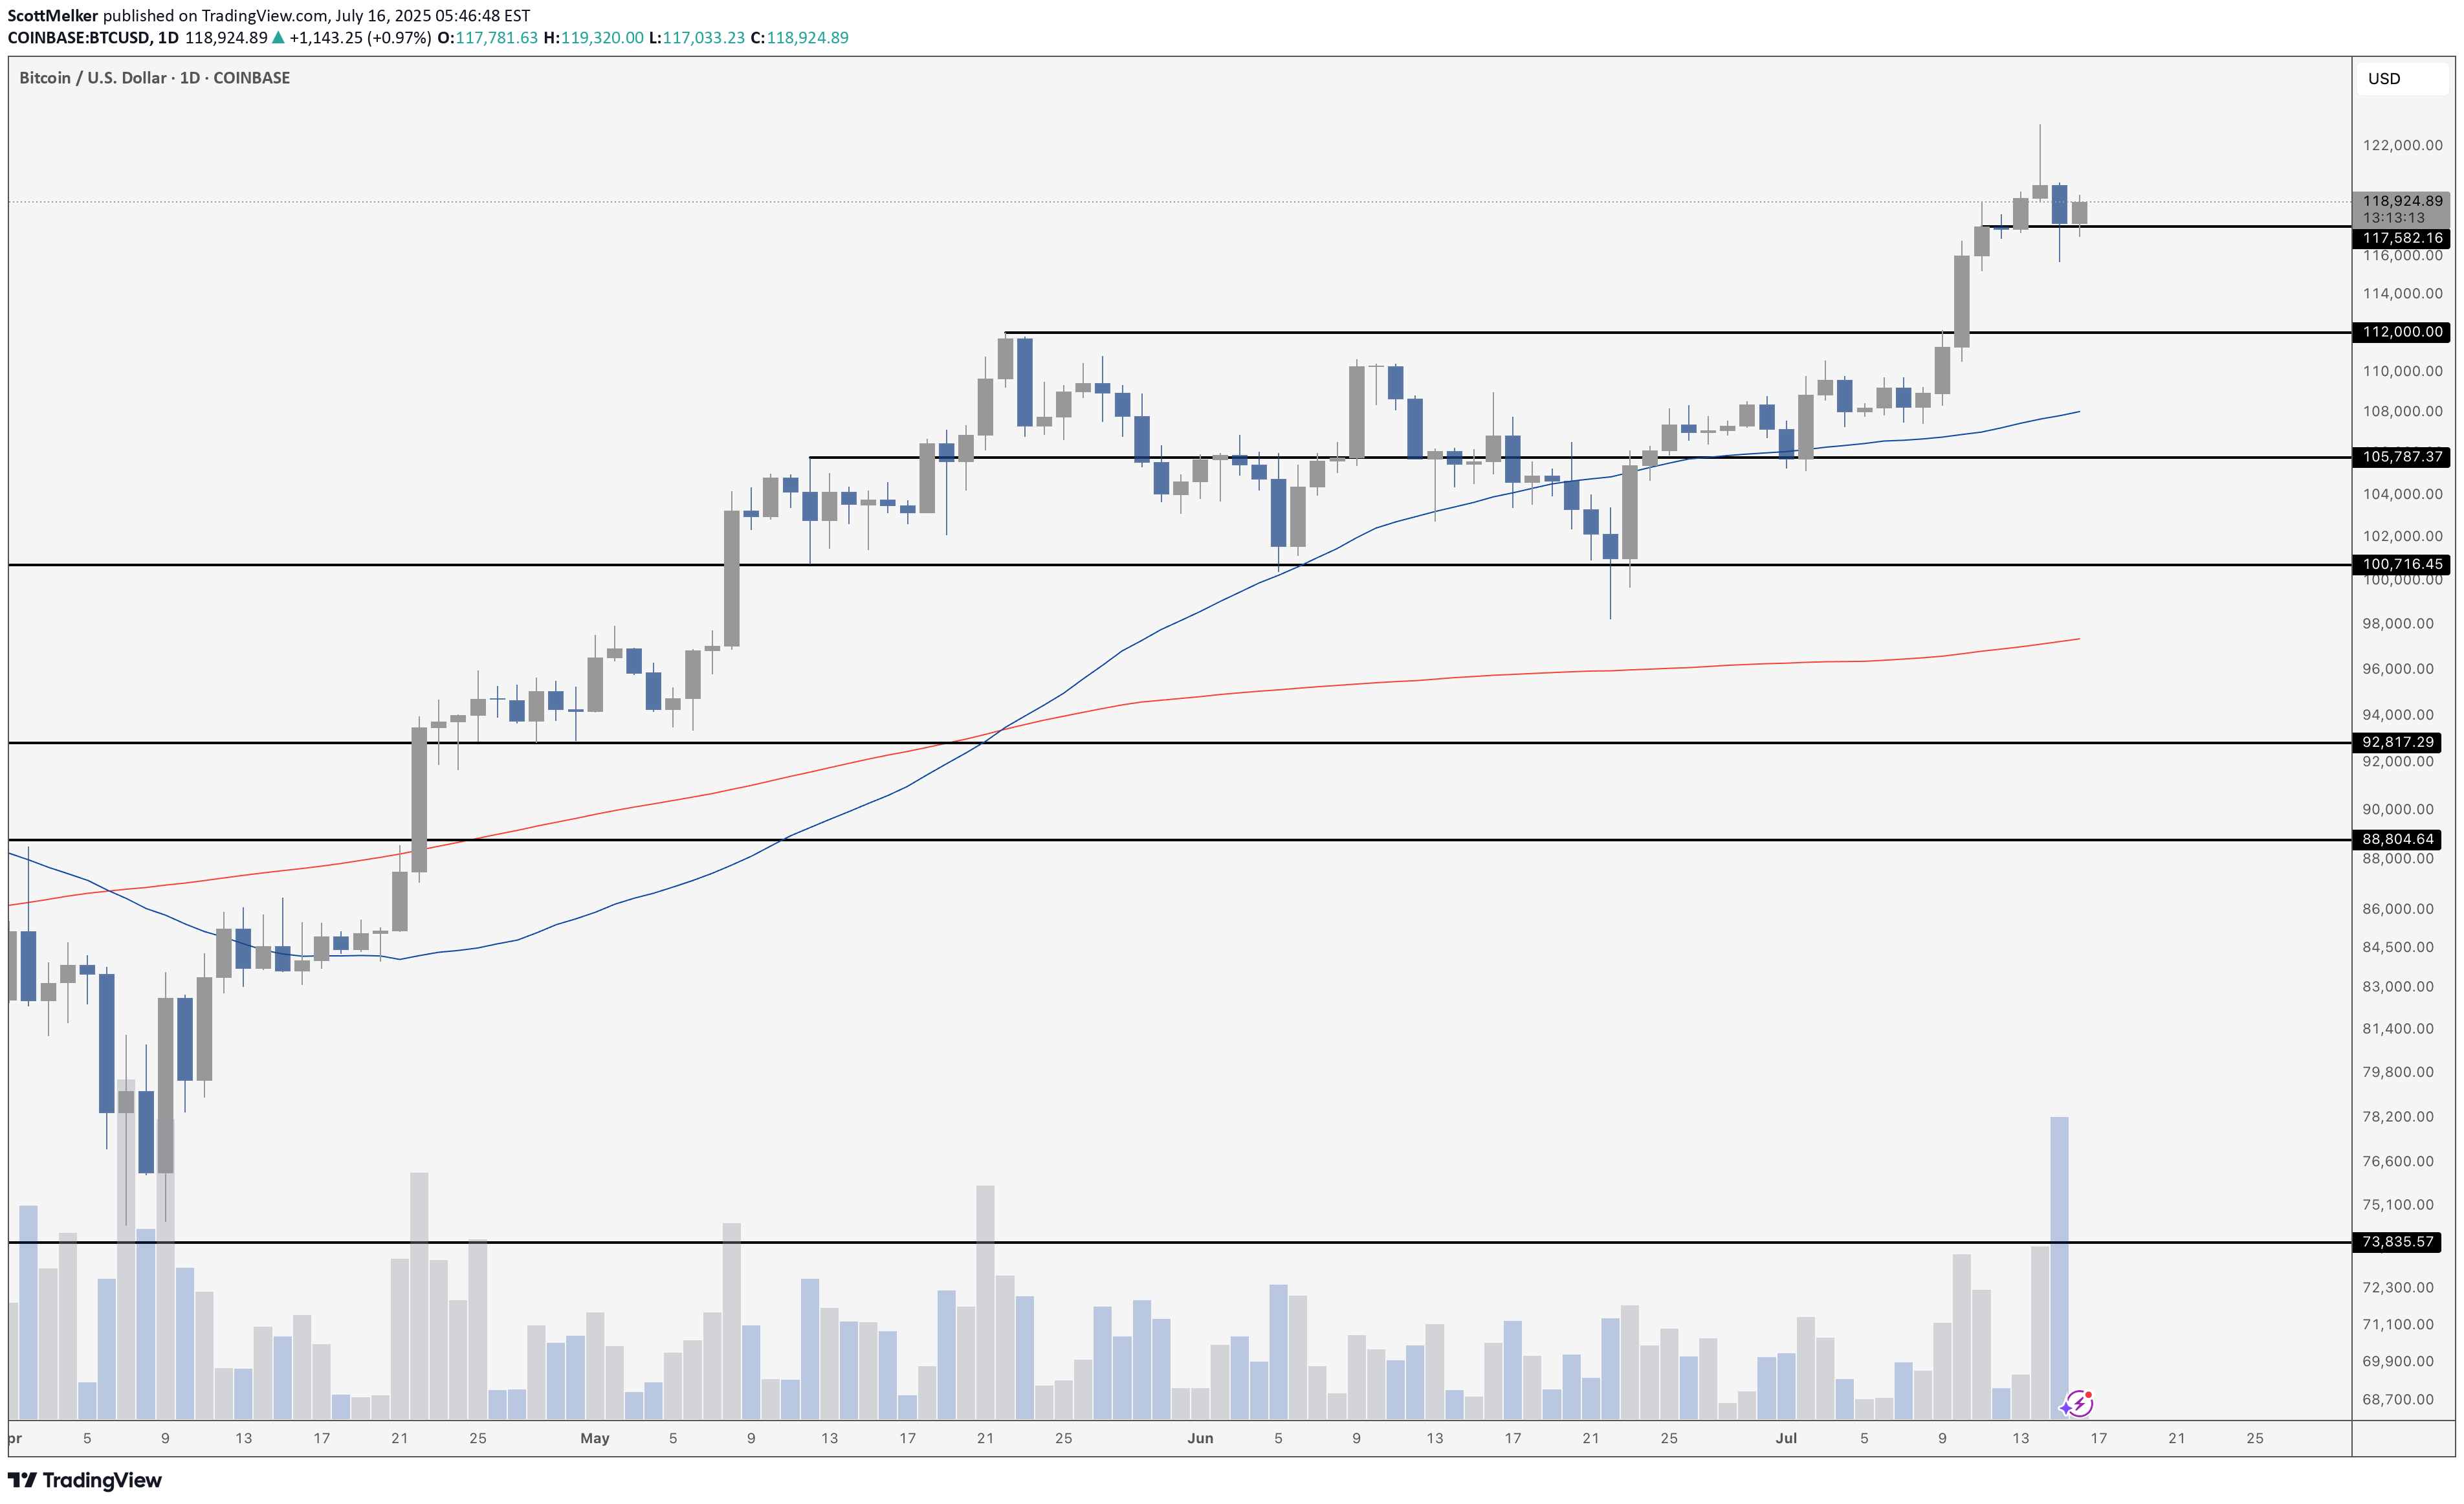
The Bitcoin daily chart paints a nuanced picture following Tuesday’s pullback – which came on the highest volume day since the $74K bottom in mid‑April, specifically on Coinbase. But notably, that surge in volume was primarily driven by selling, not buying – a key detail that shifts the tone of the candle. Despite the aggressive downward move, price found support around $116,000 and recovered into the close, finishing the day above $117,000. However, the heavy sell volume behind that move suggests it wasn’t just a casual dip – it was real distribution. That said, bulls showed resilience on Wednesday, pushing price back toward $119,000 and defending the key $116,000–$118,000 zone. If Bitcoin can maintain this level and digest the selloff without rolling over, it may absorb the supply and build a base for continuation. But traders should stay cautious – high‑volume sell days near local highs can sometimes mark short‑term tops or signal a shift in momentum. The $112,000 breakout zone remains the critical downside level to watch if the current range fails.
