Technical analysis by MR_gold2 about Symbol BTC on 7/12/2025

MR_gold2
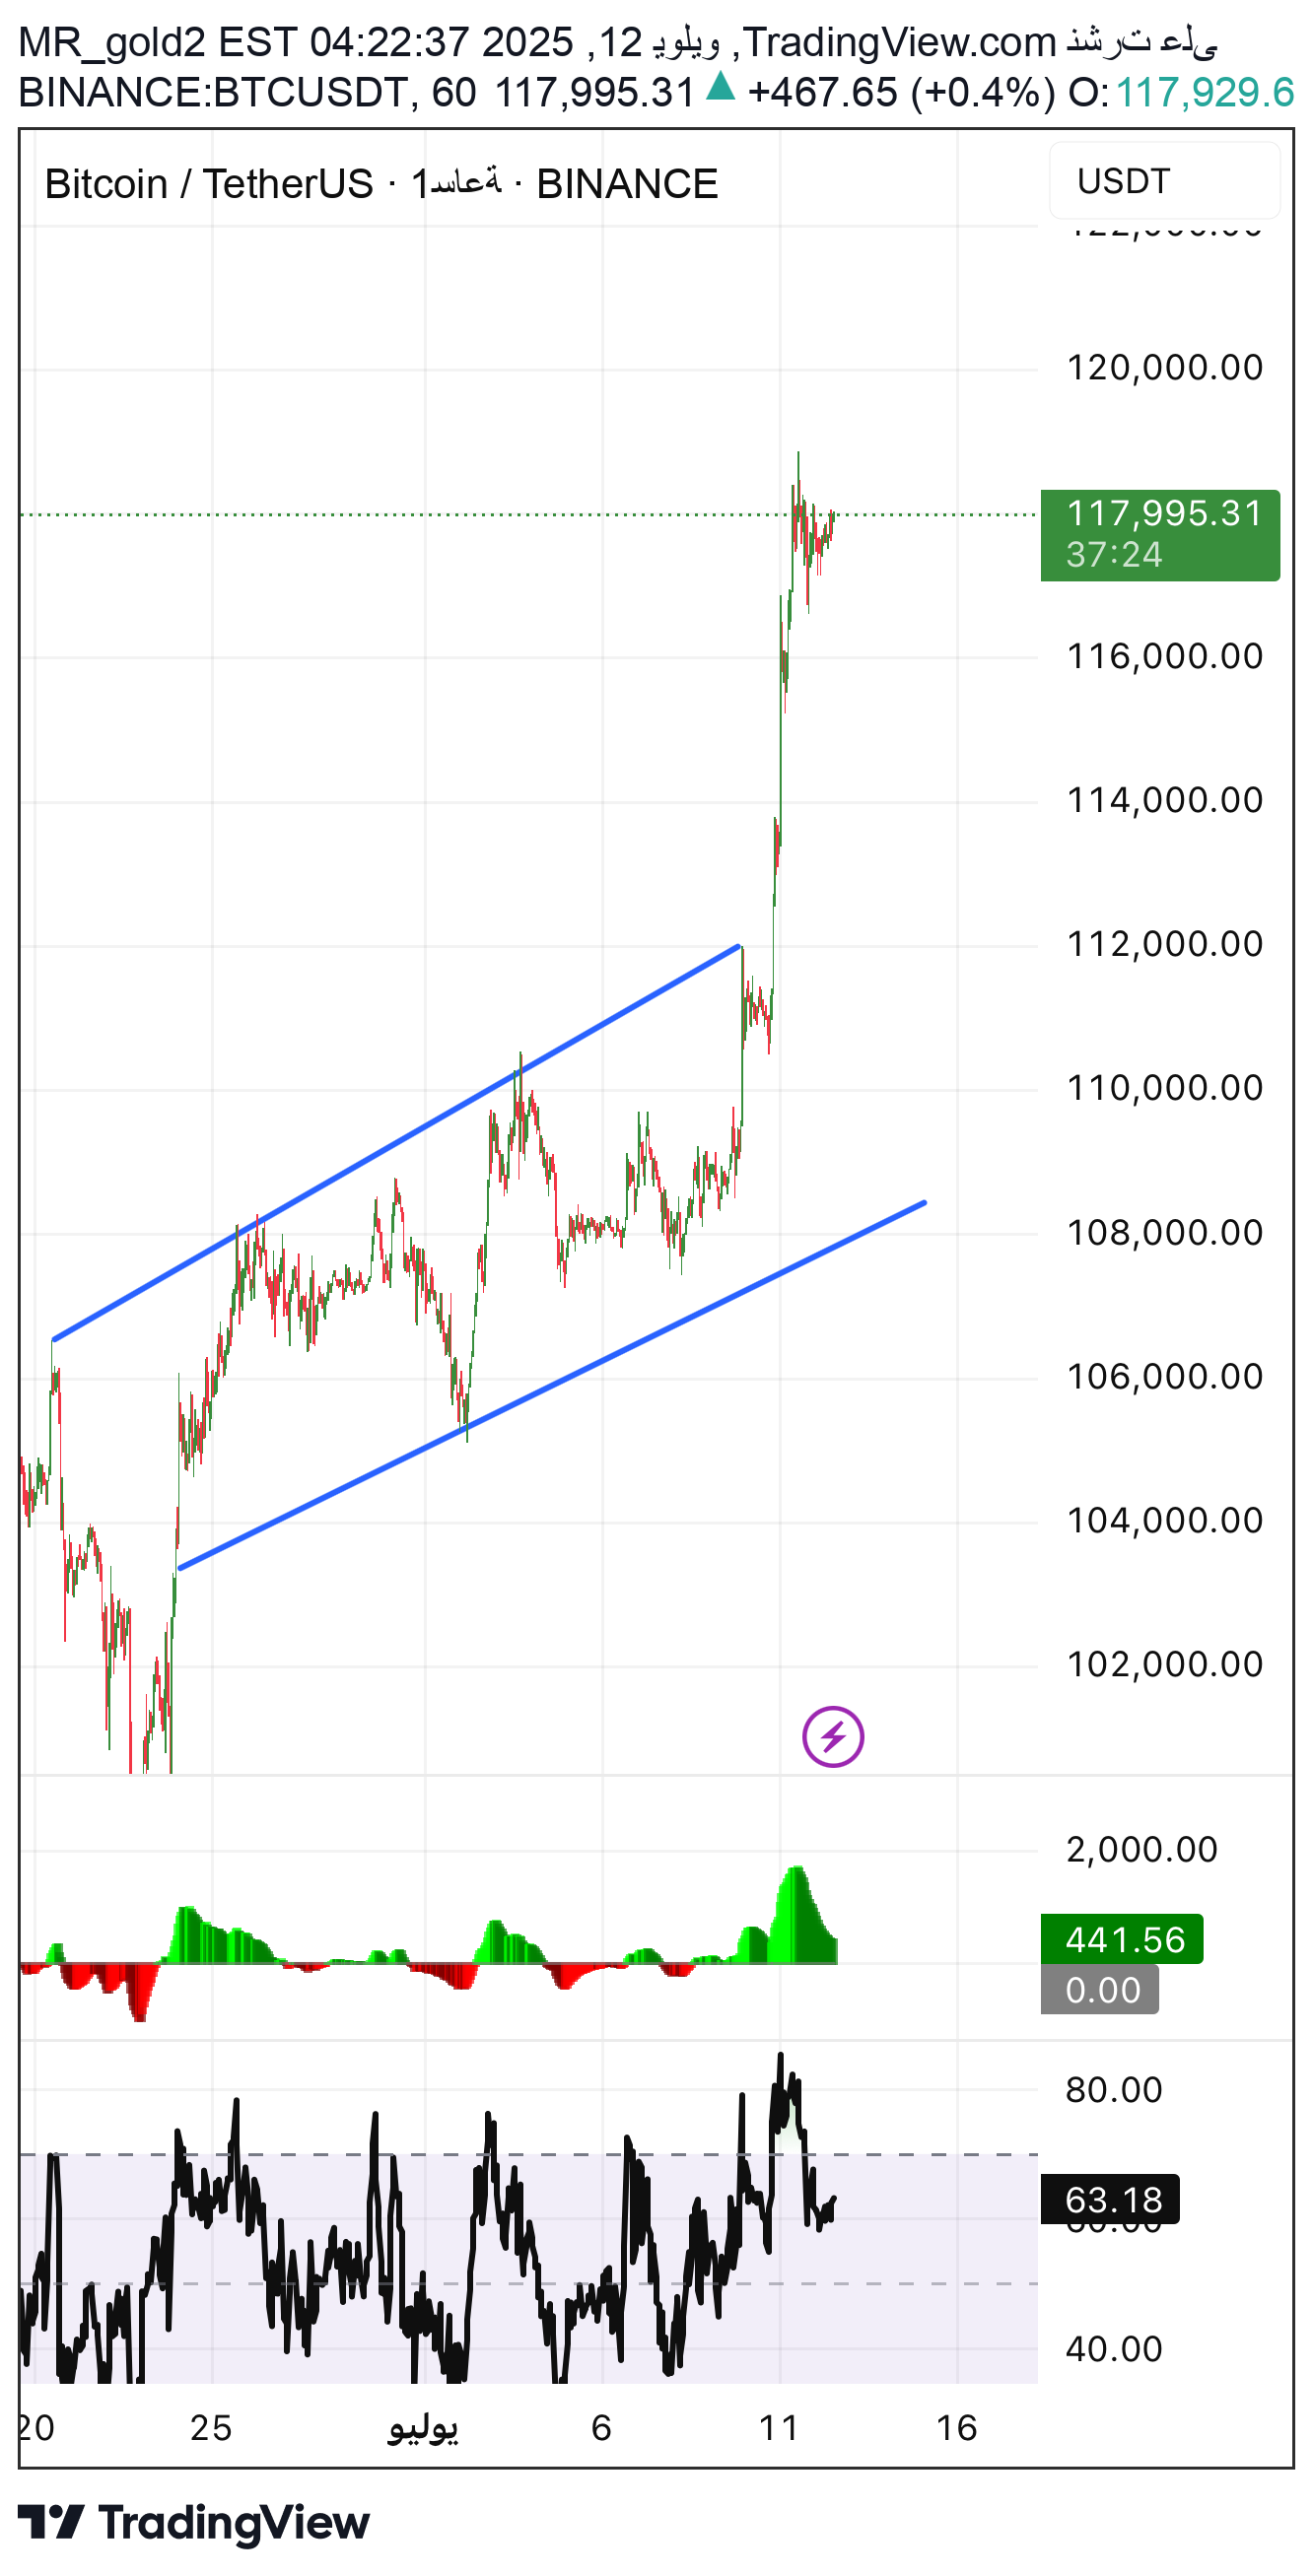
First: Technical Analysis (Ferm Al -Hour - 1H) • The general trend: a strong rising, we notice a clear penetration of the resistance of 114,000, then a great acceleration in the rise about 118,000. • Current price: 117,814. • The price creates a short -term ascending channel after a large penetration, and it appears to be in a temporary collection area after climb. Elliott wave • It seems that we are in a driving wave (Impulse), which is either: ◦ The wave (3) of a major wave. You will follow it. • • The last wave is extended and coherent, and indicates that the fourth wave corrected, and after that we are waiting for a final last wave of up to 122.,000 Time analysis • There is a great acceleration in the timeline recently, which is likely to approach a "short wave peak". • The possibility of a time correcting within the next 12 to 24 hours is very possible. Digital analysis • The price penetrated the area of 114,000 strongly, and the psychological resistance exceeds 115,000 and 117,000. • The following potential digital target is located at: 120,000 and 122,400 (representing important technical and psychological extensions). The first important digital support: 114,000 - basic confirmation support for any upcoming rise. Basic analysis • The presence of economic events does not appear directly, but the height of bitcoin is often due to: Decrease the dollar or expectations to reduce interest. Strong institutional flows or ETF. ◦ The absence of negative news from the market or the lifting of sanctions on platforms. • PRICE Action • A strong penetration with breaking a previous top and forming a small price gap. • The last rising candles (almost Marubuzo), followed by small candles, indicating a temporary balance between buyers and sellers (the possibility of a small close correction). • There are no clear reflection signals yet, but we need to monitor a strong descending candle to confirm any correction. 📈 Expected Fibonacci correction areas (from the last ascending wave) If we calculate the correction from the last bottom nearly 100,000 to the top of approximately 117,800: • 23.6% at: 113,800 - light support • 38.2% at: 110,800 - average support • 50% at: 108,900 - Possible strong support • 61.8% at: 107,000 - a possible gold support for apostasy Fibonacci extensions (if this is a wave 3 or 5) • 123.6%: 120,000 - First goal • 138.2%: 122,400 - A second goal • 161.8%: 125,500 - A possible third goal if the momentum continues Recommendation based on the current situation Script Trading plan 🔄 Correction near Wait for a landing to one of the Fibonacci levels shown above to buy 📈 Continuing ascension Buy a clear fracture of 118,000 with a goal of 120,000, a loss of loss 📉 sudden reflection In the event of a strong hippocker on 1H - selling 114,000 You are the only person responsible for pressing the button to buy and sell For more, I organize our free channel in Tremram https://t.me/ihab90gold
