Technical analysis by TopChartPatterns about Symbol XRP: Buy recommendation (7/4/2025)

TopChartPatterns
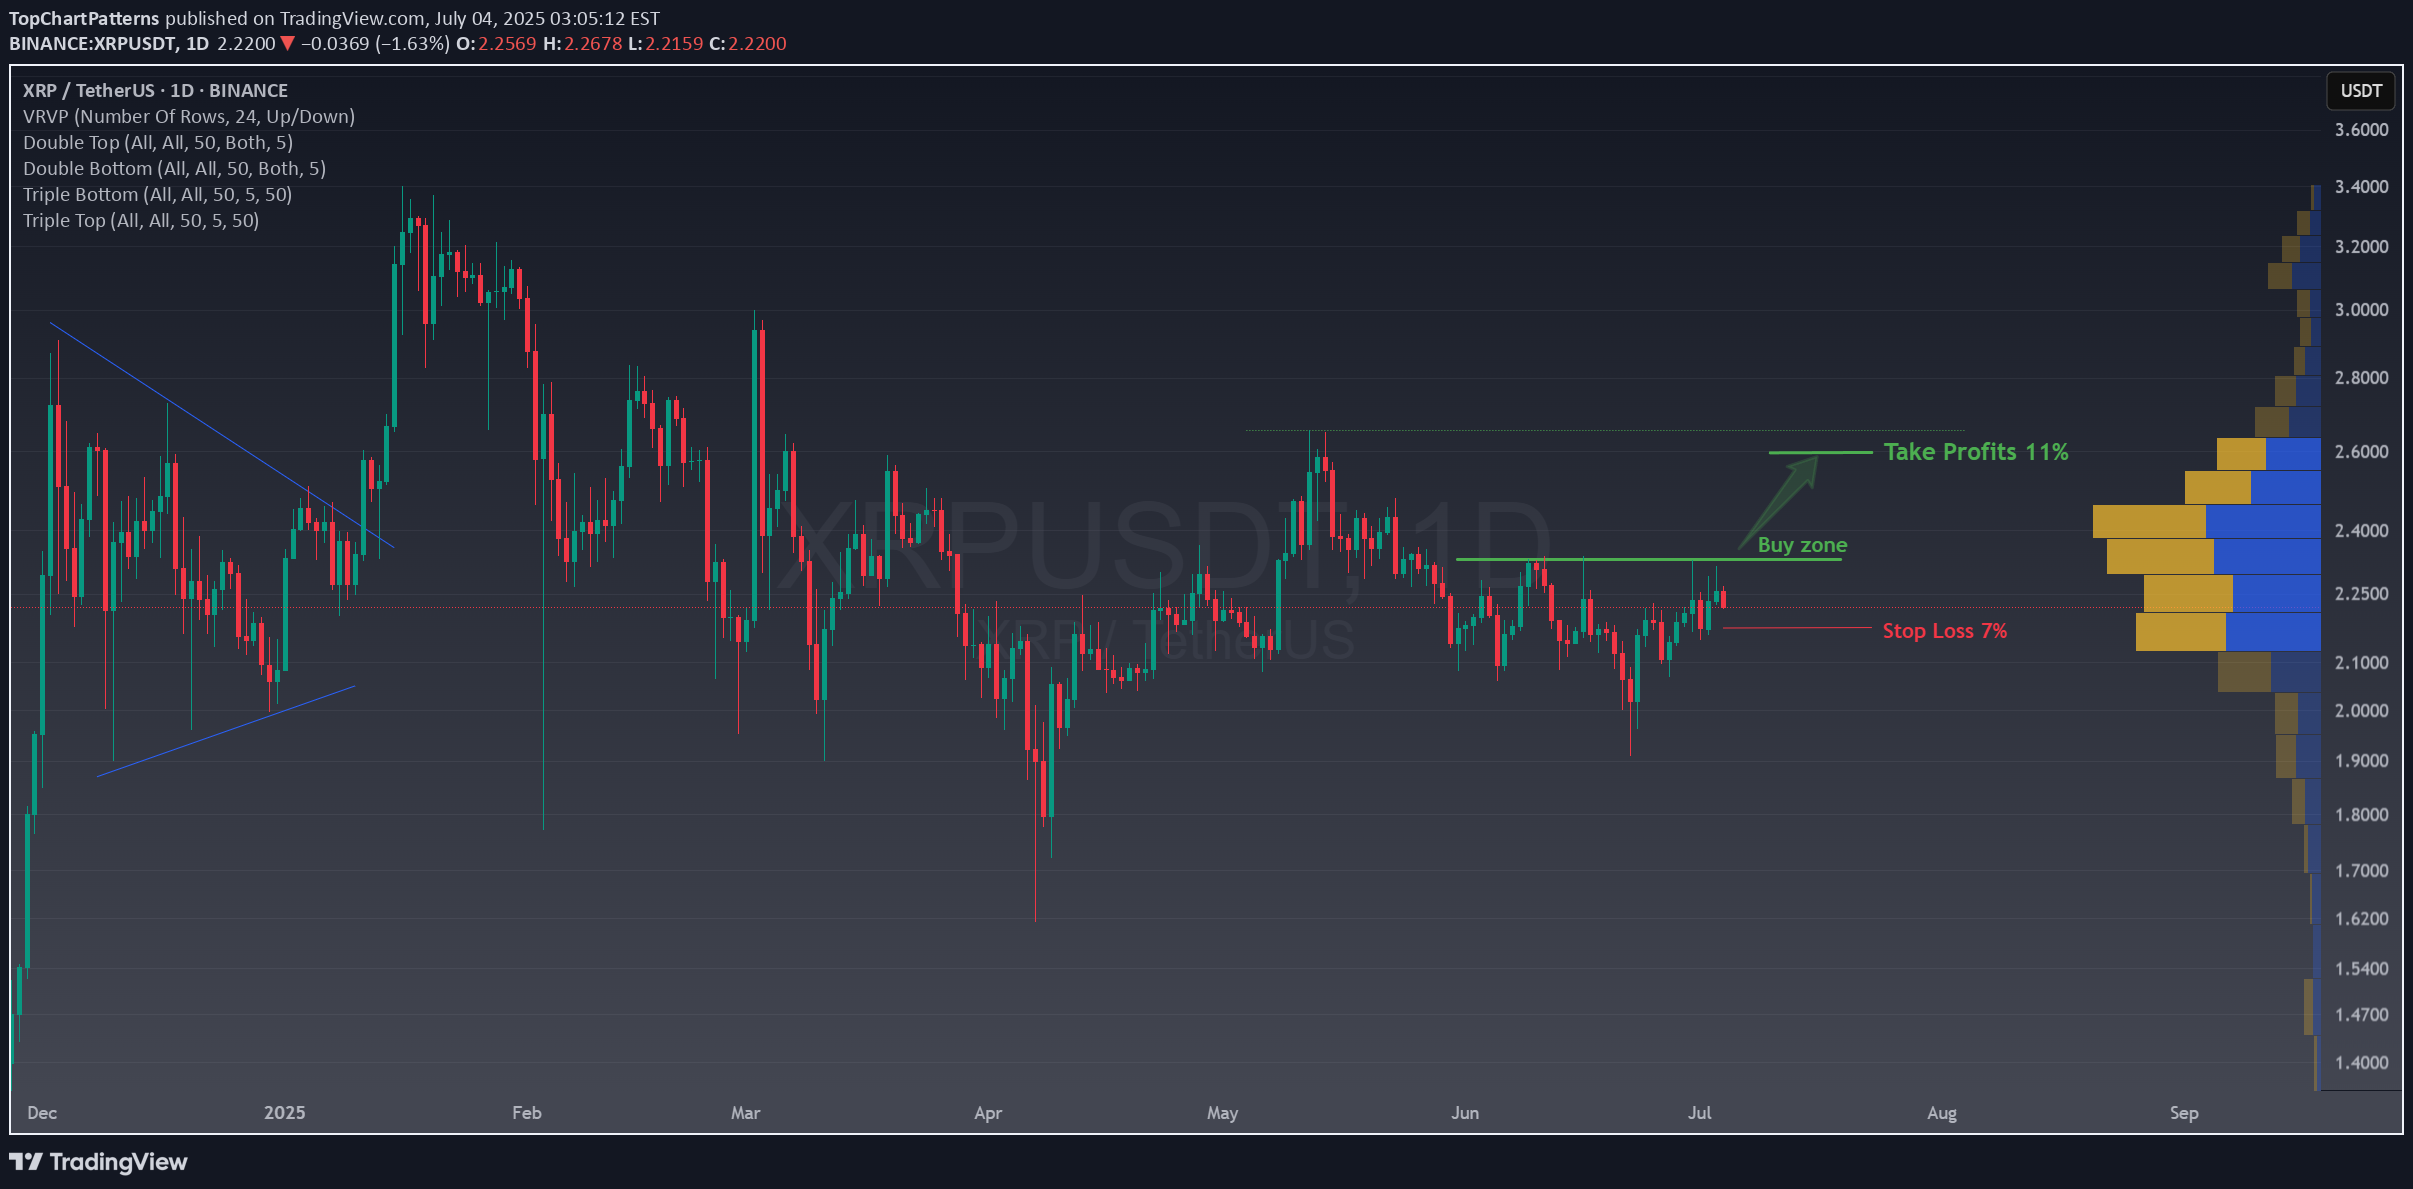
✅ 1. Buy Zone Identified The “Buy zone” is a green area where the price has recently been consolidating (moving sideways). 💡 If the price breaks above this level or shows strength here, it could be a good opportunity to enter a long (buy) trade. 🎯 2. Take Profit Target: +11% The “Take Profits” line above the buy zone suggests a potential 11% upside. This is where you might want to sell your position and lock in gains if the price moves in your favor. 🛑 3. Stop Loss: -7% The “Stop Loss” is clearly marked below the buy zone, with a 7% risk. This is your safety net , if the price falls to this level, the trade automatically closes to prevent further loss. 📦 4. Volume Profile (on the right side) The blue and yellow bars show the Volume Profile, which highlights price levels where most trading activity happened. 🔹 The cluster near the buy zone means there was strong interest in this area — it could act as a support zone. 🚀 Simple Summary The chart shows a bullish setup for XRP/USDT. There’s a clear Buy zone where price is trying to break higher. The profit target is +11%, and the stop loss is -7%. Volume data supports this as an important price zone.The price is moving as expected, let's wait for TP11% profit done in few hours! XRP has room to keep moving, but we will focus on new patterns.
