Technical analysis by Tdawly_Official about Symbol BTC: Buy recommendation (6/21/2025)

Tdawly_Official
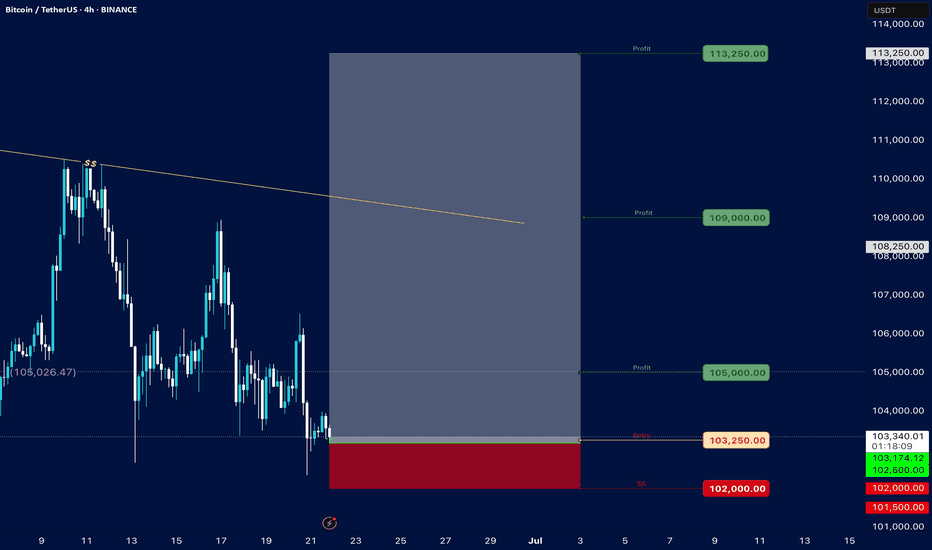
### Bitcoin Price Analysis (June 21, 2025) #### **Current Price**: $103,236.15 (as of the snapshot) - The price is hovering near the lower end of the recent range, with key support at **$102,000** (marked as "S/s" on the chart). - Resistance levels are visible at **$105,000**, **$107,000**, and **$110,000–$114,000**. #### **Key Observations**: 1. **Support and Resistance**: - **Strong Support**: $102,000 (critical level; break below could signal further downside). - **Immediate Resistance**: $105,000 (previous entry point and psychological level). - **Higher Targets**: $110,000–$114,000 (if bullish momentum returns). 2. **Price Action Context**: - The price recently rejected the $105,250 level ("Entry") and is now testing lower support. - The "Profit" markers at $105,000 and $105,026 suggest these were take-profit zones for traders. 3. **Trend and Sentiment**: - The chart shows consolidation between $102,000–$110,000, with no clear breakout yet. - A hold above $102,000 could lead to a retest of $105,000, while a break below may target $100,000 or lower. 4. **Volume and Timeframe**: - The snapshot lacks volume data, but the date range (June–July) suggests a medium-term view. - Key dates to watch: June 25–28 and early July for potential volatility. #### **Conclusion**: - **Bullish Case**: Hold above $102,000 and reclaim $105,000 to aim for $110,000+. - **Bearish Risk**: Break below $102,000 could accelerate selling toward $100,000 or $99,000. **Actionable Insight**: Watch the $102,000–$105,000 range for a breakout or breakdown. A rebound from support with volume could signal a buying opportunity, while a drop below $102,000 may indicate further downside. *(Note: The analysis is based on limited data from the snapshot. For a full assessment, additional indicators like RSI, MACD, and volume would be needed.)*
