Technical analysis by Aria-Margot-Fx about Symbol BTC: Sell recommendation (6/25/2025)

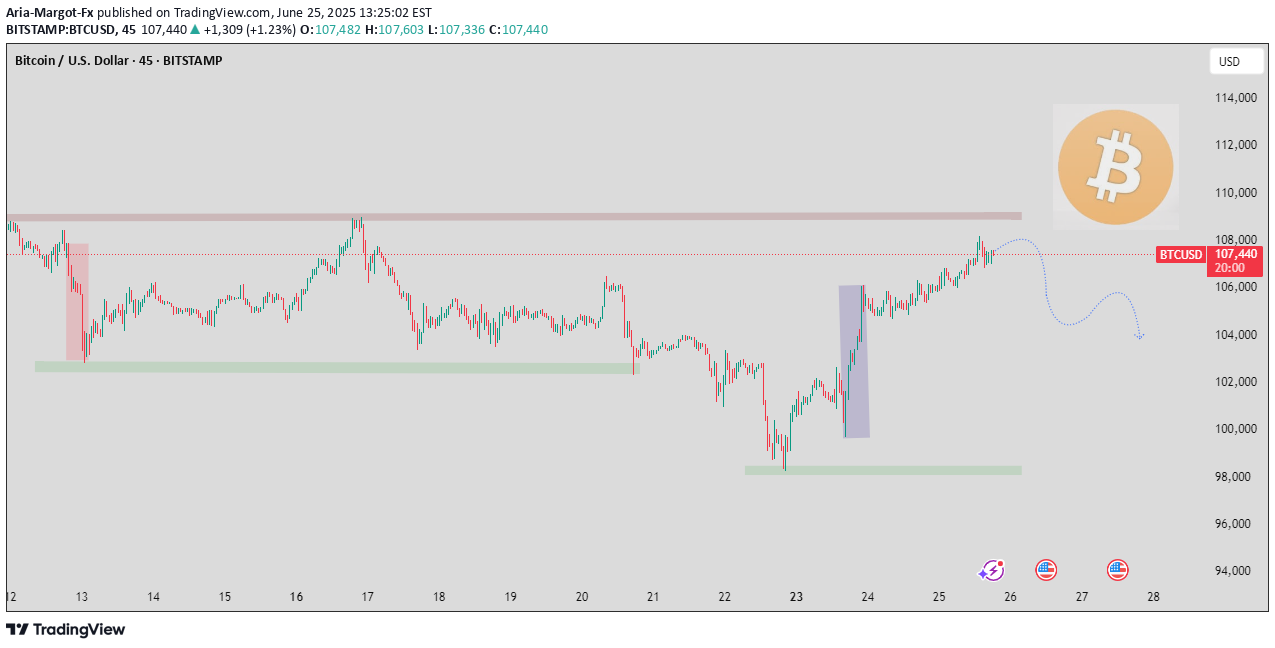
📊 Bitcoin Technical Analysis🟩 OverviewAsset: Bitcoin (BTC/USD)Current Price Action: Approaching or testing the $108,000 resistance zone.Chart Type: CandlestickIndicators Present: Trendline, horizontal resistance zone, potential retracement projection.---🔍 Key Observations1. Major Resistance at $108,000Price has rallied into a well-defined horizontal resistance zone, shown with a red rectangle.This level has historical significance — likely a previous high or congestion area.Multiple rejections around this level could signal weakening bullish momentum.2. Bearish ProjectionThe blue dashed line suggests a retracement scenario:Initial support zone: ~$104,000Deeper pullback target: ~$102,000This implies a short- to medium-term bearish outlook if bulls fail to break and hold above $108,000.3. Trendline & StructureThe chart does not show a strong upward continuation pattern like a bull flag or breakout.Instead, it looks like a rising wedge or exhaustion pattern nearing completion.4. No Indicators Visible (e.g., RSI, MACD)It’s harder to confirm overbought/oversold conditions or divergences, but the price action alone suggests hesitation and potential reversal.---⚖ Conclusion: Bullish or Bearish?BiasJustification🟥 Bearish- Price struggling at $108K resistance
- Bearish projection marked
- No breakout confirmation
- Risk of profit-taking at highs🟩 Bullish- Only if $108K is broken convincingly with volume and follow-through
- Retest and hold above $108K could invalidate reversal setuptrade active
