
Aria-Margot-Fx
@t_Aria-Margot-Fx

What symbols does the trader recommend buying?
Purchase History
پیام های تریدر
Filter
Signal Type
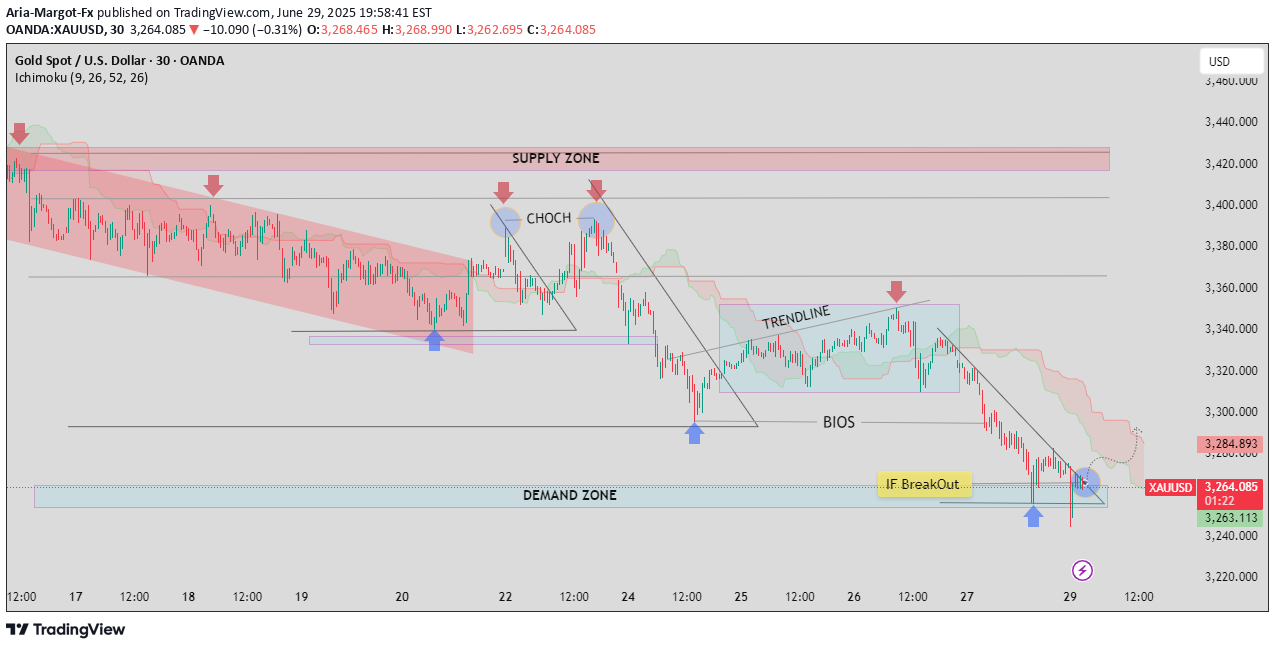
🟡 XAUUSD (Gold/USD) – Smart Money Analysis | Bearish Bias with Key Breakout Watch📆 Date: June 30, 2025⏰ Timeframe: 30-Minute🔍 Market Type: Range-to-Trend Transition---🔹 Overview:XAUUSD recently transitioned from a ranging structure into a clear bearish trend after several structural breaks. This chart applies Smart Money Concepts (SMC), including CHoCH (Change of Character), BIOS (Break of Internal Structure), and traditional supply/demand zones to map out high-probability setups.---🔸 Key Observations:🔺 Supply Zone (Top Red Box):A clearly defined supply zone where price consistently faced resistance.Multiple rejection wicks (red arrows) confirm institutional selling.Price failed to break above despite a bullish CHoCH attempt.🔻 Demand Zone (Bottom Blue Box):Significant buy orders evident at this level (marked by blue arrows).Multiple tests suggest it’s a critical liquidity zone — any clean break signals strong bearish momentum.🔁 CHoCH and Trendline Break:The CHoCH marked a temporary bullish structure shift but was quickly invalidated by a strong sell-off.A descending trendline confirms persistent lower highs.Recent BIOS confirms institutional intent to push lower.---📈 Current Setup:🔶 IF Breakout Confirmation (Yellow Box):Price is consolidating just above the demand zone after multiple tests.Watch for breakout structure: A confirmed candle close below the demand zone would signal continuation toward lower demand levels (targeting the 3,240.00 – 3,220.00 area).Alternatively, a strong bounce and BOS (Break of Structure) above the minor consolidation high could indicate a liquidity grab and reversal.---📊 Ichimoku Cloud Insight:Price is trading below the cloud, indicating bearish bias.The cloud is acting as dynamic resistance.Bearish TK cross is likely reinforcing the downside momentum.---✅ Potential Trading Ideas:Scenario 1 – Bearish Continuation:Entry: Below 3,260 on breakoutSL: Above 3,280 (recent high)TP1: 3,240 | TP2: 3,220Scenario 2 – Bullish Rejection & Reversal:Entry: On bullish engulfing at demand zoneSL: Below 3,260TP1: 3,280 | TP2: 3,320 (trendline retest)---💬 Final Thoughts:This chart illustrates how institutional order flow and market structure shifts (CHoCH, BIOS, Supply/Demand) can provide confluence with classic indicators like Ichimoku. The setup is clean, logical, and offers asymmetric risk-to-reward profiles depending on breakout confirmation.
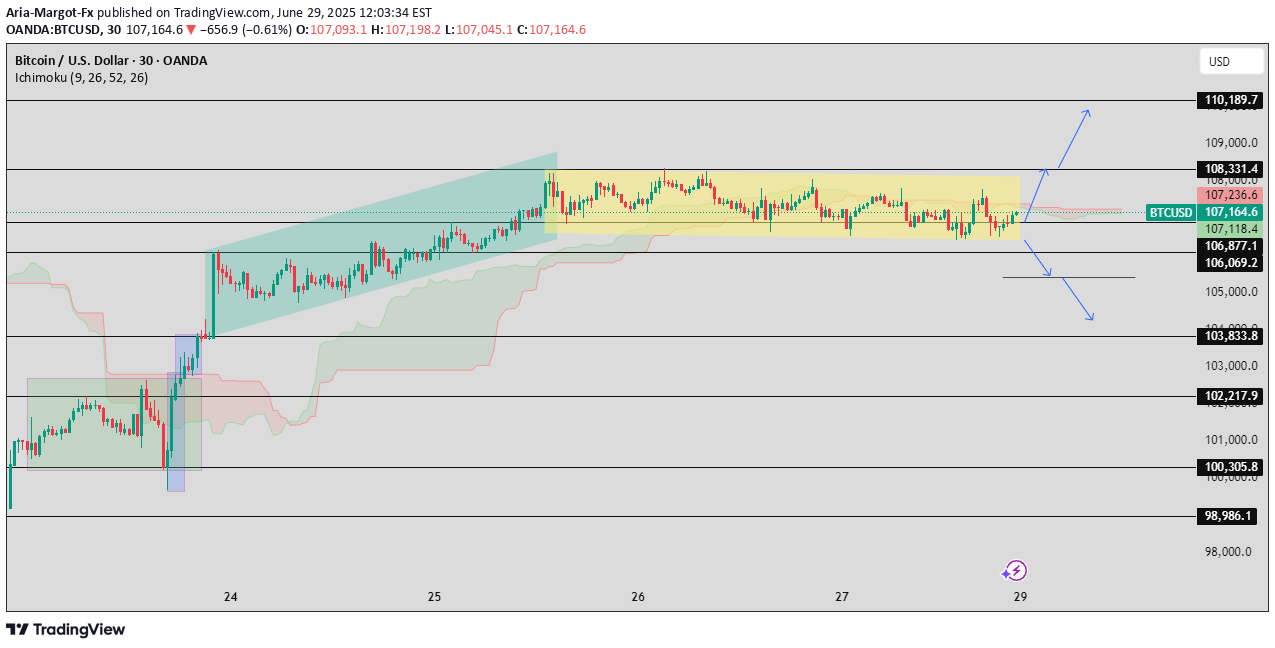
BTC/USD Analysis – June 29, 2025Timeframe: 30-MinExchange: OANDAAnalyst: Aria-Margot-Fx---📌 OverviewBitcoin (BTC/USD) is currently consolidating within a well-defined horizontal range after a sustained uptrend. Price is oscillating between key support at $106,069 and resistance at $108,331, forming a textbook accumulation/distribution zone (highlighted in yellow). The market appears to be coiling for a breakout, with a directional move likely imminent.---🔍 Key Observations1. Previous Trend:Strong bullish impulse led to a rising channel (green zone) which has now transitioned into sideways consolidation.Prior price action was marked by clean structure and consistent higher highs/lows.2. Current Structure:Range-bound structure: $106,069 - $108,331.Price is hovering near mid-range ($107,164) with visible compression of volatility—often a precursor to breakout.3. Critical Levels:LevelDescription110,189Bullish breakout target (measured move projection)108,331Range resistance; breakout point106,069Range support; breakdown trigger103,833 / 102,217Bearish continuation targets100,305 / 98,986Strong demand zones---📈 Potential Scenarios🔵 Bullish Breakout:If BTC breaks and closes above $108,331 with strong volume:Expect continuation toward $110,189.Ideal entry: Retest of breakout zone with confirmation (bullish engulfing / demand wick).🔻 Bearish Breakdown:If BTC loses $106,069 support decisively:Short-term targets: $103,833 and $102,217.Break of $100,305 would indicate a full reversal of the prior trend.---🧠 Analyst InsightThis consolidation may reflect institutional positioning, with smart money accumulating ahead of the next big move. Traders should:Wait for confirmation outside the yellow box.Use tight stop losses within the range.Track volume and momentum indicators for breakout validation.---📊 Strategy RecommendationStrategy TypeEntry ZoneTargetStop LossBreakout LongAbove $108,331$110,189$107,000Breakdown ShortBelow $106,069$103,833 → $102,217$107,200---💡 Final ThoughtsBTC is at a critical inflection point. The tighter the consolidation, the more explosive the breakout. Be patient, trade the breakout, not the anticipation.If this idea adds value, give it a like and share your thoughts below!---✅ Pro Tip for Editors' Picks:Include a clear title like:> "BTC/USD Coils for Breakout: Will $110K Hit Next or Are We Heading Back Below $103K?"treade active
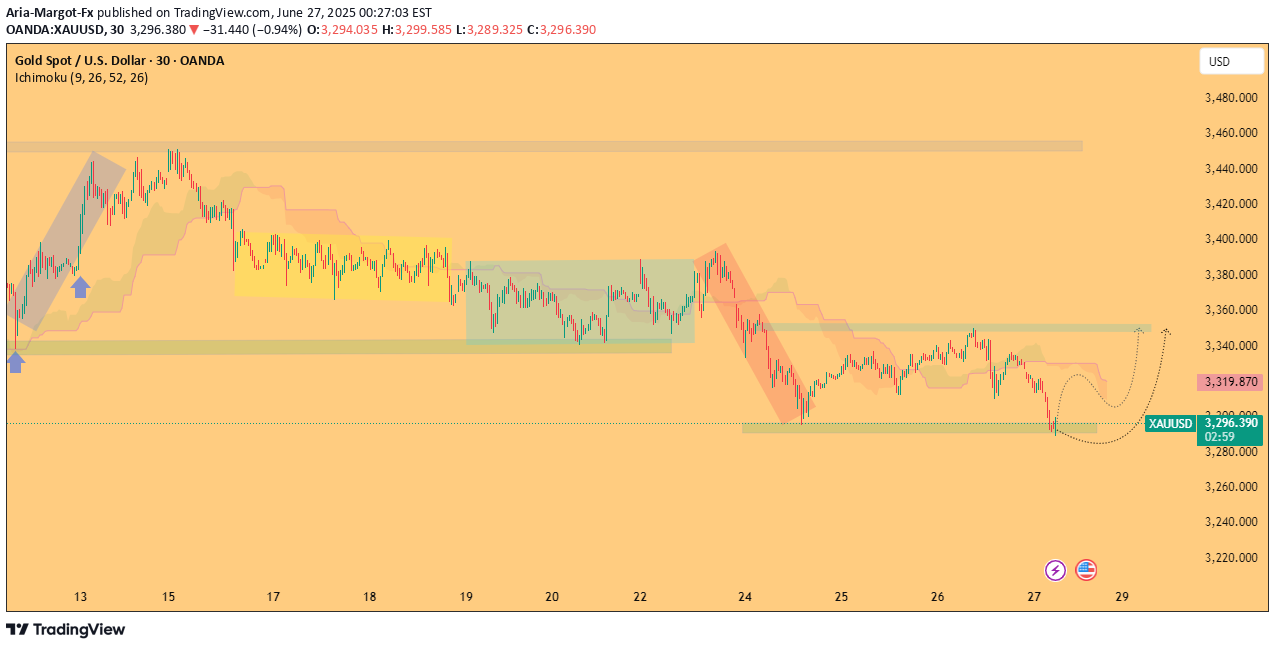
🔍 Market Context:Gold (XAU/USD) has recently revisited a historical demand zone around the $3,288–$3,295 level — an area that previously triggered strong bullish moves (see arrows on left structure). This zone has consistently acted as a bullish inflection point, with high-probability reversals following prior visits.📊 Technical Analysis Breakdown:Previous Rally (Left Side):The strong impulsive move from this zone (marked by blue arrows) laid the foundation for the bullish bias, further confirmed by the breakout rally.Mid-Chart Consolidation (Yellow/Green Zones):A large period of range-bound consolidation followed the rally, suggesting accumulation or distribution. Breakout from this structure eventually led to a significant bearish correction (red channel).Current Structure (Right Side):Price has once again reached the critical support, where we observe:A possible double-bottom or sweep of liquidity below the previous lows.Bullish divergence (if confirmed on lower TF indicators such as RSI or MACD).A projected recovery path toward the $3,360 zone (highlighted in green).⚠ Bearish Scenario to Watch: A clean break and close below $3,288 with volume could invalidate the bullish thesis and expose the next downside targets toward the $3,240 and $3,220 levels. Always manage risk accordingly.---🧭 Why This Setup Matters:This chart isn’t just about a potential bounce — it’s about understanding market psychology at a key demand zone. If bulls defend this area again, it reinforces the narrative of smart money accumulation. If not, it could be the early stages of a much deeper correction.---🎯 Trade Setup (Example, Not Financial Advice):Entry Idea: Wait for bullish confirmation via 15m–1h candle closure above $3,305Stop-Loss: Below $3,280Target 1: $3,340Target 2: $3,360---✅ Tips to Further Improve Your TradingView Post:📌 Use annotated labels directly on your chart (e.g., “Demand Zone,” “Liquidity Sweep,” “Range Breakout”).📈 Add RSI or MACD indicators if you mention divergence — this supports your logic.💬 End your post with a question to engage readers:“Will Gold hold the line again — or is this just a bull trap before deeper downside?”---🧱 SummaryThis post shows:Depth: Explains price behavior and structure shifts.Clarity: Uses clean, jargon-free language with trader-relevant terms.Originality: Connects structure, psychology, and tactical planning.Engagement: Encourages readers to interact and think critically.
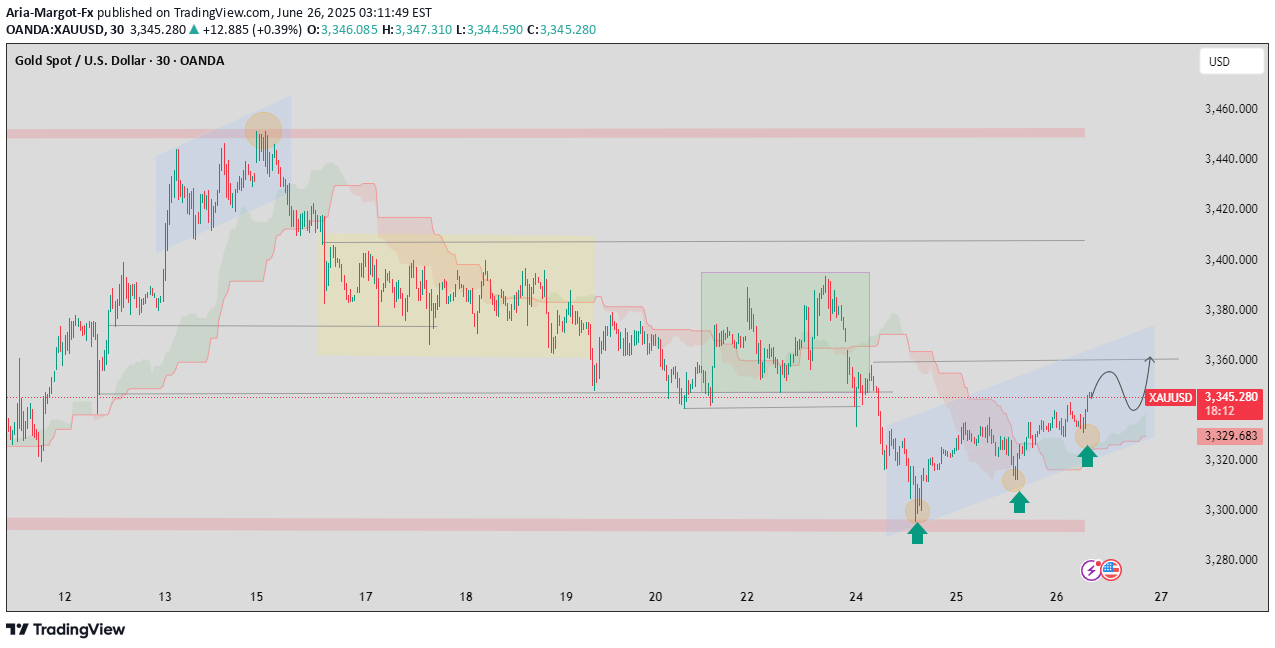
🟡 Gold (XAU/USD) | Rejection from Support with Potential Bullish ContinuationPublished: June 26, 2025Timeframe: 30-Minute | Broker: OANDA---🎯 SummaryGold appears to be staging a potential bullish reversal after a strong reaction off a key support zone around $3,300, with a rising channel formation and higher lows hinting at a break above short-term resistance. This could set up a test of the $3,360–$3,370 level in the near term.---📊 Technical Breakdown🔹 Support Rejection & StructurePrice action found strong demand at the $3,300–$3,310 zone (highlighted by the orange circles and green arrows).Multiple rejections from this zone indicate the presence of institutional buying or defended liquidity.The current price action respects a rising channel, forming consecutive higher lows, a bullish market structure in the short term.🔹 Resistance & Breakout PotentialPrice is approaching a key horizontal resistance at $3,355–$3,360.A clean break and hold above this level could trigger a continuation toward the next liquidity zone near $3,380+, aligning with prior consolidation (green box region).🔹 Ichimoku Cloud AnalysisThe price is testing the Kumo cloud from below.A bullish crossover and breakout above the cloud would further confirm bullish momentum.Leading Span A is flattening, suggesting a potential equilibrium shift in favor of buyers.---🧠 Strategic InsightWhat sets this chart apart is the clear confluence of signals:Structural support,Bullish channel formation,Repeated higher lows,A squeeze against resistance.This paints a scenario where smart money may be accumulating before a breakout. The anticipated move is not merely reactive — it's rooted in fractal price behavior, cloud dynamics, and accumulation logic.---📌 Trade Scenario (Not Financial Advice)Bullish Case:A breakout above $3,360, ideally with volume confirmation, opens the door for a move to $3,380–$3,390. Watch for retests of the breakout zone for potential entries.Bearish Invalidator:A close below $3,320 would invalidate the ascending channel and shift short-term sentiment back to neutral or bearish.---💡 Original PerspectiveWhile many traders focus on the breakout itself, this idea emphasizes the accumulation phase and higher-lows within a compression zone — a subtle yet powerful clue of institutional activity. This nuanced approach provides a layer of depth often overlooked in short-timeframe charts.---📣 Community Prompt🔍 What’s your view on Gold's behavior at this resistance? Are you seeing similar higher-timeframe confluence? Drop your thoughts or alternate views in the comments!
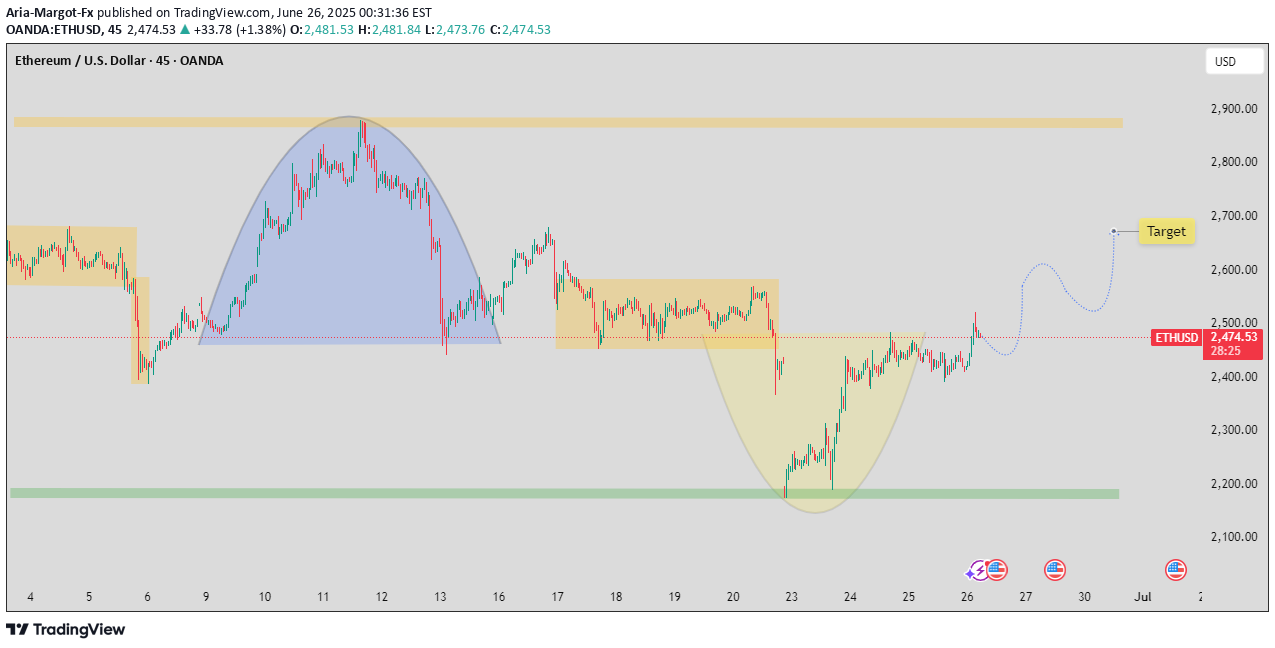
Chart OverviewTimeframe: 45-minuteInstrument: ETH/USD (OANDA)Price at Analysis: $2,474.82Date of Chart: June 26, 2025---📊 Pattern Analysis1. Rounded Top (Bearish Phase)Timeframe: Roughly June 8–14Shape: Large rounded top (highlighted in blue)Interpretation: This typically signals exhaustion in bullish momentum, which was followed by a drop in price.Price Reaction: Significant decline after the peak near $2,900.2. Sideways Range/ConsolidationTimeframe: June 16–21Highlighted Box: Orange rectangleInterpretation: A period of indecision before the next move, eventually leading to a breakdown.3. Rounded Bottom (Bullish Reversal)Timeframe: June 21–25Shape: Cup-like formation highlighted in yellowInterpretation: Suggests potential bullish reversal. The price bounced from the support zone (green band near $2,200).---🔍 Key LevelsLevel TypePrice RangeNotesSupport$2,200–$2,250Historical buy zone (green shaded area)Resistance~$2,900Previous high and key psychological levelTarget~$2,700Highlighted with label "Target"---🔄 Price Action & PredictionThe chart suggests a bullish projection with a zigzag-style recovery:Expected minor retracement around $2,500–$2,550Gradual climb toward $2,700Final leg up marked as the “Target”This forecast is visualized with a dotted blue path showing higher lows and higher highs—a classic bullish structure.---⚠ Risk ConsiderationsRejection at $2,500–$2,550: May delay the bullish push.Break below $2,300: Would invalidate the rounded bottom setup and suggest bearish continuation.Macro Events: The presence of calendar icons (likely U.S. economic data) can cause volatility.
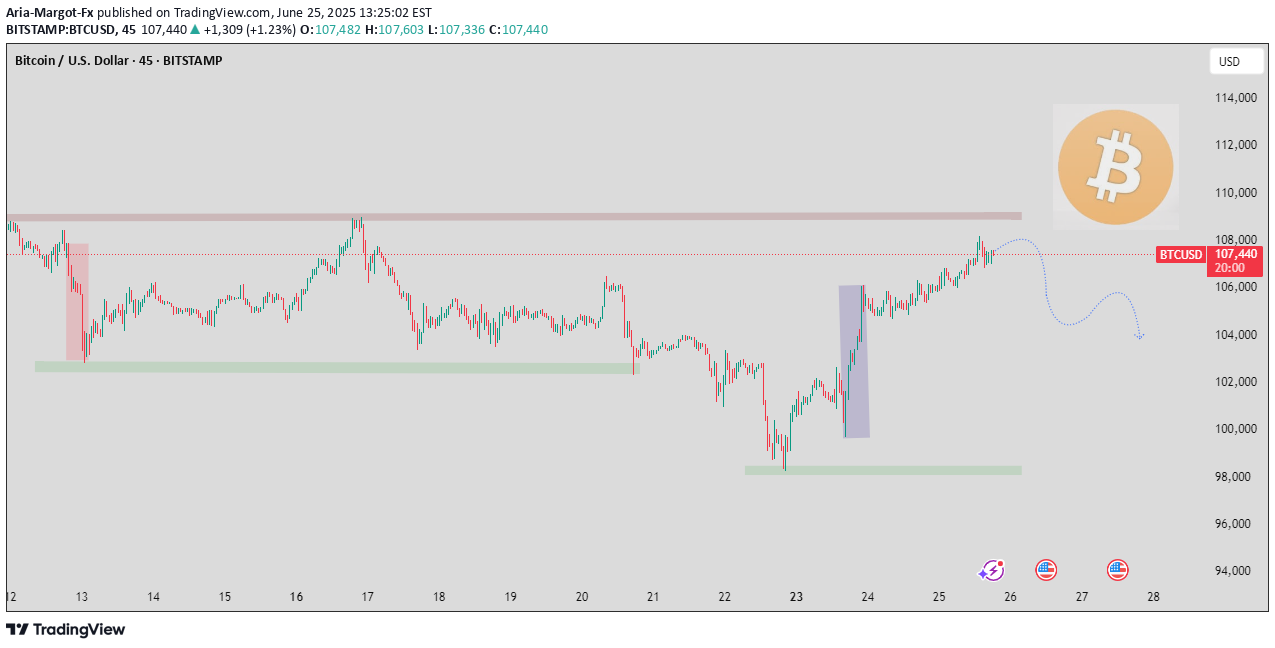
📊 Bitcoin Technical Analysis🟩 OverviewAsset: Bitcoin (BTC/USD)Current Price Action: Approaching or testing the $108,000 resistance zone.Chart Type: CandlestickIndicators Present: Trendline, horizontal resistance zone, potential retracement projection.---🔍 Key Observations1. Major Resistance at $108,000Price has rallied into a well-defined horizontal resistance zone, shown with a red rectangle.This level has historical significance — likely a previous high or congestion area.Multiple rejections around this level could signal weakening bullish momentum.2. Bearish ProjectionThe blue dashed line suggests a retracement scenario:Initial support zone: ~$104,000Deeper pullback target: ~$102,000This implies a short- to medium-term bearish outlook if bulls fail to break and hold above $108,000.3. Trendline & StructureThe chart does not show a strong upward continuation pattern like a bull flag or breakout.Instead, it looks like a rising wedge or exhaustion pattern nearing completion.4. No Indicators Visible (e.g., RSI, MACD)It’s harder to confirm overbought/oversold conditions or divergences, but the price action alone suggests hesitation and potential reversal.---⚖ Conclusion: Bullish or Bearish?BiasJustification🟥 Bearish- Price struggling at $108K resistance
- Bearish projection marked
- No breakout confirmation
- Risk of profit-taking at highs🟩 Bullish- Only if $108K is broken convincingly with volume and follow-through
- Retest and hold above $108K could invalidate reversal setuptrade active
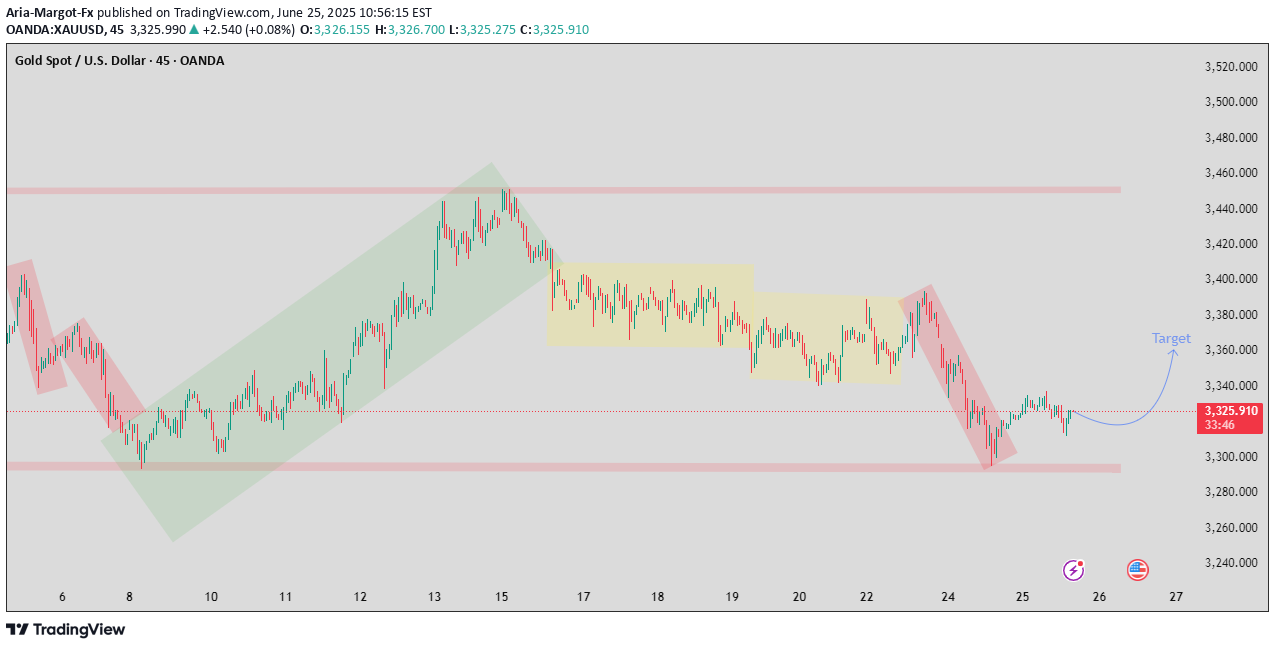
🔍 Technical Analysis: XAU/USD (Gold Spot – 45-Min Chart)Date: June 25, 2025Current Price: $3,326.035---🔸 1. Market Structure OverviewDowntrend ➡ Consolidation ➡ Downtrend ➡ Base FormationThe chart reveals a classic market sequence:Initial downtrend (early June)Strong recovery/rally (highlighted in green)Sideways consolidation (yellow range zone)Second downtrend (highlighted in red)Current price forming a potential bottom---🔸 2. Key ZonesSupport Zone: ~$3,290–$3,310Marked by a pink shaded area. Price has rebounded here previously.Price is currently hovering near this zone again, showing signs of buying interest.Resistance/Target Zone: ~$3,360The blue arrow and label “Target” indicate the expected recovery level.This area aligns with prior minor support-turned-resistance (confluence zone).---🔸 3. Volume & Candlestick ActivityWhile volume is not visible in this image, price action shows:Smaller-bodied candles and wicks near current lows suggest weak selling momentum.Price appears to be compressing, hinting at a potential breakout.---🔸 4. Pattern ImplicationRounded Bottom / Base FormationThe curvature and projected path suggest a rounded bottom or accumulation pattern.Commonly seen before short-term bullish reversals.---🔸 5. Projection & StrategyBullish Bias:If price breaks above ~$3,335 with volume or momentum, a move to $3,360 looks probable.Conservative target = $3,355–$3,360Stop-loss (if trading): Below $3,300 (previous low)Bearish Invalidator:A strong breakdown below the pink support zone ($3,290) would invalidate the bullish thesis and open downside risk.---✅ SummaryCurrent sentiment: Cautiously bullishTechnical setup: Rounded bottom base near key supportTarget: $3,360 (short-term)Risk: Breakdown below $3,290 support
Disclaimer
Any content and materials included in Sahmeto's website and official communication channels are a compilation of personal opinions and analyses and are not binding. They do not constitute any recommendation for buying, selling, entering or exiting the stock market and cryptocurrency market. Also, all news and analyses included in the website and channels are merely republished information from official and unofficial domestic and foreign sources, and it is obvious that users of the said content are responsible for following up and ensuring the authenticity and accuracy of the materials. Therefore, while disclaiming responsibility, it is declared that the responsibility for any decision-making, action, and potential profit and loss in the capital market and cryptocurrency market lies with the trader.