Technical analysis by UmutTrades about Symbol KDA: Sell recommendation (4/25/2025)

UmutTrades
KDAUSDT | Be Cautious, Stay Adaptive
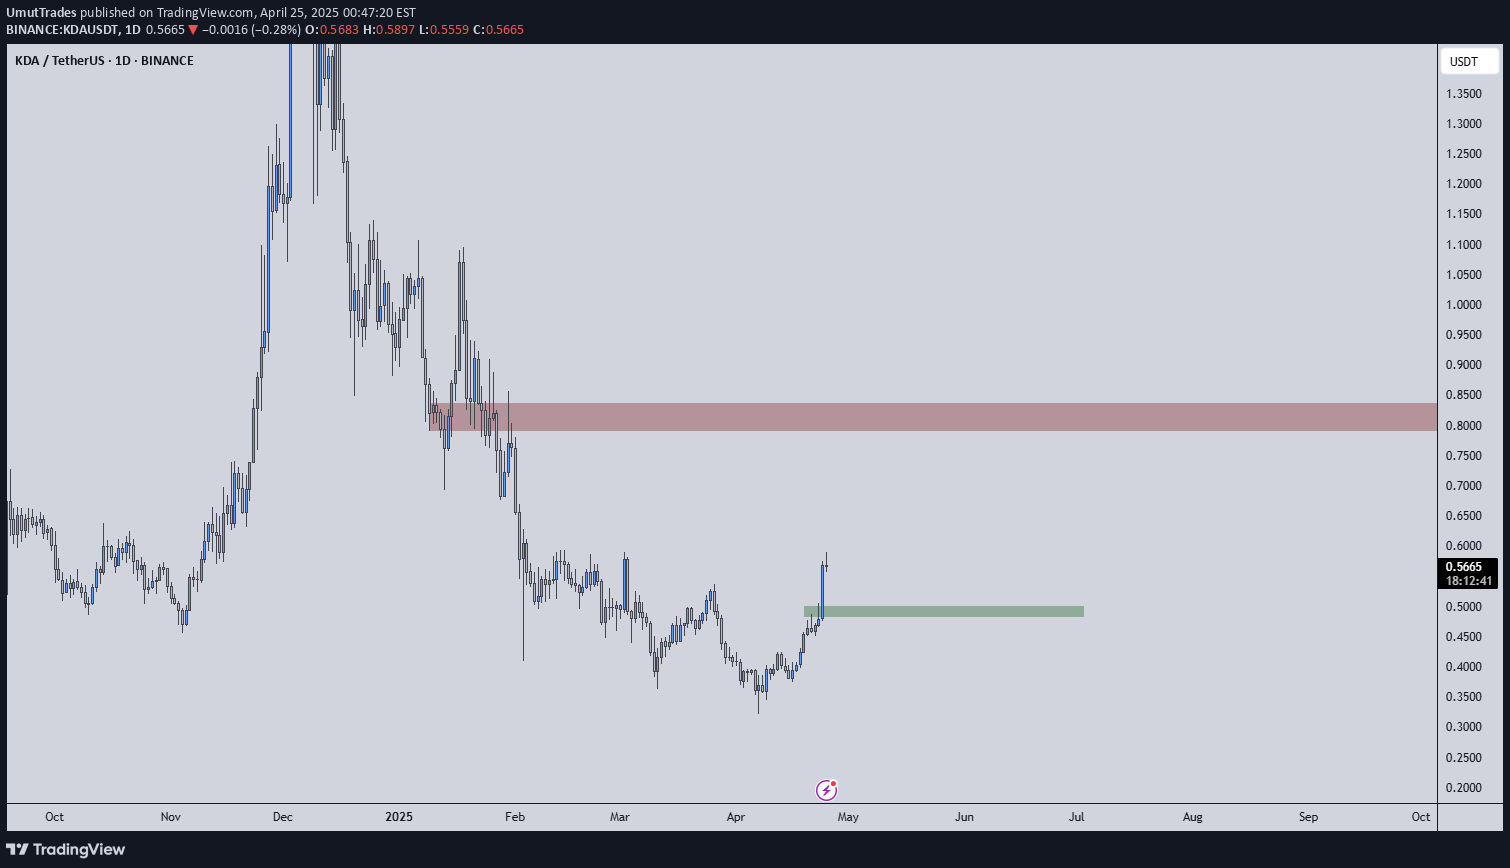
KDAUSDT has been navigating a tricky range, and structure seems to be shifting slowly. The red box below us now acts as a potential support area, while the green box above is shaping up to be a strong resistance zone that has halted price momentum before.🟥 Red Box – Support ZoneThis area has shown signs of buyer interest in the past. If price pulls back here and holds, it might offer a chance for a reactive bounce — especially if we see supportive signals like slowing sell volume or a low-timeframe breakout.🟩 Green Box – Resistance ZoneThe green box is a key level where sellers are currently defending. It's been tested before and failed to break cleanly, which means it’s not to be taken lightly. If you’re looking for shorts, this is the zone to watch for confirmation setups.✅ Trading OutlookShort bias from the green box with confirmation on lower timeframes. Let price enter the resistance and then look for weakness.Long bias from the red box only if buyers step in with strength. A strong bounce or a reclaim with a retest could offer a low-risk entry.Important Reminder: If either of these zones is broken and price consolidates above/below with strength, adapt accordingly. As always, I don’t insist on short ideas if the market structure shifts. If a resistance zone is reclaimed with strength, I flip to long.Let the chart tell the story, not your emotions.📌I keep my charts clean and simple because I believe clarity leads to better decisions.📌My approach is built on years of experience and a solid track record. I don’t claim to know it all but I’m confident in my ability to spot high-probability setups.📌If you would like to learn how to use the heatmap, cumulative volume delta and volume footprint techniques that I use below to determine very accurate demand regions, you can send me a private message. I help anyone who wants it completely free of charge.🔑I have a long list of my proven technique below:🎯 ZENUSDT.P: Patience & Profitability | %230 Reaction from the Sniper Entry🐶 DOGEUSDT.P: Next Move🎨 RENDERUSDT.P: Opportunity of the Month💎 ETHUSDT.P: Where to Retrace🟢 BNBUSDT.P: Potential Surge📊 BTC Dominance: Reaction Zone🌊 WAVESUSDT.P: Demand Zone Potential🟣 UNIUSDT.P: Long-Term Trade🔵 XRPUSDT.P: Entry Zones🔗 LINKUSDT.P: Follow The River📈 BTCUSDT.P: Two Key Demand Zones🟩 POLUSDT: Bullish Momentum🌟 PENDLEUSDT.P: Where Opportunity Meets Precision🔥 BTCUSDT.P: Liquidation of Highly Leveraged Longs🌊 SOLUSDT.P: SOL's Dip - Your Opportunity🐸 1000PEPEUSDT.P: Prime Bounce Zone Unlocked🚀 ETHUSDT.P: Set to Explode - Don't Miss This Game Changer🤖 IQUSDT: Smart Plan⚡️ PONDUSDT: A Trade Not Taken Is Better Than a Losing One💼 STMXUSDT: 2 Buying Areas🐢 TURBOUSDT: Buy Zones and Buyer Presence🌍 ICPUSDT.P: Massive Upside Potential | Check the Trade Update For Seeing Results🟠 IDEXUSDT: Spot Buy Area | %26 Profit if You Trade with MSB 📌 USUALUSDT: Buyers Are Active + %70 Profit in Total🌟 FORTHUSDT: Sniper Entry +%26 Reaction🐳 QKCUSDT: Sniper Entry +%57 Reaction📊 BTC.D: Retest of Key Area Highly Likely📊 XNOUSDT %80 Reaction with a Simple Blue Box!📊 BELUSDT Amazing %120 Reaction!I stopped adding to the list because it's kinda tiring to add 5-10 charts in every move but you can check my profile and see that it goes on..