Technical analysis by AtresCryptoAcademy about Symbol CRV: Buy recommendation (4/24/2025)

AtresCryptoAcademy
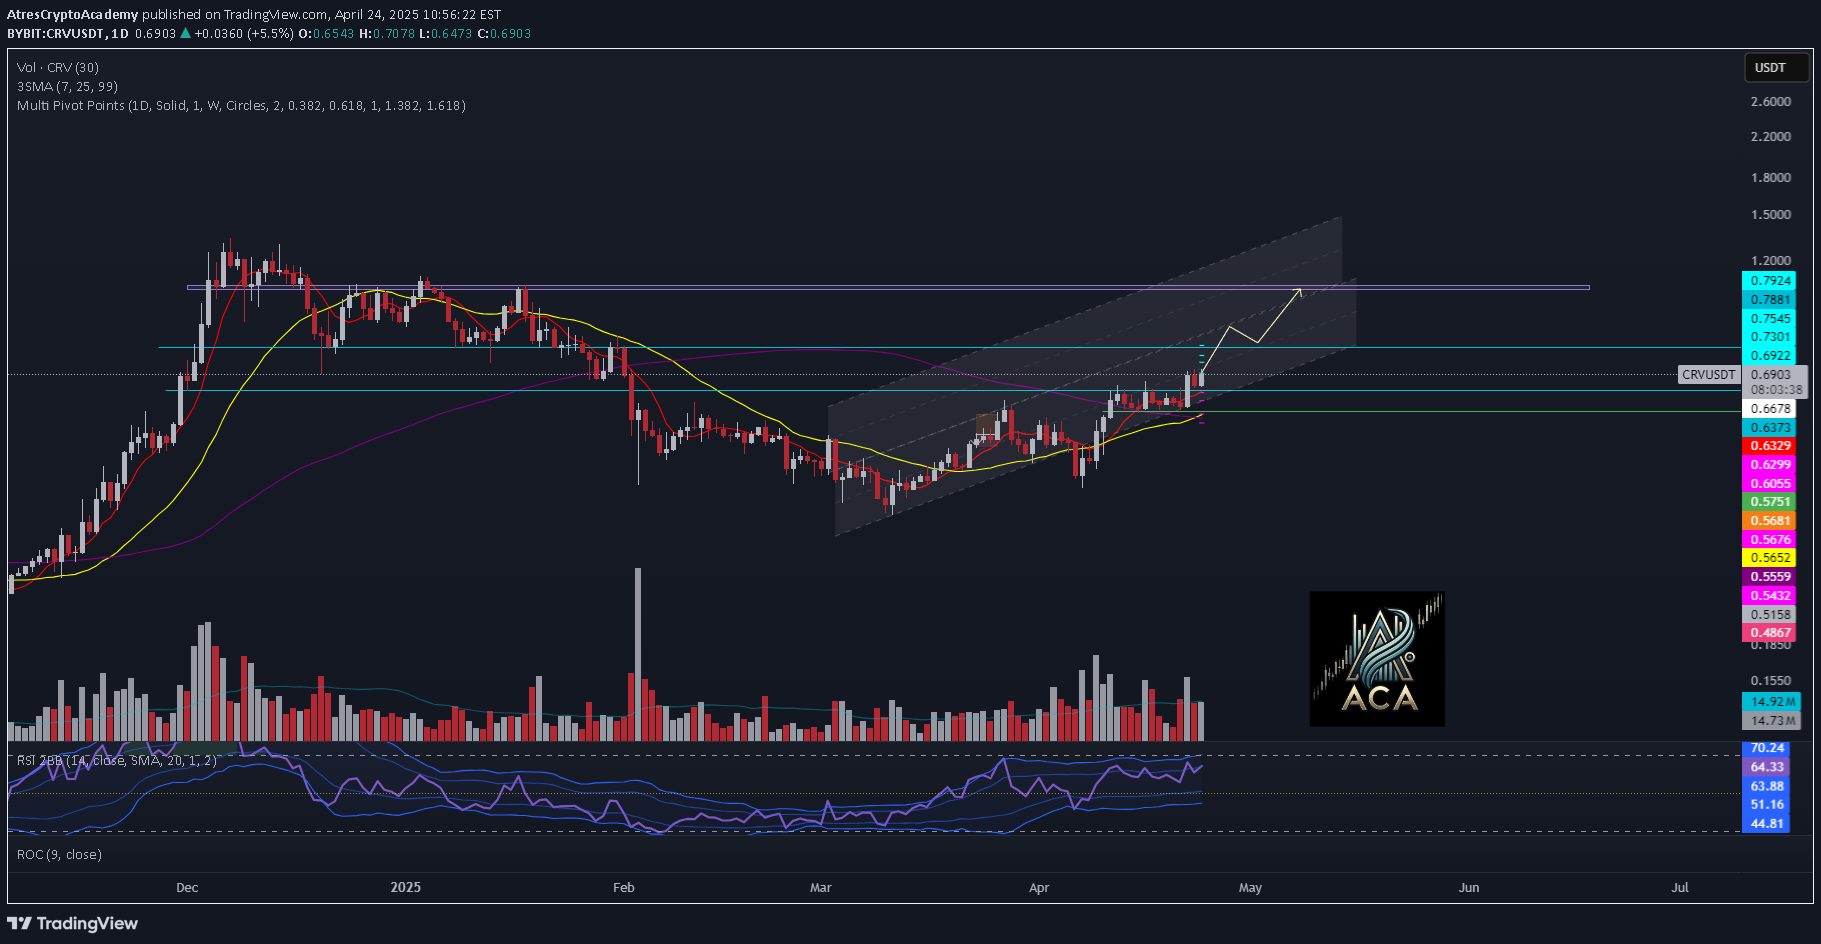
CRVUSDT 1D Chart Analysis | Bullish Momentum Signals & Moving Average Crossover🔍 Let’s break down the CRV/USDT daily chart and highlight the key technical factors setting up for a potential bullish move.⏳ Daily OverviewThe chart shows CRV breaking out of its previous downtrend and moving within a well-defined ascending channel. Notably, the 25-day moving average (yellow) has just crossed above the 99-day moving average (purple), a classic bullish crossover that often precedes strong upward trends.📈 Technical HighlightsThe 25 MA crossing above the 99 MA is a textbook bullish signal, suggesting that trend momentum is shifting in favor of buyers.RSI is currently near the overbought zone (around 70), indicating strong buying pressure. When RSI approaches these levels, it often leads to sharp candles and increased volatility, as momentum traders step in.Price has reclaimed the $0.6922 resistance and is targeting the $0.7545–$0.7924 zone, which aligns with the upper boundary of the channel.Volume is increasing during bullish moves, confirming that buyers are active and supporting the rally.🔺 Bullish TriggersIf CRV holds above $0.6922 and maintains momentum, a rally toward the $0.7545–$0.7924 resistance zone is likely. A clean breakout above this area could open the door for a move toward $1.00, especially if volume continues to rise and momentum stays strong.📊 Key Levels to WatchSupport: $0.6678 / $0.6377Resistance: $0.7545 / $0.7924Bullish confirmation: Daily close above $0.7924🚨 ConclusionCRVUSDT is showing strong bullish signals with the moving average crossover and rising momentum. RSI near the overbought zone suggests that sharp candles and further upside are possible, but also be prepared for volatility and quick moves. Watch for bullish triggers above resistance and monitor volume for confirmation.#CRV #CryptoAnalysis #TradingView #Altcoins #ACA
