Technical analysis by Cryptobillionairesss about Symbol ETH: Buy recommendation (2/5/2025)

Cryptobillionairesss
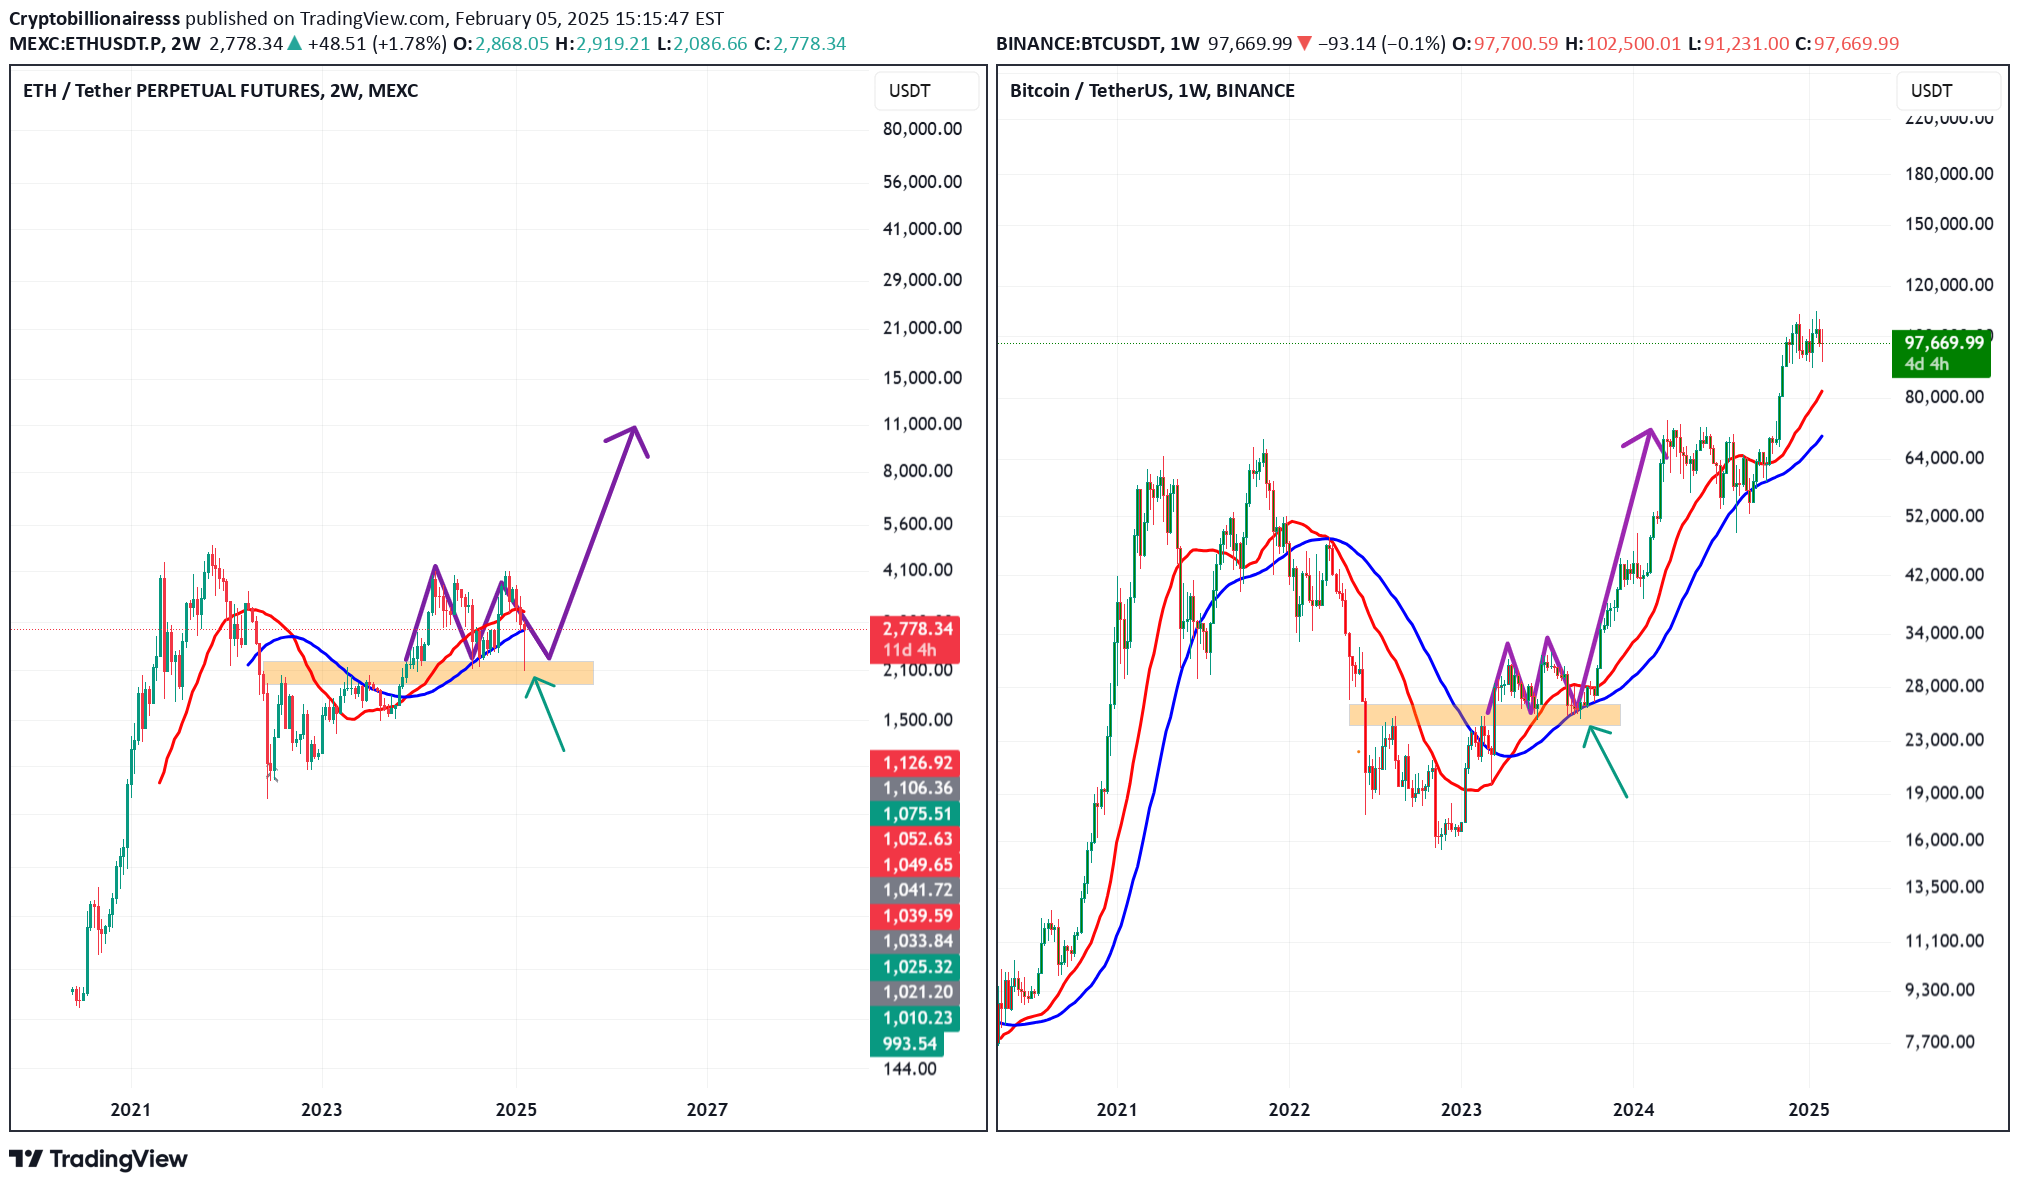
You see the Bitcoin chart on the weekly timeframe on the right, which we posted two and a half years ago (telegram channel) And we said it would be the start of the Bitcoin pump up, and it did! Now you see the Ethereum chart on the left, on the two-weekly timeframe, with the same pattern! What it takes is to suffer in this area for a while and then move. In fact, this Ethereum range is the most important range among all market charts. Whether the price is high or low determines many things. I have been checking the charts for a few days. The old patterns of almost all altcoins have been broken and the charts are terrible, which of course, in the case of altcoins, they can fake the disaster on the charts! But the two-weekly Ethereum chart is the only promising chart in the market that can turn the page. Now there is only one thing left, and that is to assume that my analysis is correct and Ethereum suffers above this range for a while and then starts moving. So, what could be the behavior of altcoins during this period when Ethereum is going to suffer above this range?
