
ZRO
LayerZero
| تریدر | نوع سیگنال | حد سود/ضرر | زمان انتشار | مشاهده پیام |
|---|---|---|---|---|
 Crypto4lightRank: 692 | خرید | حد سود: تعیین نشده حد ضرر: تعیین نشده | 12/16/2025 | |
 CryptoAnalystSignalRank: 30996 | خرید | حد سود: تعیین نشده حد ضرر: تعیین نشده | 12/24/2025 |
Price Chart of LayerZero
سود 3 Months :
سیگنالهای LayerZero
Filter
Sort messages by
Trader Type
Time Frame
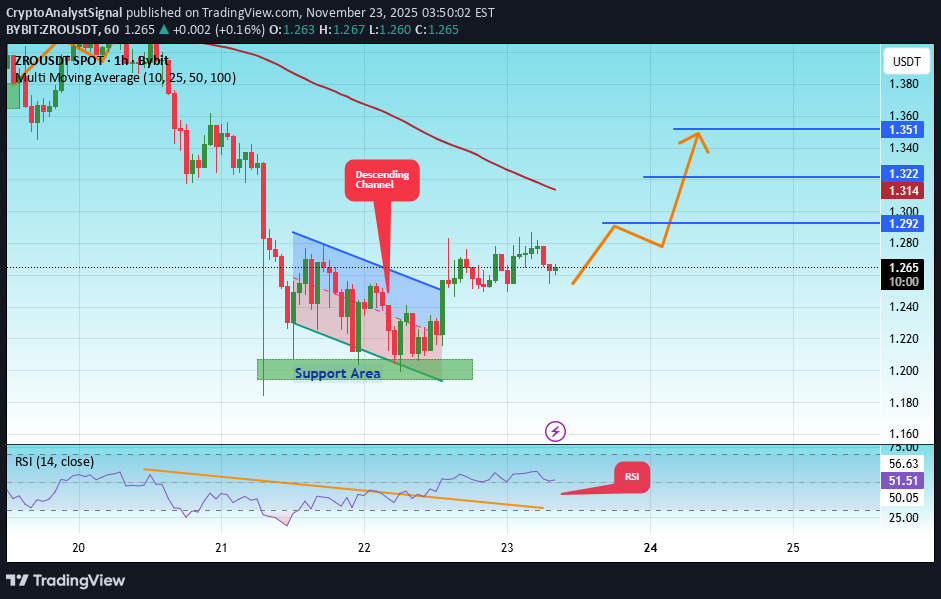
CryptoAnalystSignal
#ZRO/USDT could be another strong contender

#ZRO The price is moving in a descending channel on the 1-hour timeframe. It has reached the lower boundary and is heading towards breaking above it, with a retest of the upper boundary expected. We have a downtrend on the RSI indicator, which has reached near the lower boundary, and an upward rebound is expected. There is a key support zone in green at 1.24. The price has bounced from this zone multiple times and is expected to bounce again. We have a trend towards consolidation above the 100-period moving average, as we are moving close to it, which supports the upward movement. Entry price: 1.26 First target: 1.28 Second target: 1.32 Third target: 1.36 Don't forget a simple principle: money management. Place your stop-loss below the support zone in green. For any questions, please leave a comment. Thank you.

Crypto-by-PRIME
ضعف ZRO و فرصت خرید در ناحیه $1.24: آیا صعود تا $1.50 ممکن است؟
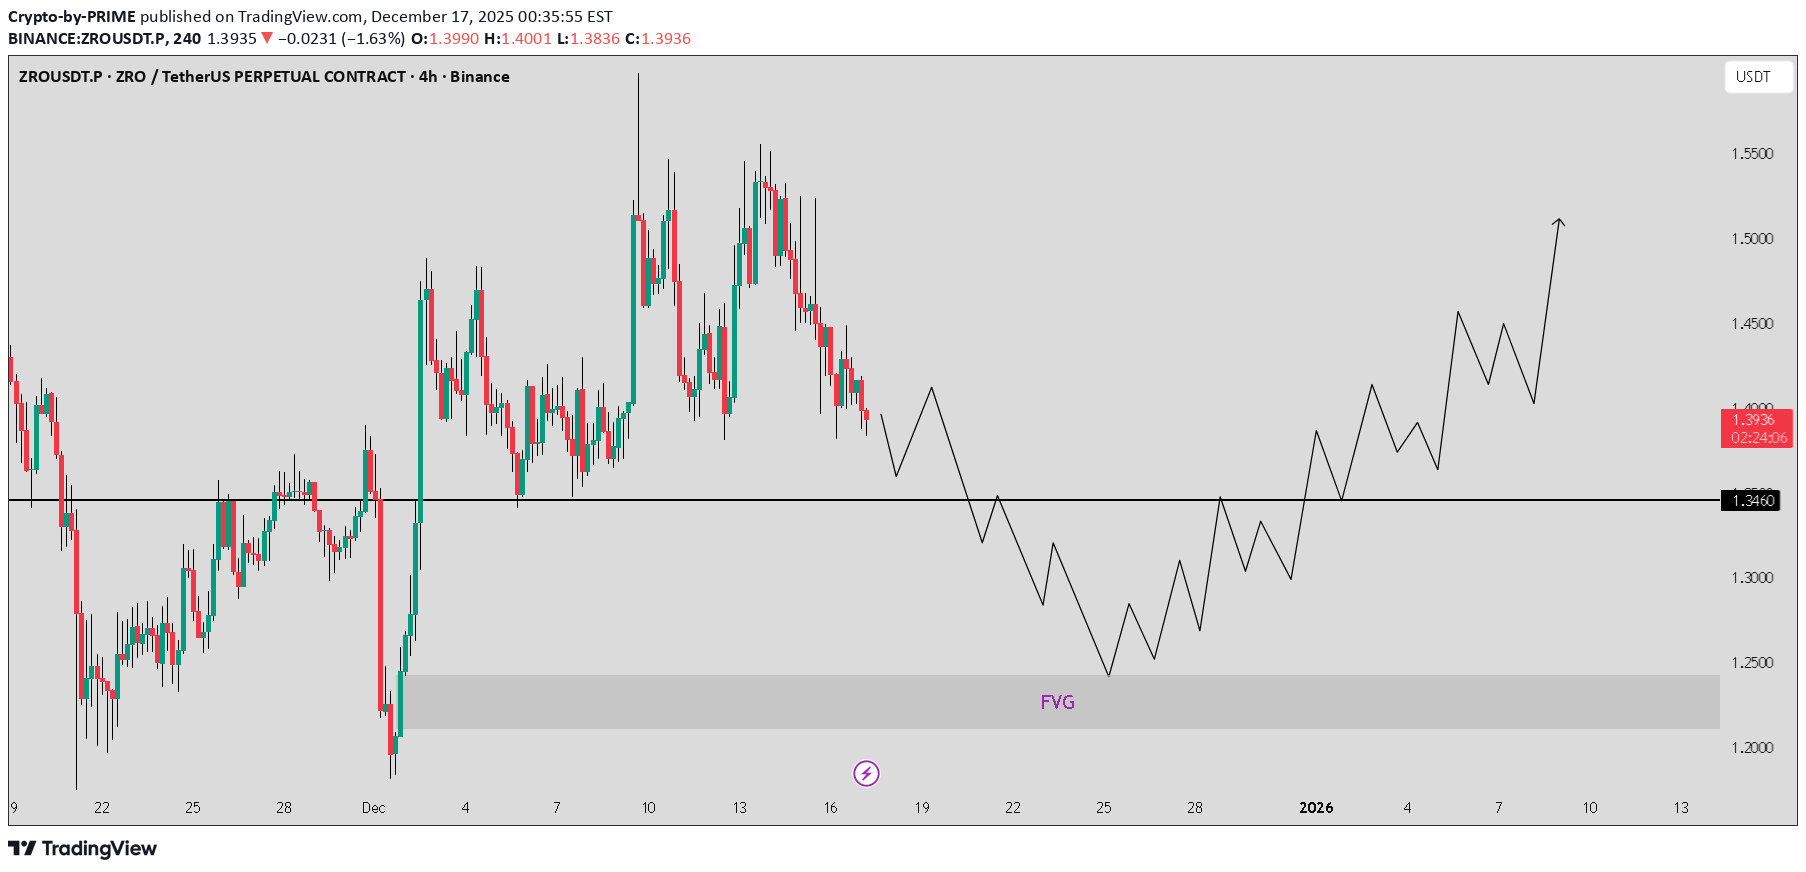
ZRO / USDT is showing weakness and continues to decline toward the 4H FVG zone at $1.24–$1.21. This area will be important to watch for a potential reaction. If price shows strength from this FVG, a reversal toward $1.50 can follow. Manage risk wisely and wait for confirmation.ZRO / USDT moved exactly as expected after our call and declined steadily into the FVG zone. Price is now showing a reaction from this area, which could lead to a good upward move. A breakdown below the FVG will invalidate this setup, so manage risk accordingly.
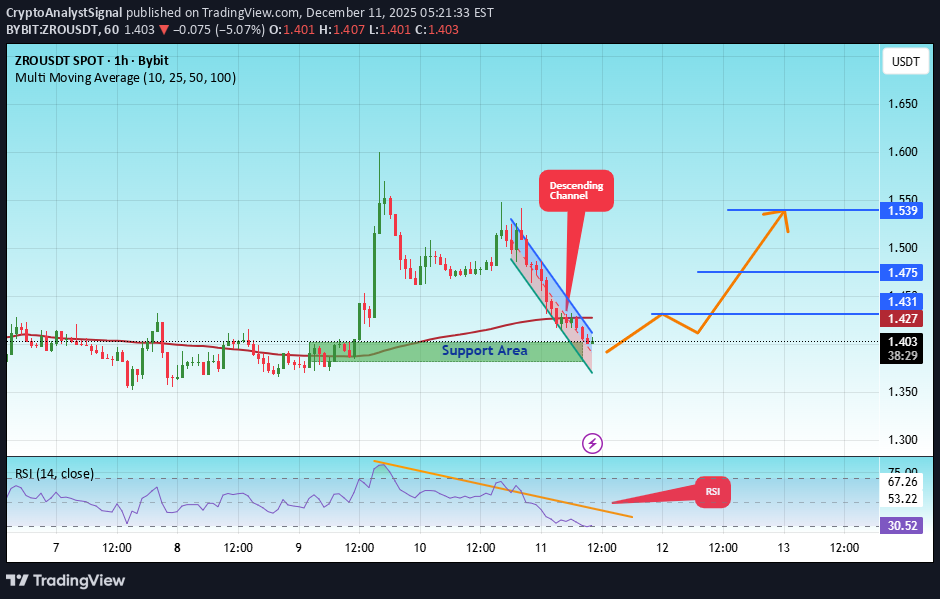
CryptoAnalystSignal
#ZRO/USDT could be another strong contender
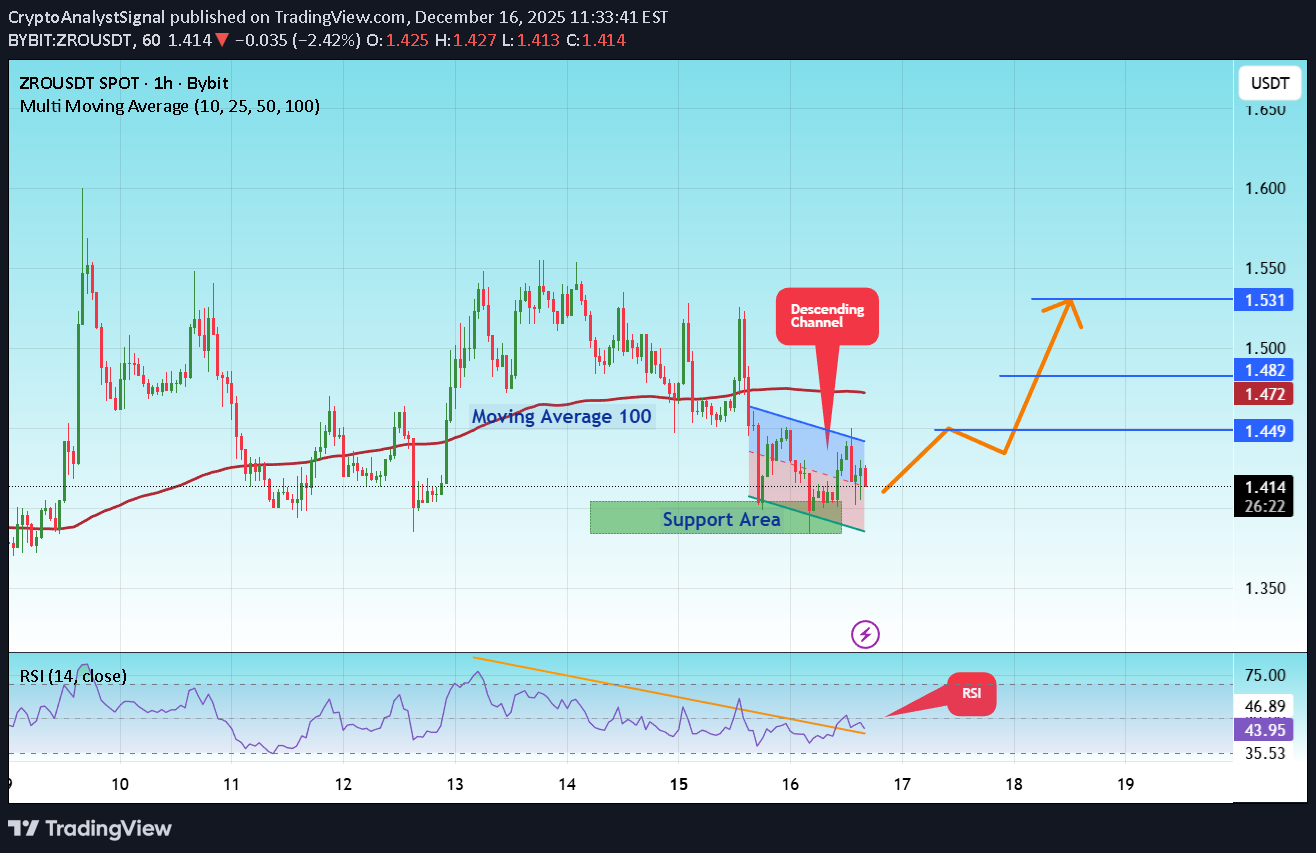
#ZRO The price is moving in a descending channel on the 1-hour timeframe. It has reached the lower boundary and is heading towards a breakout, with a retest of the upper boundary expected. We are seeing a bearish bias in the Relative Strength Index (RSI), which has reached near the lower boundary, and an upward bounce is expected. There is a key support zone in green at 1.39, and the price has bounced from this level several times. Another bounce is expected. We are seeing a trend towards stabilizing above the 100-period moving average, which we are approaching, supporting the upward trend. Entry Price: 1.41 First Target: 1.45 Second Target: 1.48 Third Target: 1.53 Remember a simple principle: Money Management. Place your stop-loss order below the green support zone. For any questions, please leave a comment. Thank you.
Crypto4light
ZRO Post-Listing Power: Retest Accumulation & Bullish Breakout
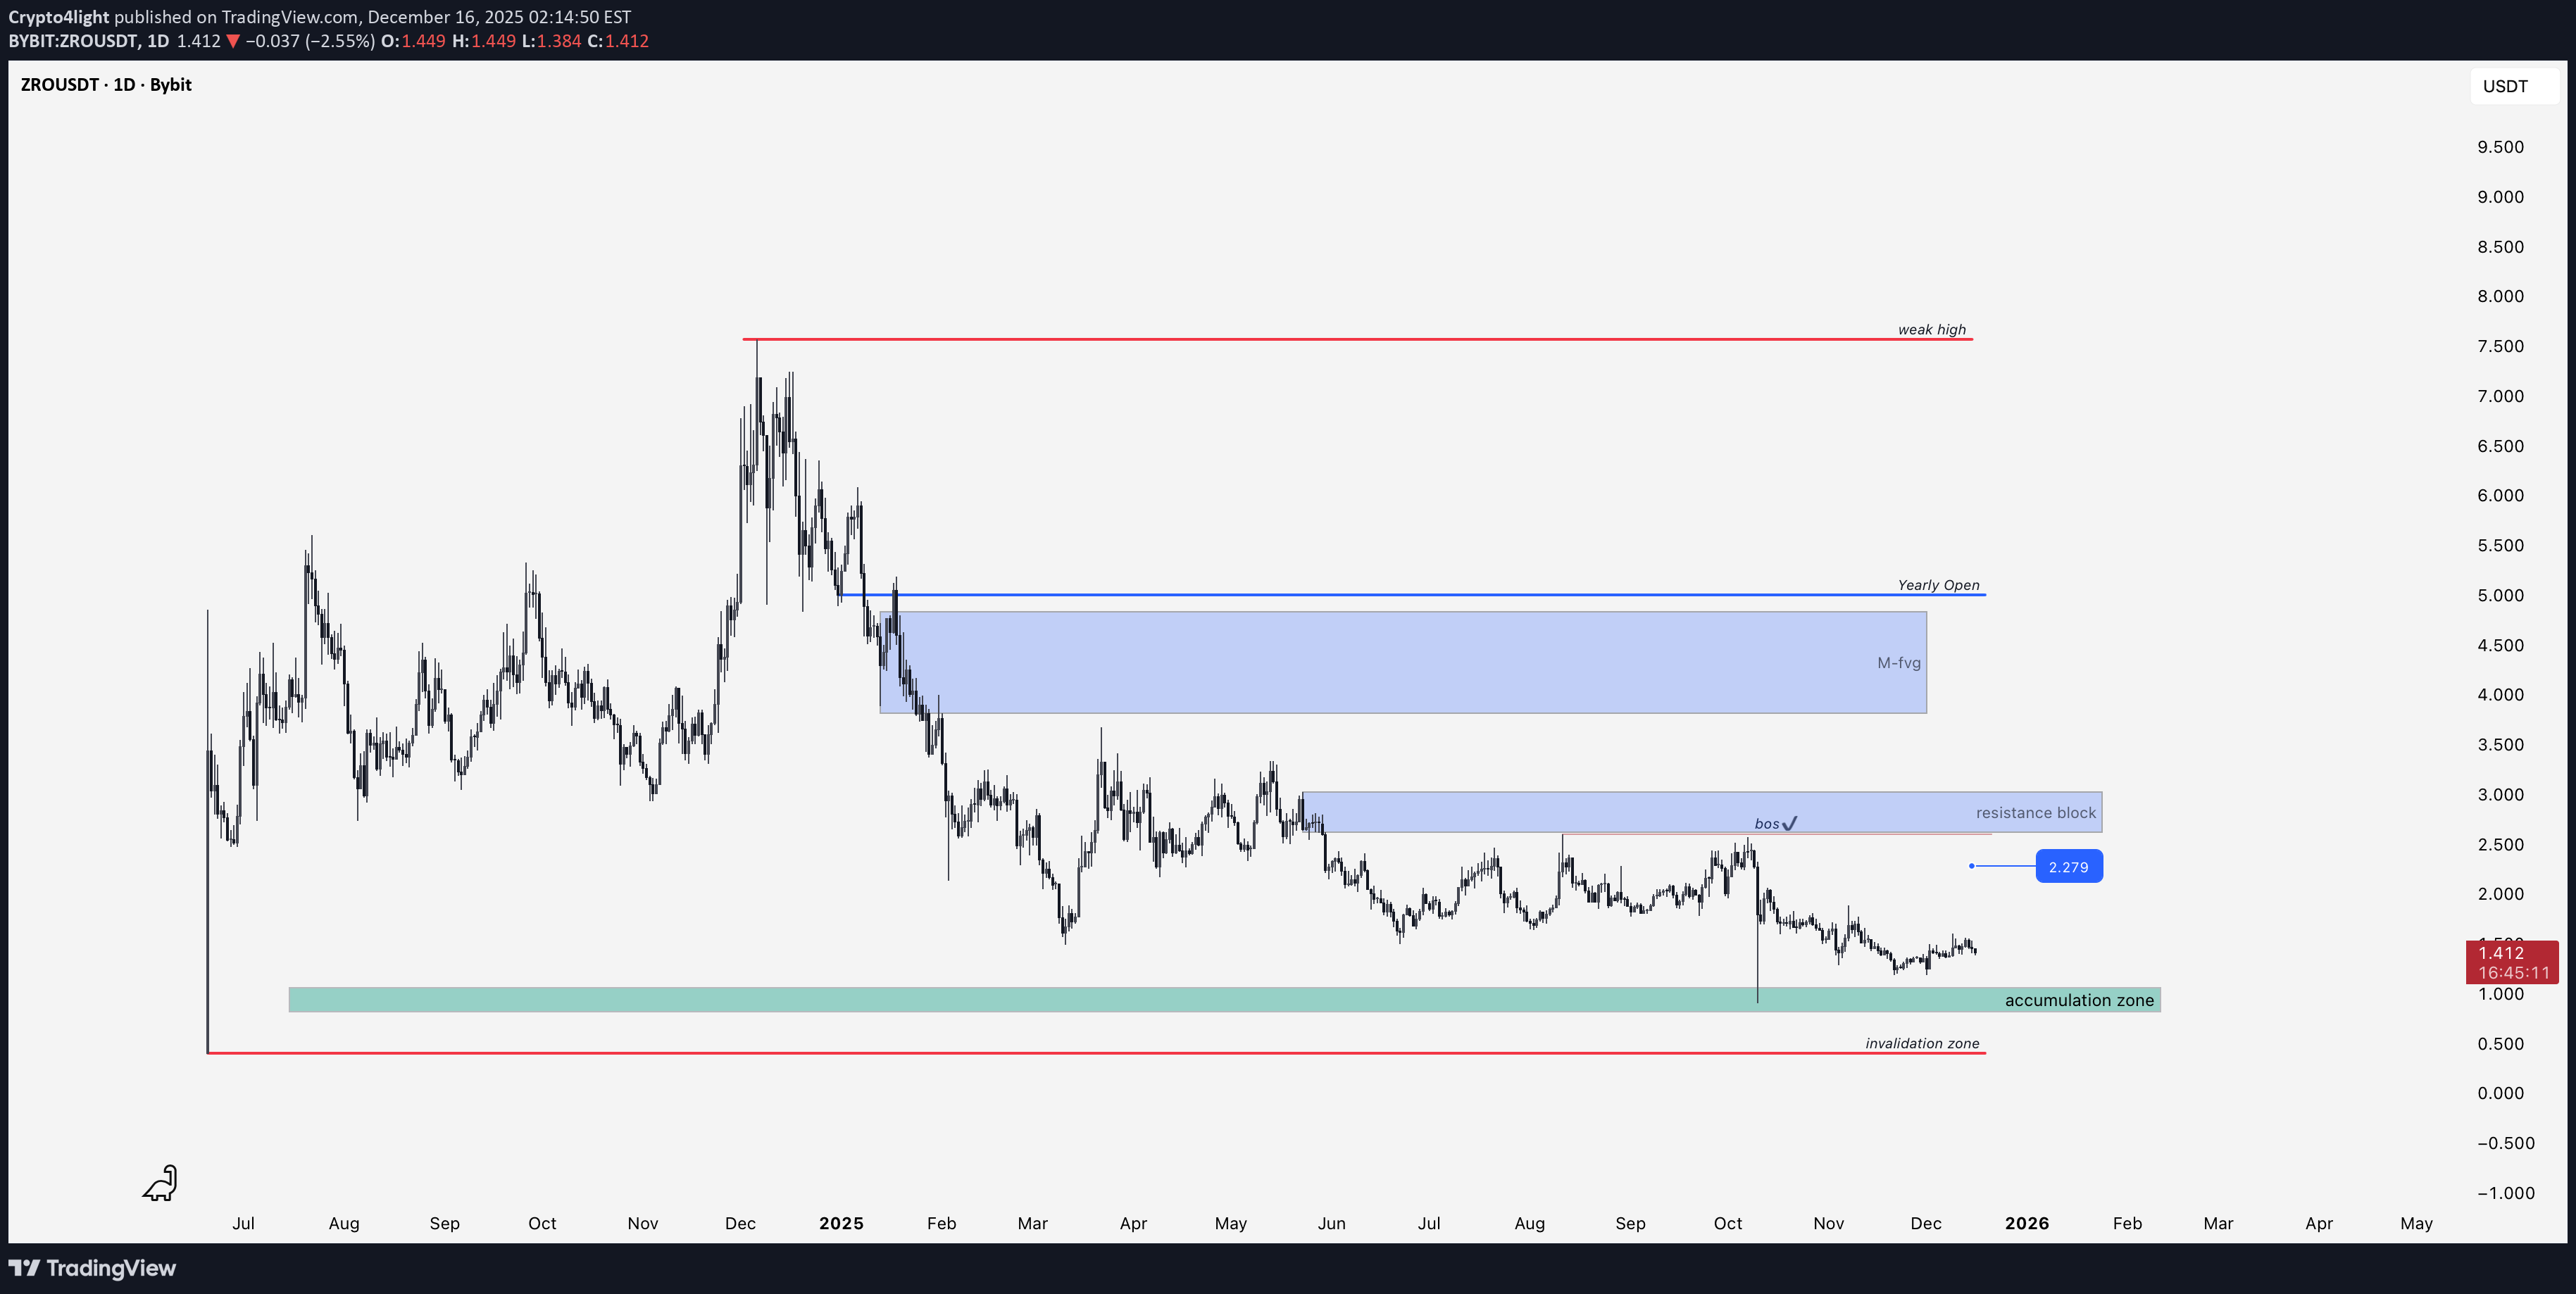
ZRO looks pretty decent after the listing compared to the charts of tokens that were added to exchanges at the same time! ZROUSDT Technically, we've reached the Initiation Accumulation Distribution phase up to the last accumulation zone! But it's always profitable to start DCA here. Invalidation of the idea if the price goes below the listing price! Locally, I ideally expect a retest of the accumulation zone followed by an upward movement to the resistance block and a structure break on the daily timeframe! The next targets will be the monthly imbalance and the opening of 2025! Upon reaching these targets, it will be relevant to update the idea!

ZROUSDT Chart Anlaysis W 13-Dec-25
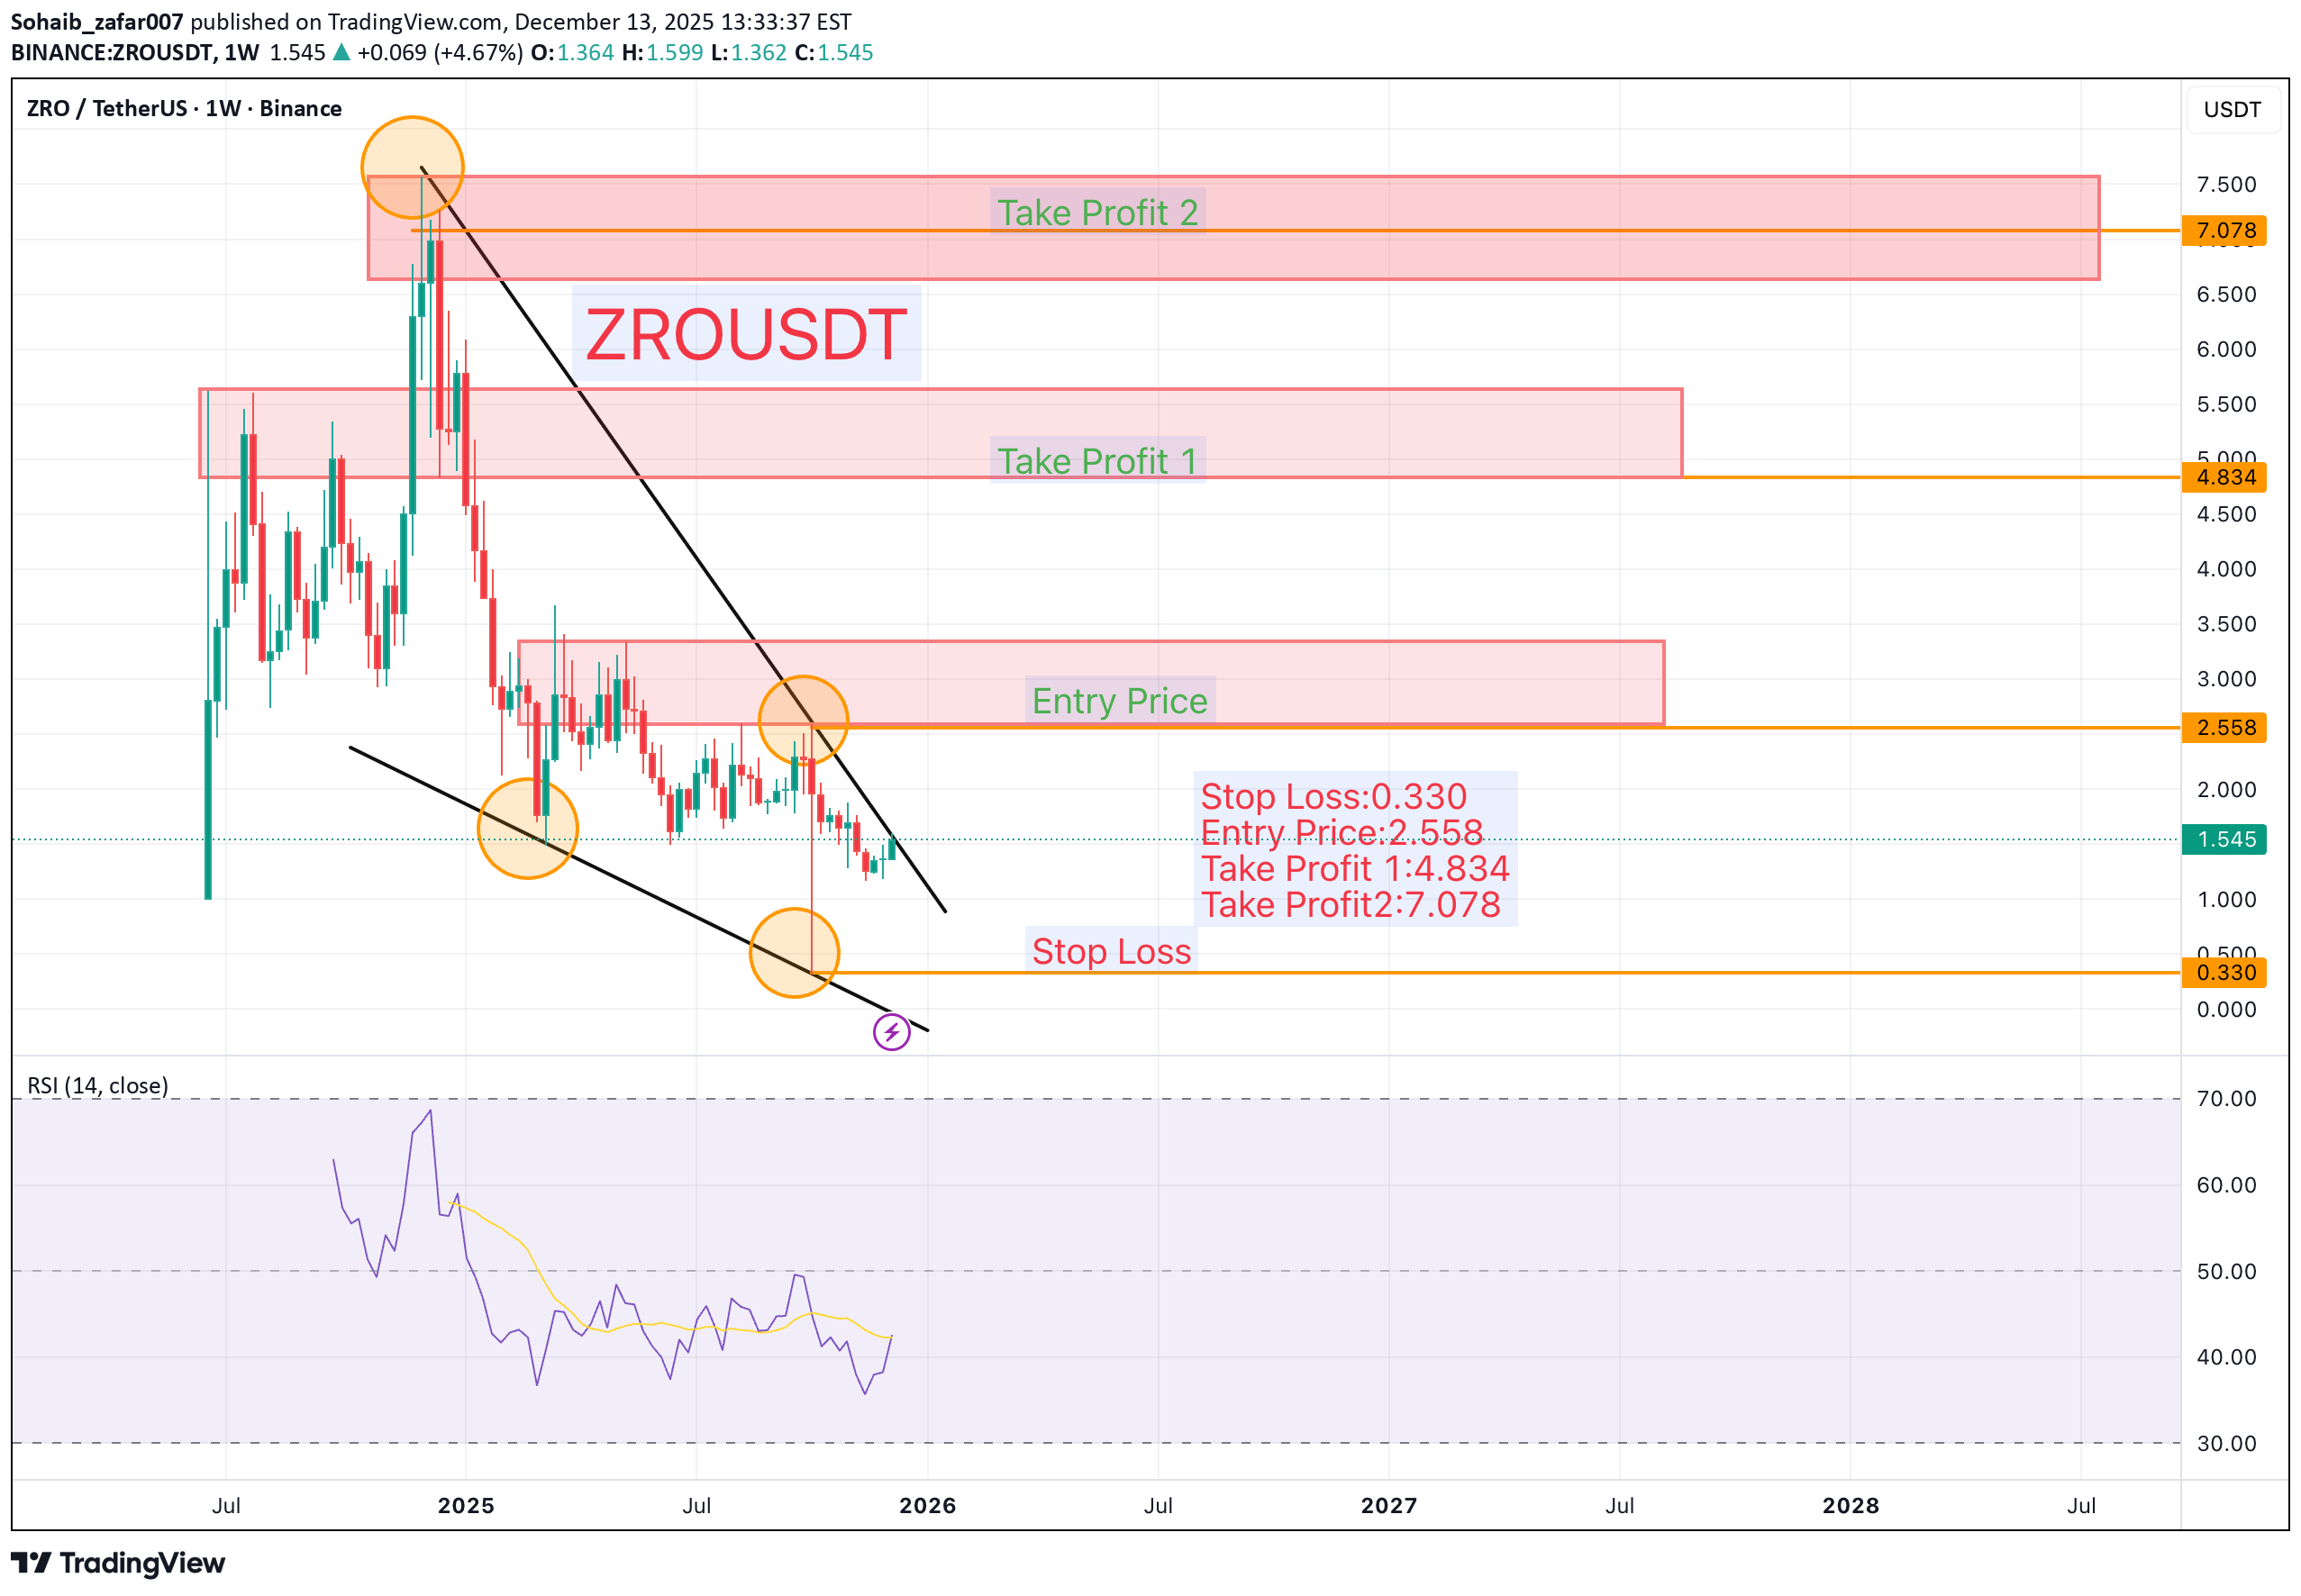
Stop Loss: 0.330 Entry Price: 2.558 Take Profit 1: 4.834 Take Profit 2: 7.078 On the weekly chart, a Falling Wedge pattern has formed, indicating a potential shift in trend from bearish to bullish. The suggested entry is at 2.558, with expectations for the price to move toward the projected take-profit levels at 4.834 and 7.078 as bullish momentum develops. ⚠️ Always remember to protect your capital with a proper stop-loss and disciplined risk management.
CryptoAnalystSignal
#ZRO/USDT could be another strong contender
#ZRO The price is moving in a descending channel on the 1-hour timeframe. It has reached the lower boundary and is heading towards breaking above it, with a retest of the upper boundary expected. We have a downtrend on the RSI indicator, which has reached near the lower boundary, and an upward rebound is expected. There is a key support zone in green at 1.33. The price has bounced from this zone multiple times and is expected to bounce again. We have a trend towards consolidation above the 100-period moving average, as we are moving close to it, which supports the upward movement. Entry price: 1.40 First target: 1.43 Second target: 1.47 Third target: 1.54 Don't forget a simple principle: money management. Place your stop-loss below the support zone in green. For any questions, please leave a comment. Thank you.#ZRO First target: 1.43 Reached Second target: 1.47 Reached Third target: 1.54 Reached
CryptoAnalystSignal
#ZRO/USDT could be another strong contender

#ZRO The price is moving in a descending channel on the 1-hour timeframe. It has reached the lower boundary and is heading towards breaking above it, with a retest of the upper boundary expected. We have a downtrend on the RSI indicator, which has reached near the lower boundary, and an upward rebound is expected. There is a key support zone in green at 1.33. The price has bounced from this zone multiple times and is expected to bounce again. We have a trend towards stability above the 100-period moving average, as we are moving close to it, which supports the upward movement. Entry price: 1.40 First target: 1.43 Second target: 1.48 Third target: 1.53 Don't forget a simple principle: money management. Place your stop-loss below the green support zone. For any questions, please leave a comment. Thank you.#ZRO First target: 1.43 Reached Second target: 1.48 Reached Third target: 1.53 Reached

Bithereum_io
سیگنال خرید ZRO: شکست مقاومت و اهداف صعودی جدید در نمودار روزانه!
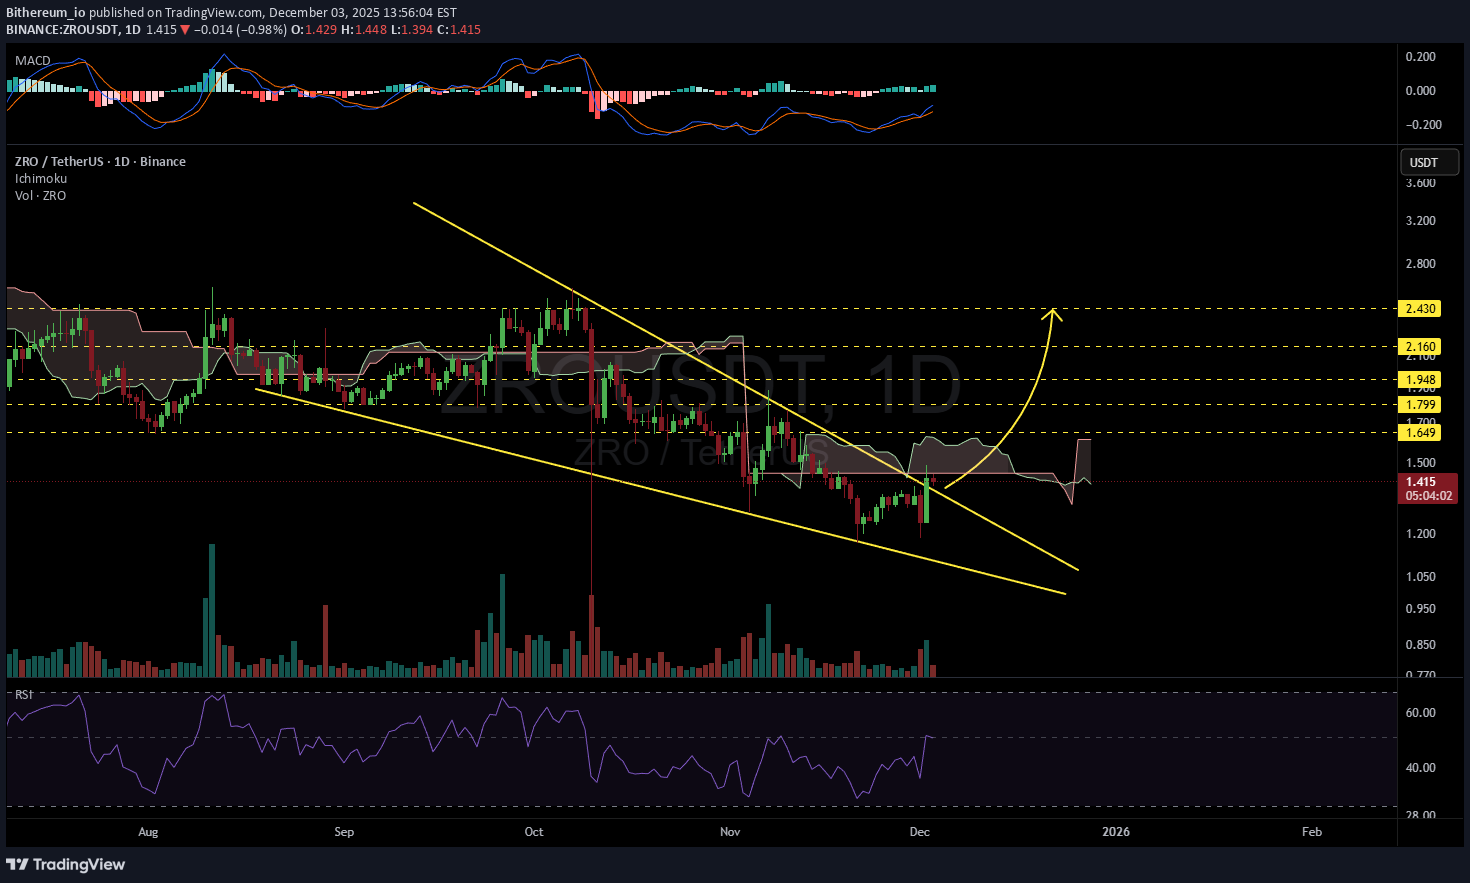
#ZRO has broken above the falling wedge resistance on the daily chart. It has been rejected from the Ichimoku cloud and is now pulling back to retest the wedge. In case of a successful retest — in other words, a bounce — we can expect the following targets: 🎯 $1.649 🎯 $1.799 🎯 $1.948 🎯 $2.160 🎯 $2.430 If the price fails to bounce, it may drop back inside the wedge and consolidate there for a while. We need to see where the daily candle closes. ⚠️ Always remember to use a tight stop-loss and maintain proper risk management.
CryptoAnalystSignal
تحلیل شگفتانگیز ZRO/USDT: آماده جهش بزرگ در کانال صعودی!
#ZRO The price is moving within an ascending channel on the 1-hour timeframe and is adhering to it well. It is poised to break out strongly and retest the channel. We have a downtrend line on the RSI indicator that is about to break and retest, which supports the upward move. There is a key support zone in green at the 1.20 price, representing a strong support point. We have a trend of consolidation above the 100-period moving average. Entry price: 1.26 First target: 1.29 Second target: 1.32 Third target: 1.35 Don't forget a simple money management rule: Place your stop-loss order below the green support zone. Once you reach the first target, save some money and then change your stop-loss order to an entry order. For any questions, please leave a comment. Thank you.#ZRO First target: 1.29 Reached Second target: 1.32 Reached#ZRO First target: 1.29 Reached Second target: 1.32 Reached Third target: 1.35 Reached
CryptoAnalystSignal
پیشبینی انفجاری ZRO/USDT: آماده شکست کانال صعودی و جهش به اوج!

#ZRO The price is moving within an ascending channel on the 1-hour timeframe and is adhering to it well. It is poised to break out strongly and retest the channel. We have a downtrend line on the RSI indicator that is about to break and retest, which supports the upward move. There is a key support zone in green at the price of 1.36, representing a strong support point. We have a trend to stabilize above the 100-period moving average. Entry price: 1.38 First target: 1.41 Second target: 1.50 Third target: 1.50 Don't forget a simple money management rule: Place your stop-loss order below the support zone in green. Once you reach the first target, save some money and then change your stop-loss order to an entry order. For any questions, please leave a comment. Thank you.
Disclaimer
Any content and materials included in Sahmeto's website and official communication channels are a compilation of personal opinions and analyses and are not binding. They do not constitute any recommendation for buying, selling, entering or exiting the stock market and cryptocurrency market. Also, all news and analyses included in the website and channels are merely republished information from official and unofficial domestic and foreign sources, and it is obvious that users of the said content are responsible for following up and ensuring the authenticity and accuracy of the materials. Therefore, while disclaiming responsibility, it is declared that the responsibility for any decision-making, action, and potential profit and loss in the capital market and cryptocurrency market lies with the trader.