
ZBCN
Zebec Network
| تریدر | نوع سیگنال | حد سود/ضرر | زمان انتشار | مشاهده پیام |
|---|---|---|---|---|
No results found. | ||||
Price Chart of Zebec Network
سود 3 Months :
سیگنالهای Zebec Network
Filter
Sort messages by
Trader Type
Time Frame

Mike-BTD
آیا ZBCN آماده انفجار است؟ سطوح کلیدی خرید و احتمال بازگشت قیمت
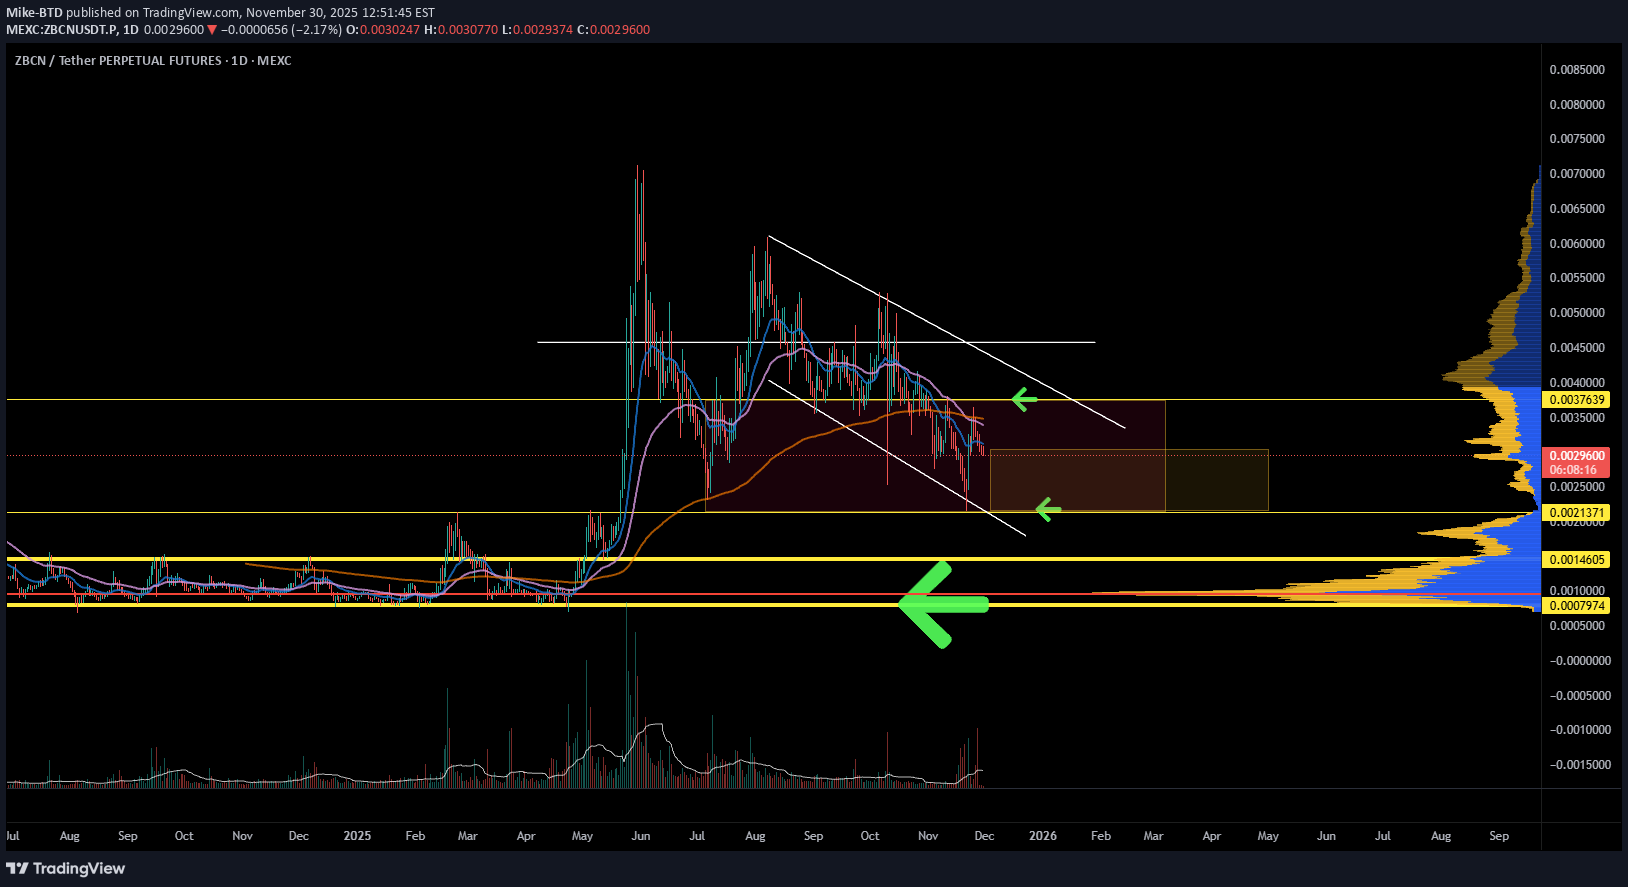
ZBCN continues to drift inside a clear descending channel, but price is now pressing into a major historical demand zone backed by strong VPVR support. Key points: • The macro downtrend is still intact, but sellers are losing momentum as price approaches the lower range. • Multiple demand bands sit below, with the largest liquidity shelf aligned with the long-term accumulation zone that previously triggered strong reversals. • Momentum indicators are bottomed out and beginning to turn. • Prior oversold signals in this region have resulted in significant upside moves. • Money flow and momentum are stabilizing. What I’m watching: A sweep or retest of the lower yellow zone could be the final accumulation opportunity before a trend shift. A breakout above the descending trendline would confirm a momentum reversal. Risk remains while price trades inside the channel, but the reward profile improves the deeper it moves into support. The accumulation area is clear. The reversal depends on how price reacts here.

AlvinDeo96
تثبیت موقعیت خرید: فرصت سودآوری پس از اصلاح حجم در محدوده قیمتی!
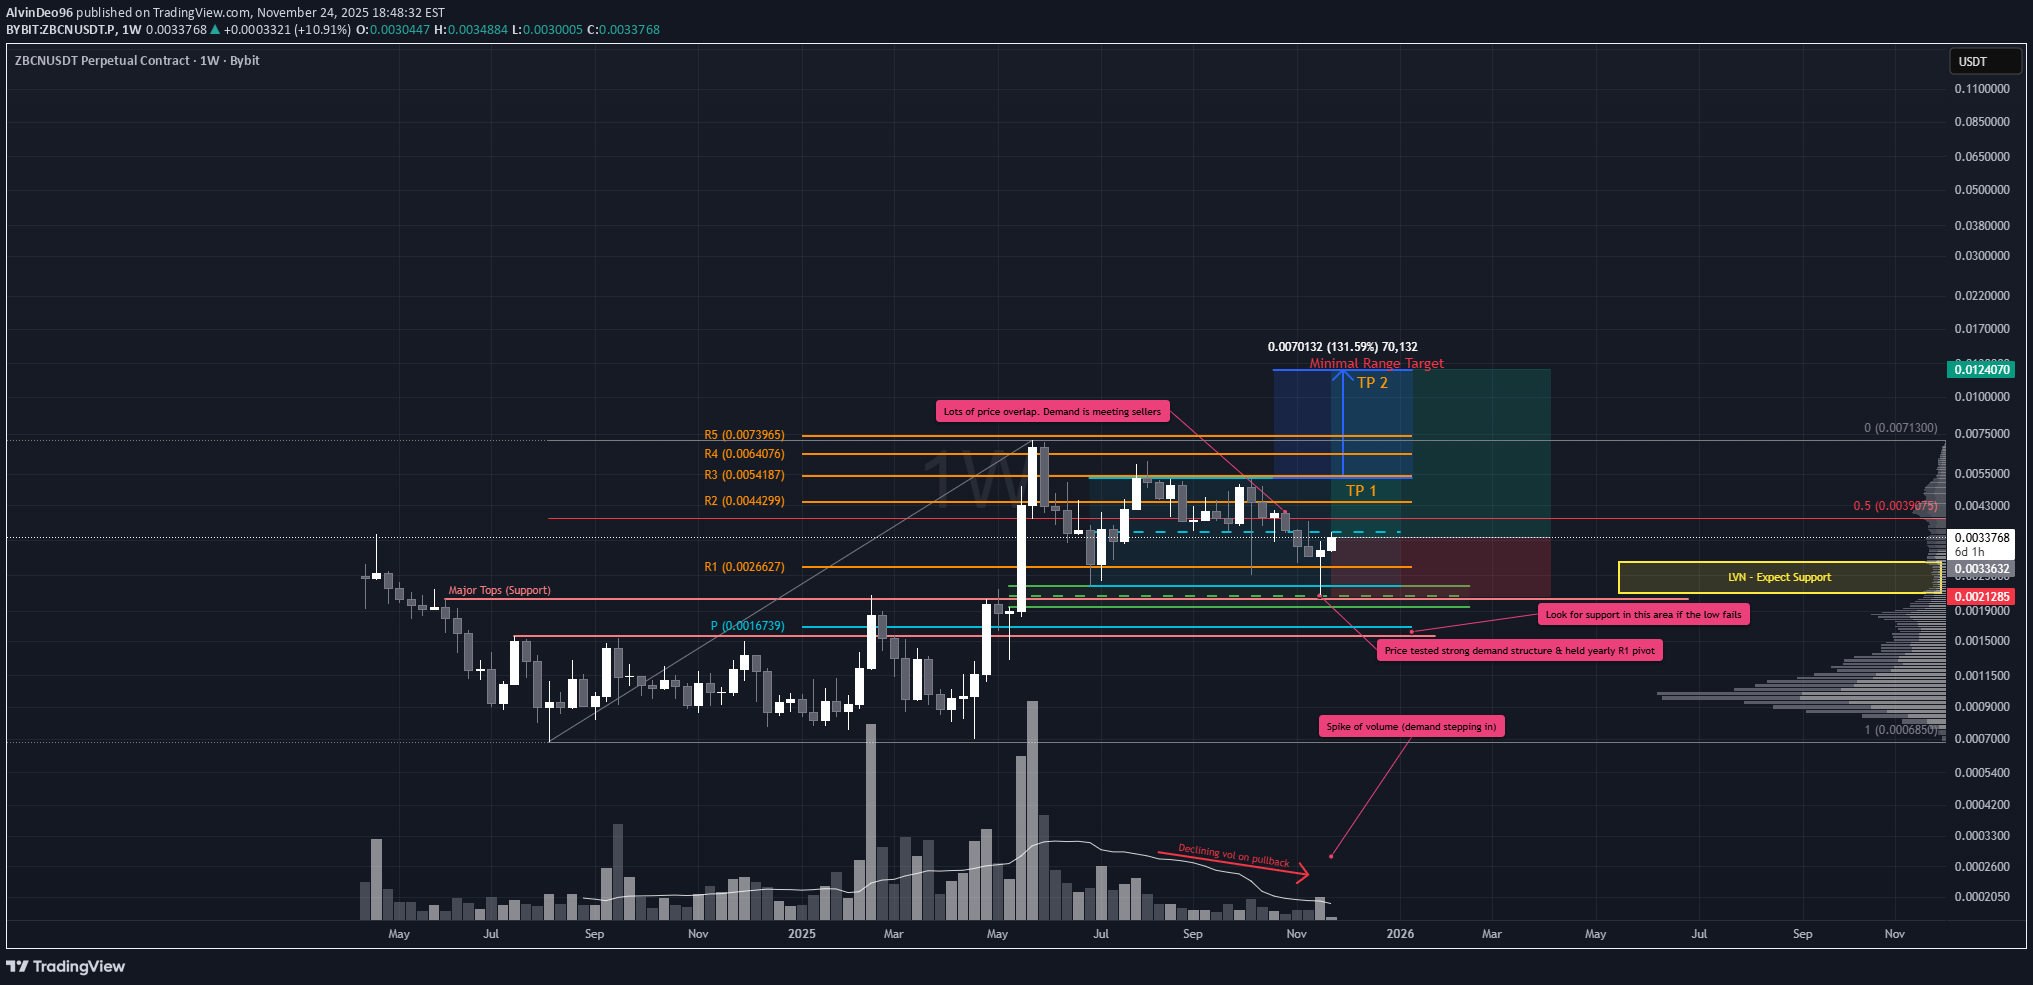
ZBCN looking very clean here. After breaking out of the range, price has retraced roughly 70% back toward the range tops. Despite the heavy bearish sentiment across crypto, the chart structure is telling a different story. The pullback shows declining volume with overlapping price action, a classic sign of buyers quietly absorbing supply. In the week ending 23 November, price drove sharply into a key support zone before closing back inside the range. The weekly candle printed a bullish hammer on elevated volume, signaling potential strength. Yes, further downside is always possible if sellers return with conviction, but right now the setup is constructive. Trade Scenario • Entry: Position can be initiated here. • Stop Loss (SL): Use the hammer candle low as invalidation. • If that level fails, look for the next major support highlighted on the chart. • Take Profit (TP): • First target: range tops. • Trail SL as price moves, aiming for a full 100% range extension. Reminder: No setup is guaranteed. Risk management is non‑negotiable. Protect capital first, profits second.
StudyGuideTA
ایردراپ رایگان ZBCN: پول جادویی اینترنتی، تحلیل تکنیکال و گام بعدی قیمت!
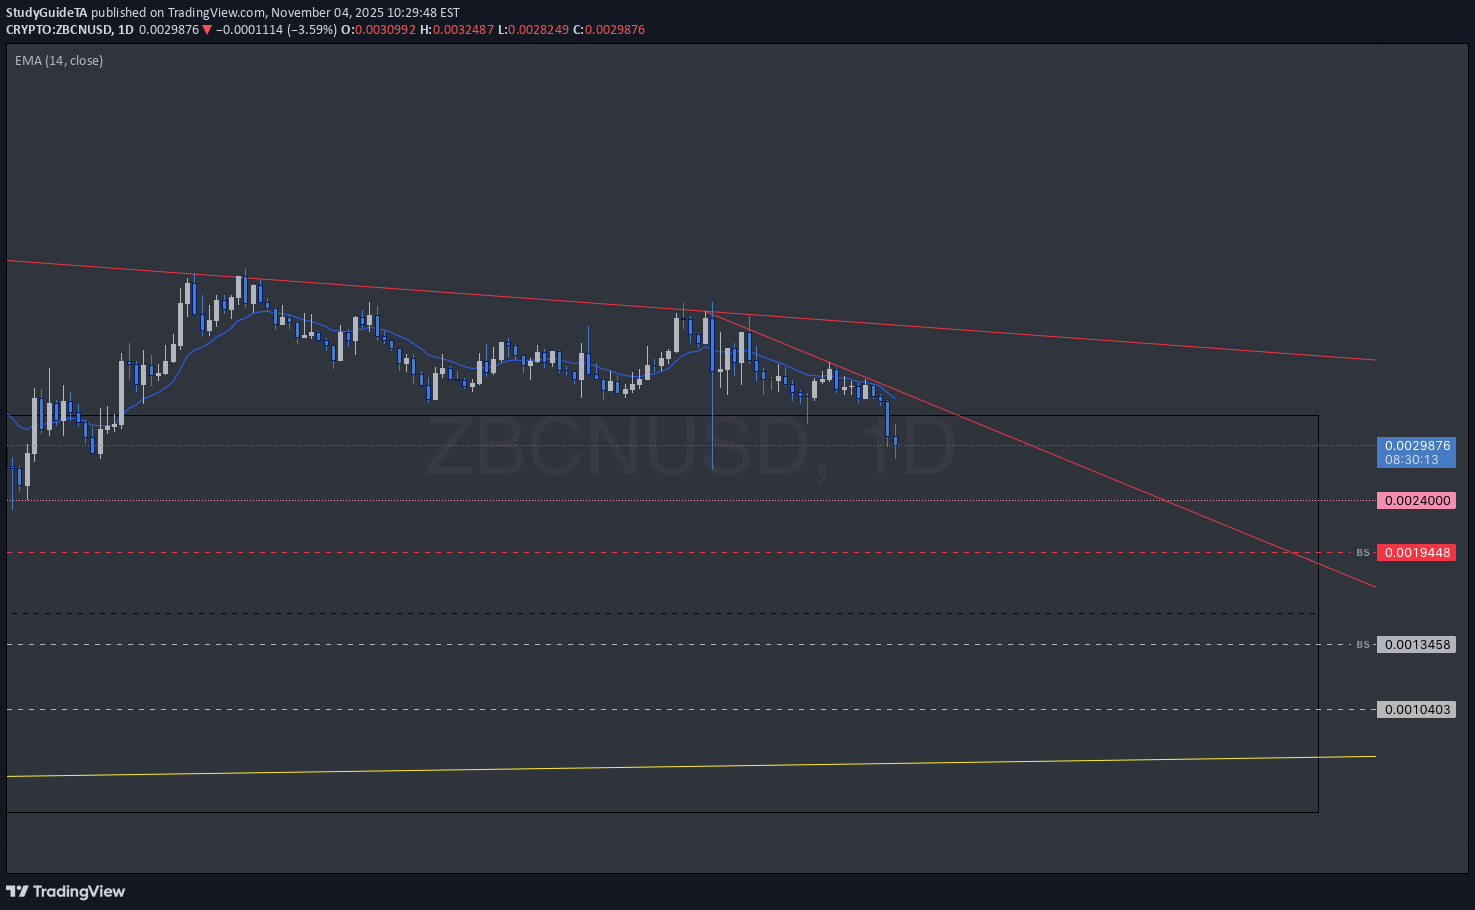
I'm guessing a lot of people just received ZBCN and another crypto airdropped into their digital wallet. the fundamentals are fun to look at and see the innovation and creativity of the new age of finance but without looking at all that, the chart always speaks volumes. Remember Voice over I.P. address (VOIP)? well, crypto is Money over I.P address aka magic internet money. Just as VOIP brought spam calls and messages, crypto will bring spam money. This spam money is airdropped into wallets usually based upon which layer 1 assets the wallet holds and the quantity or date of asset custody. Any parameter can be programmed I guess but to all who received free magic internet money, congratulations. we can look at the company distributing their crypto and support them or sell the asset for something we do want to support. T.A explained - BS & FS levels are expected support when dashed lines, tested when dotted and resistance when solid lines. The inverse is true for the Inv. BS Inv. FS levels, they are resistance as dashed lines, tested as dotted and support as solid lines. Monthly timeframe is color pink weekly grey daily is red 4hr is orange 1hr is yellow 15min is blue 5min is green if they are shown. strength favors the higher timeframe. 2x dotted levels are origin levels where trends have or will originate. When trends break, price will target the origin of the trend. its math, when the trend breaks, the vertex breaks too so the higher timeframe level/trend that breaks, the more volatility there could be as strength in the orders flow in to fuel the move. 13 minutes ago Trade closed manually price followed the candle science and timeframes from the 5min green levels to the weekly grey level. Price has left behind some inverse frontside and inverse backside candles which look to be forming the bridge to flip the script if price manages to gain those levels and start accumulation. That liquidity will "unlock" and fuel price action. anyways, the next levels below are the weekly and monthly levels. I need to update & post the next chart on the daily and 4hr timeframes.

TheCryptoGoon
رمزگشایی سقوط وبسایت زبک: آیا زمان خرید فرارسیده است؟
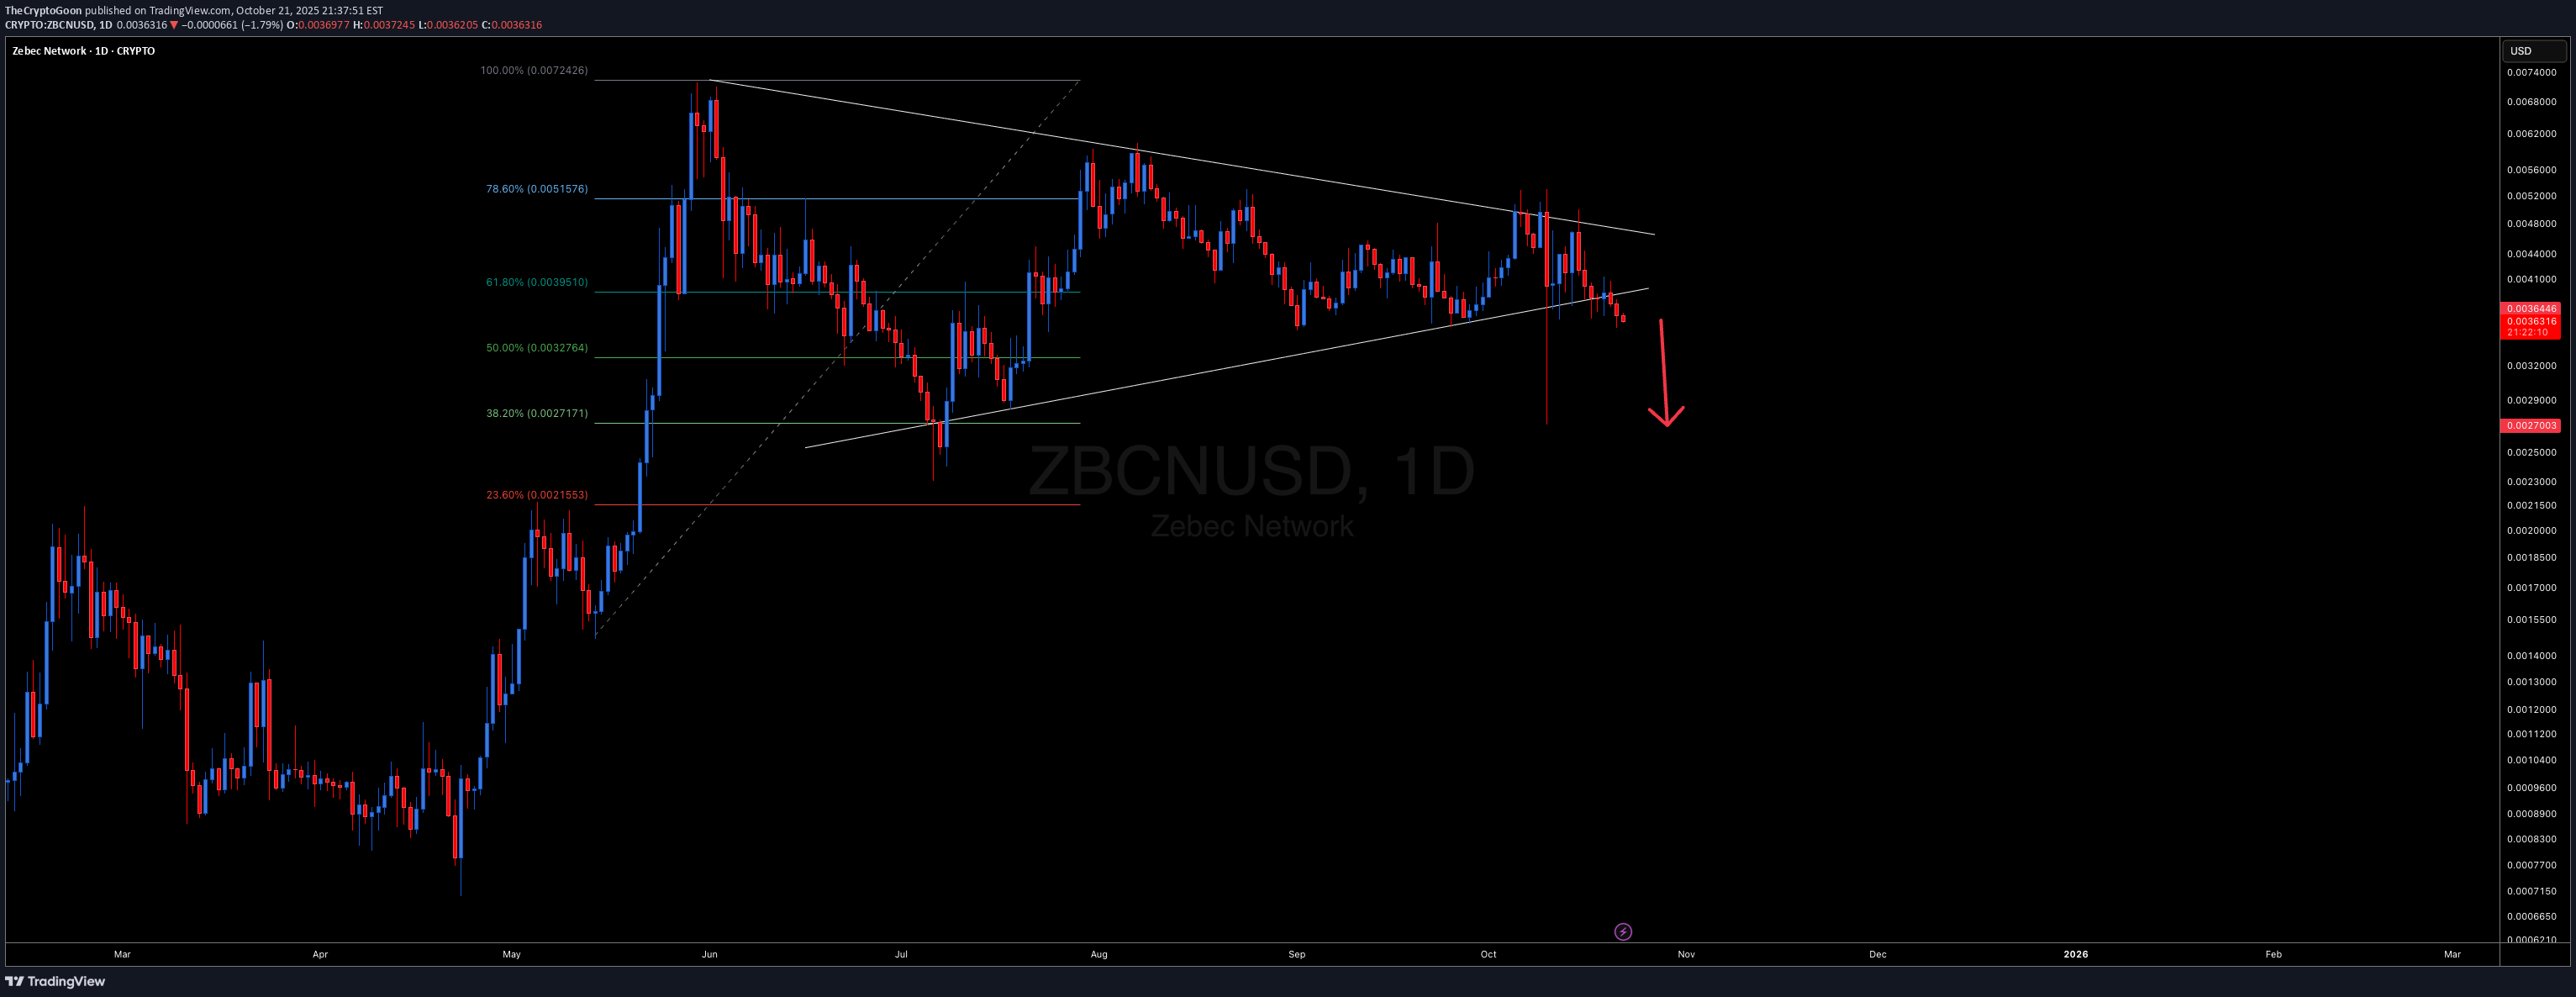
Zebec Network To Fill Crash Wick. Looking for a move down.

owoolcox1
خرید زبک (Zebec) در ۰.۰۰۳۹: فرصت استثنایی با پتانسیل سود ۱ به ۱۲!

Given the recent correction due to uncertainty regarding the future of trade with China and Trump's news driver [100% tariff starting Nov 1] bbc.com/news/articles/cn4wkd7729po Entry at 0.0039 Stop Loss at 0.0012 Exit at 0.0100 -Target is set at -3.5 Standard deviation from bullish daily orderblock at 0.0027- Please trade responsibly! Use proper risk and management. Bring stop loss to break even when 10% of target is achieved!

BeInCrypto
صعود خیرهکننده ZBCN: سیگنال قوی MACD نوید ادامه رشد بیشتر!

ZBCN the token powering the decentralized infrastructure (DePIN) protocol Zebec, has climbed 36% in the past week — emerging as one of the top-performing U.S.-based cryptocurrencies to watch. On the daily chart, technical indicators show promising momentum. The Moving Average Convergence Divergence (MACD) — a tool that measures the relationship between two moving averages of price to gauge trend strength and direction — shows the MACD line (blue) positioned above the signal line (orange). This bullish setup confirms the strength of ZBCN’s ongoing uptrend. If buying pressure sustains, the token could push further upward in the coming days.

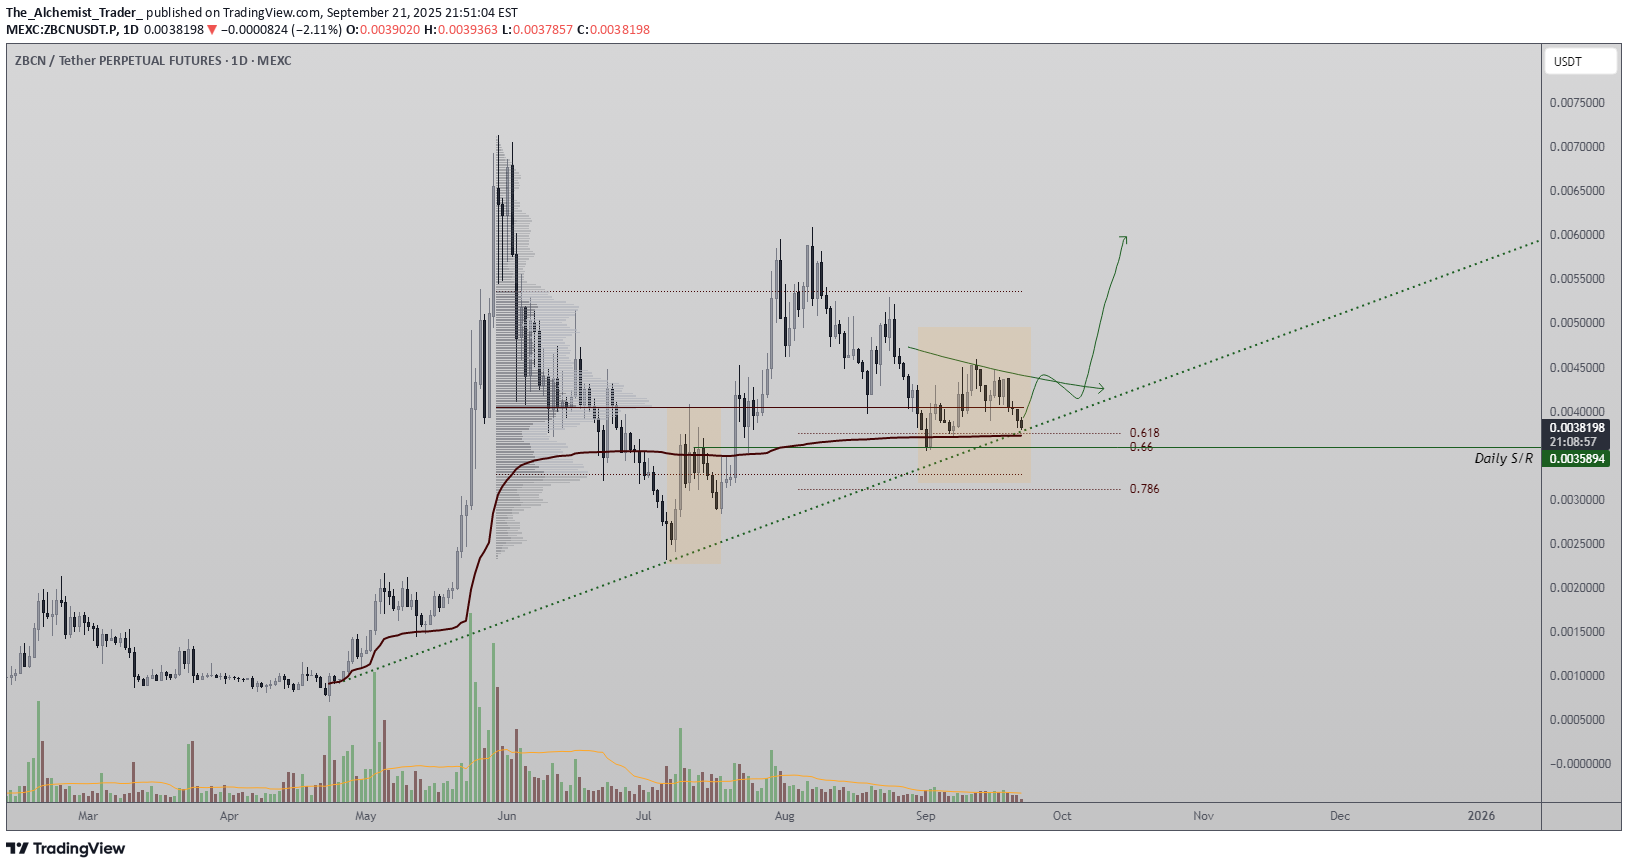
The_Alchemist_Trader_
ZBCN – Weekly Equilibrium Holds as Bulls Defend Support

ZBCN continues to consolidate within its weekly equilibrium, with price action forming higher lows and holding above dynamic support. Bulls remain in control as long as this structure is preserved. The asset remains locked within a tight apex structure on the weekly timeframe. This consolidation suggests that the market is preparing for a larger move, though the exact timing will likely require multiple weeks of development. Key Technical Points: - Weekly equilibrium pattern remains valid above dynamic support. - Price action is printing consecutive higher lows, reinforcing bullish structure. - Potential bounce expected from current levels into daily support before further rotation. ZBCN’s market structure remains healthy despite the lack of a confirmed breakout from the weekly equilibrium. The dynamic support level continues to provide a strong foundation, with each higher low acting as confirmation of bullish intent. Current price action suggests a bounce is forming, potentially targeting daily support before another rejection creates rotational movement. This type of consolidation is common during equilibrium phases, where market participants accumulate positions while awaiting a volatility expansion. The apex has yet to be resolved, meaning traders should remain patient as ZBCN builds its base. What to Expect in the Coming Price Action: If support levels hold, ZBCN is likely to continue forming higher lows and maintain its bullish equilibrium. A sustained breakout from the apex would confirm trend continuation, while a breakdown below dynamic support would invalidate the structure.

minno91
ZBCNUSDT – Possible Push Higher?

ZBCN is trending today, and momentum could drive the price higher. Where there’s hype, there’s often opportunity. Let’s keep an eye on price action and see how this plays out! 🚀

BlockChainJin
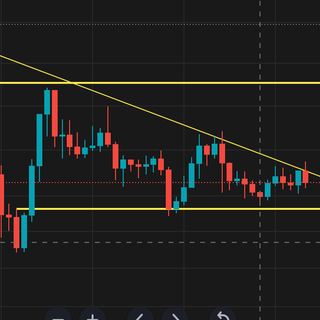
ZBCN breakout Descending channel!!

ZBCN bounced perfectly off the bottom trend line, breaking out of the descending channel, aiming to push toward the upper trend line.
The_Alchemist_Trader_
ZBCN Defends Daily Support, Reversal Still in Play
Despite corrective pressure, ZBCN has respected its critical daily support zone. The 0.618 Fibonacci level, point of control, and VWAP support all align here, creating a high-confluence region where bulls may reassert control. Key Technical Points - Daily Support Holding: Price remains above key confluence. - Support Confluence: 0.618 Fibonacci + VWAP + point of control. - Risk Scenario: Losing this region risks deeper correction. The correction into this zone is technically healthy, as long as support holds. Consecutive higher lows remain intact, reinforcing the uptrend. However, should this region break, price could face significant downside. The VWAP slicing through the Fibonacci retracement adds weight to this level, historically known for bullish reactions. A reversal from here would maintain market structure and could rotate price higher. What to Expect ZBCN is at a critical pivot. A rebound keeps the bullish structure alive, but a breakdown risks further correction. Traders should watch volume inflows to confirm reversal strength.
Disclaimer
Any content and materials included in Sahmeto's website and official communication channels are a compilation of personal opinions and analyses and are not binding. They do not constitute any recommendation for buying, selling, entering or exiting the stock market and cryptocurrency market. Also, all news and analyses included in the website and channels are merely republished information from official and unofficial domestic and foreign sources, and it is obvious that users of the said content are responsible for following up and ensuring the authenticity and accuracy of the materials. Therefore, while disclaiming responsibility, it is declared that the responsibility for any decision-making, action, and potential profit and loss in the capital market and cryptocurrency market lies with the trader.