
WAVES
Waves
| تریدر | نوع سیگنال | حد سود/ضرر | زمان انتشار | مشاهده پیام |
|---|---|---|---|---|
No results found. | ||||
Price Chart of Waves
سود 3 Months :
سیگنالهای Waves
Filter
Sort messages by
Trader Type
Time Frame

Saitamasignal
سیگنال خرید فوری WAVES/USDT: اهداف صعودی و حد ضرر (با لوریج 6X)
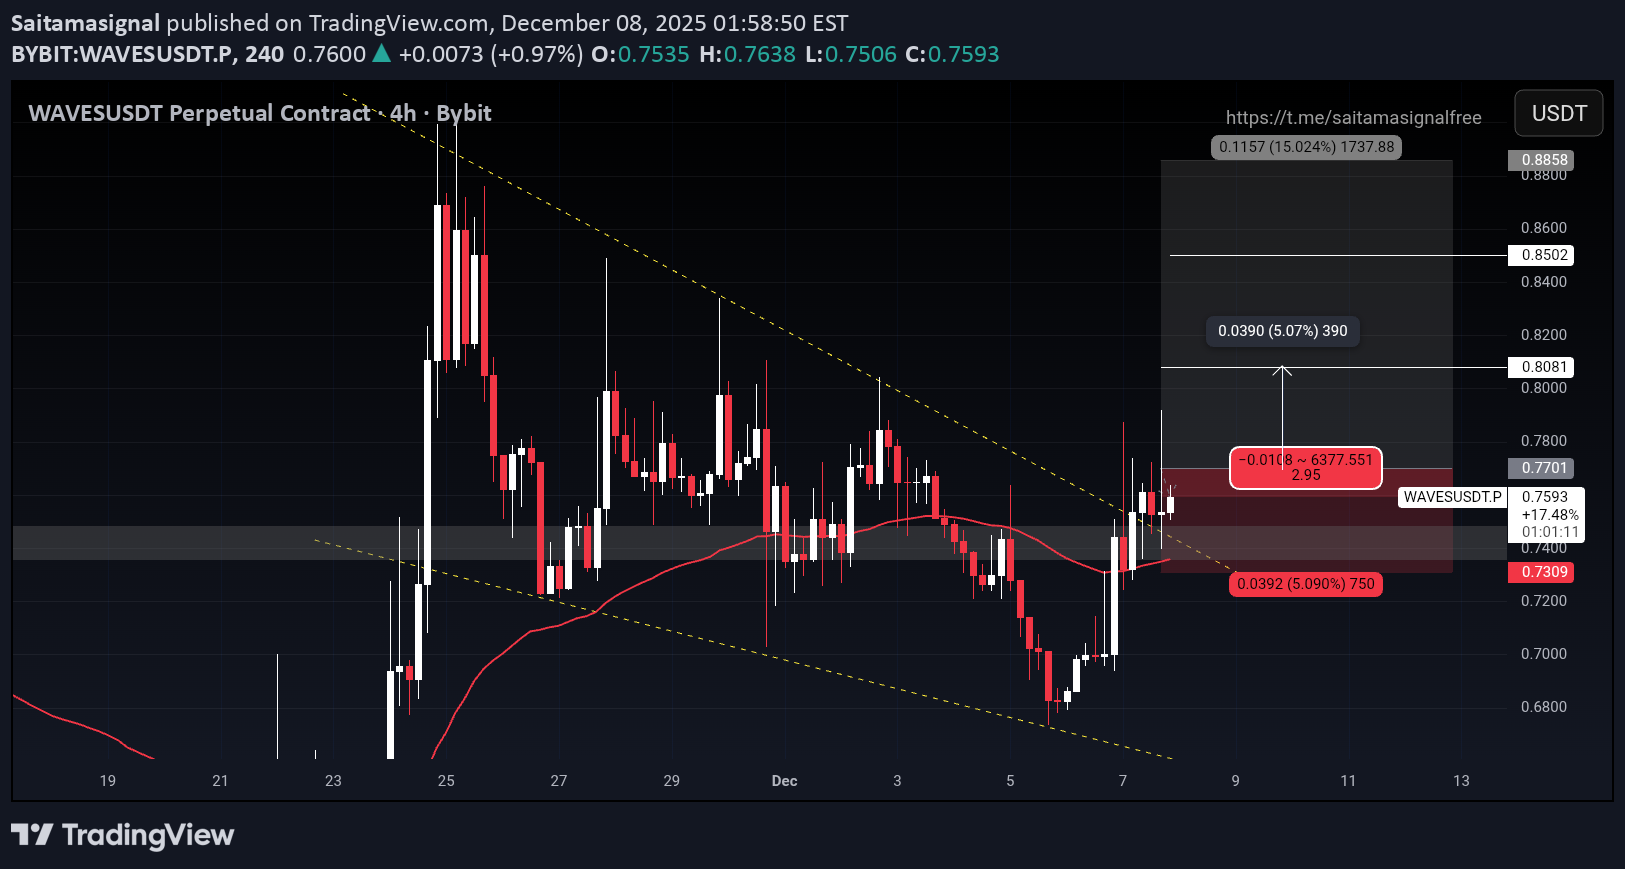
COIN NAME : WAVESUSDT ( isolated ) Buy long zone : 1) 0.771 Take profit : 1) 0.8081 2) 0.8502 3) 0.8858 Stop loss : 0.7309 Max leverage: 6x Amount : 2.0% Disclaimer: This is not financial advice. Always do your own research and use strict risk management. The crypto market is highly volatile.

CryptoAnalystSignal
پیشبینی صعودی قدرتمند WAVES/USDT: فرصت خرید در این سطح کلیدی!
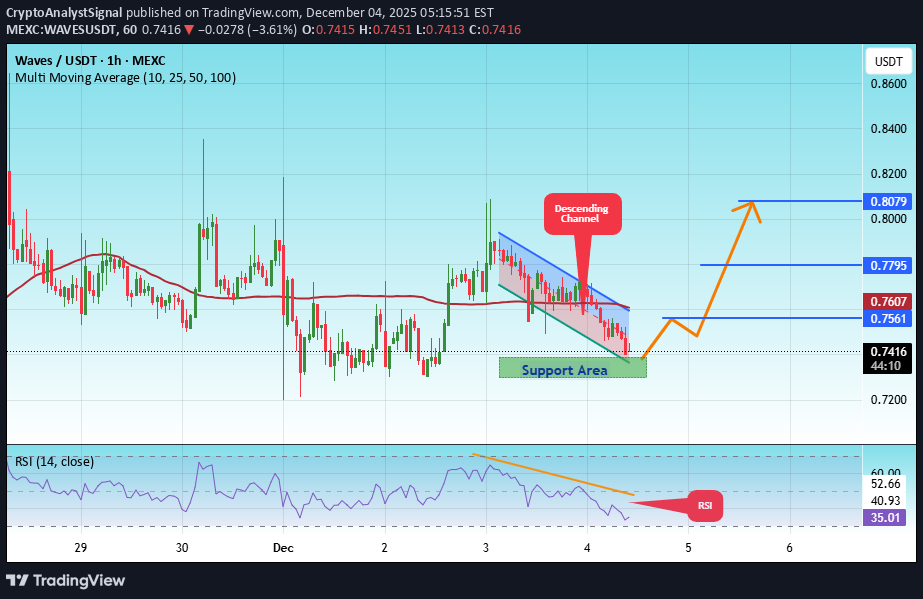
#WAVES The price is moving in a descending channel on the 1-hour timeframe. It has reached the lower boundary and is heading towards breaking above it, with a retest of the upper boundary expected. We have a downtrend on the RSI indicator, which has reached near the lower boundary, and an upward rebound is expected. There is a key support zone in green at 0.7335. The price has bounced from this level multiple times and is expected to bounce again. We have a trend towards consolidation above the 100-period moving average, as we are moving close to it, which supports the upward movement. Entry price: 0.7416 First target: 0.7560 Second target: 0.7795 Third target: 0.8080 Don't forget a simple principle: money management. Place your stop-loss order below the support zone in green. For any questions, please leave a comment. Thank you.#WAVES First target: 0.7560 Reached Second target: 0.7795 Reached Third target: 0.8080 Reached

julia17
پیشبینی شگفتانگیز بیت کوین؛ آیا WAVES به اوج ۱.۸۶ دلار میرسد؟
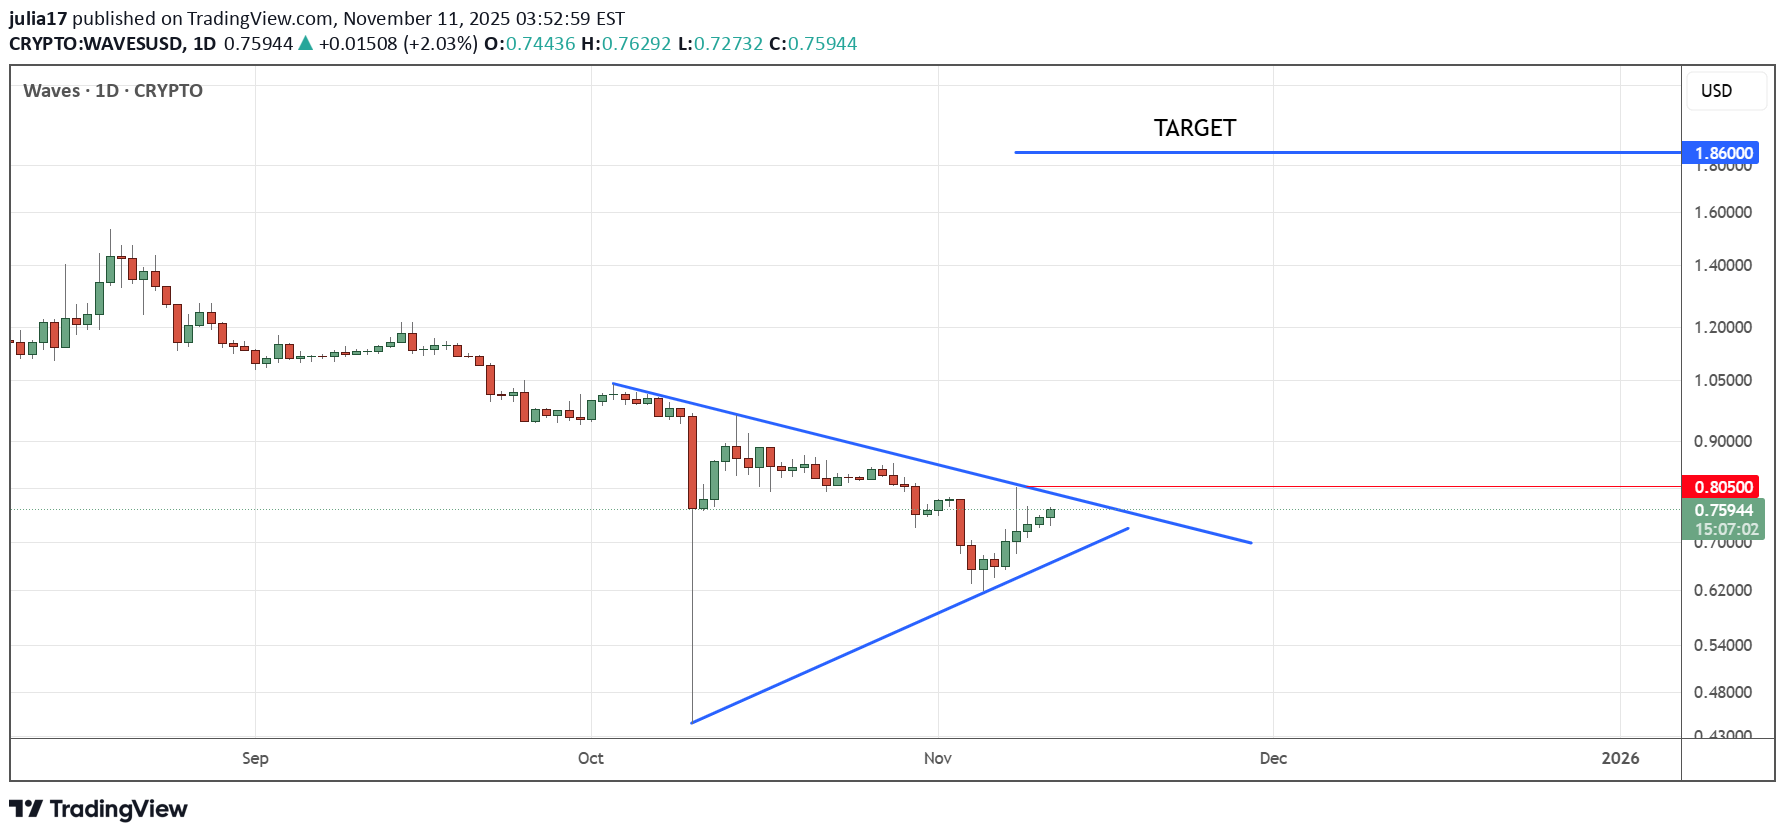
WAVES has formed a triangle pattern, need to break out above 0.805 with the target 1.86.

Anil_kenar
ikili tepe formasyonu var gibi!
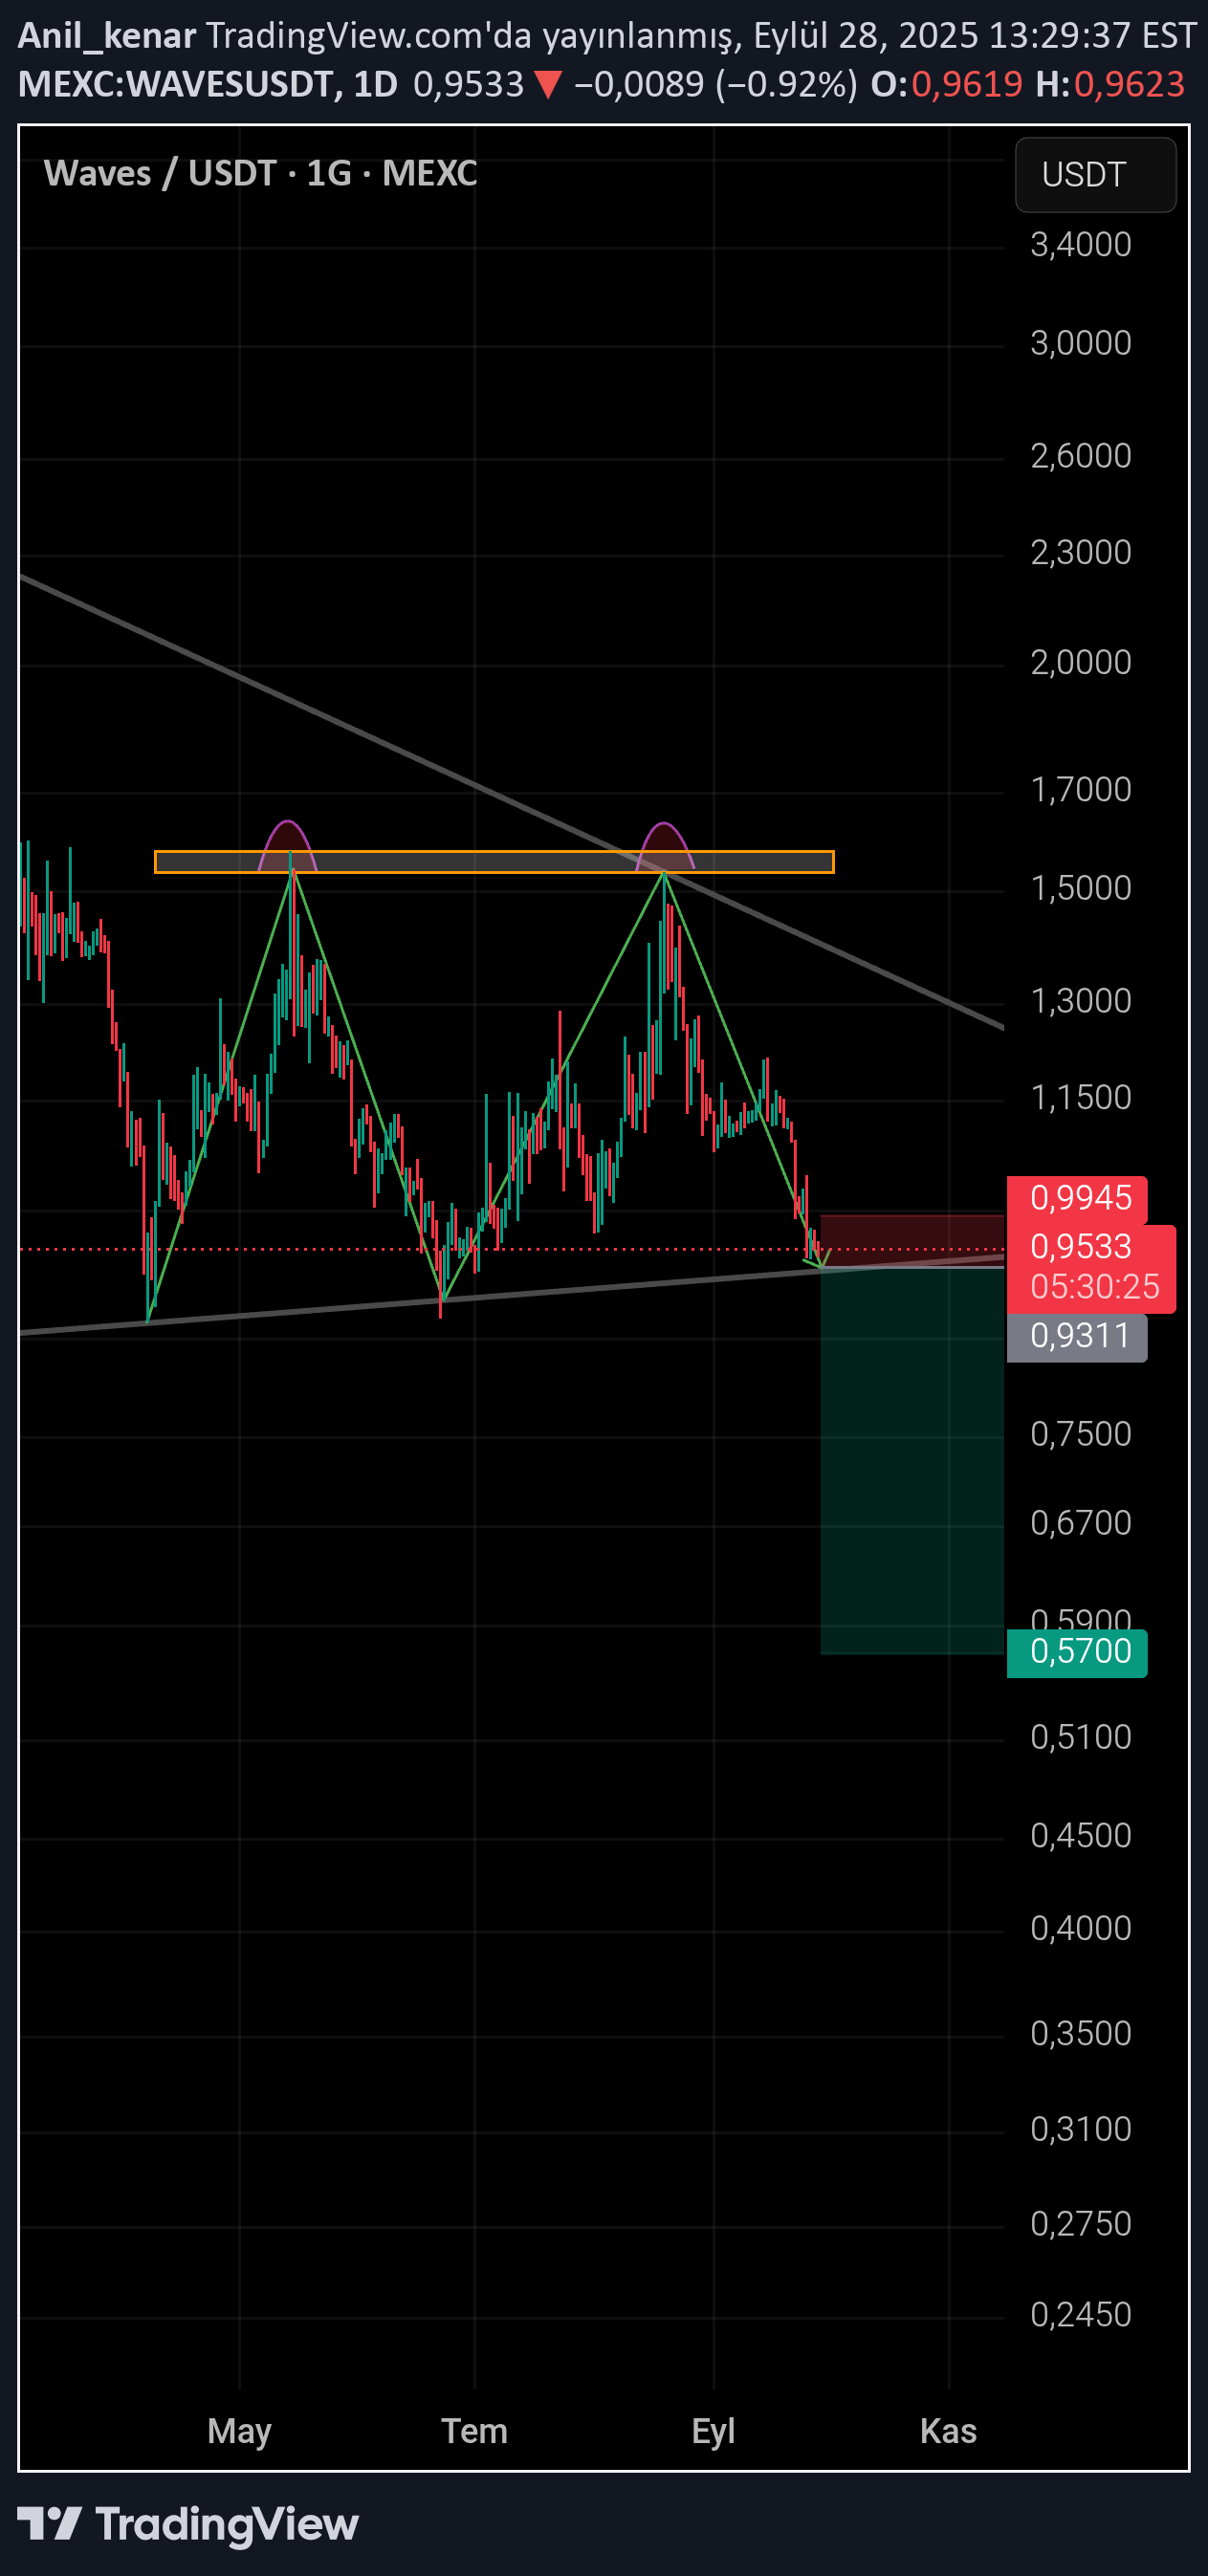
It seems to be making a binary hill formation, but it will be useful to follow the entrance will be when it closes under the rise.

“WAVES Price Prediction: Key Breakout & Safety Zones”
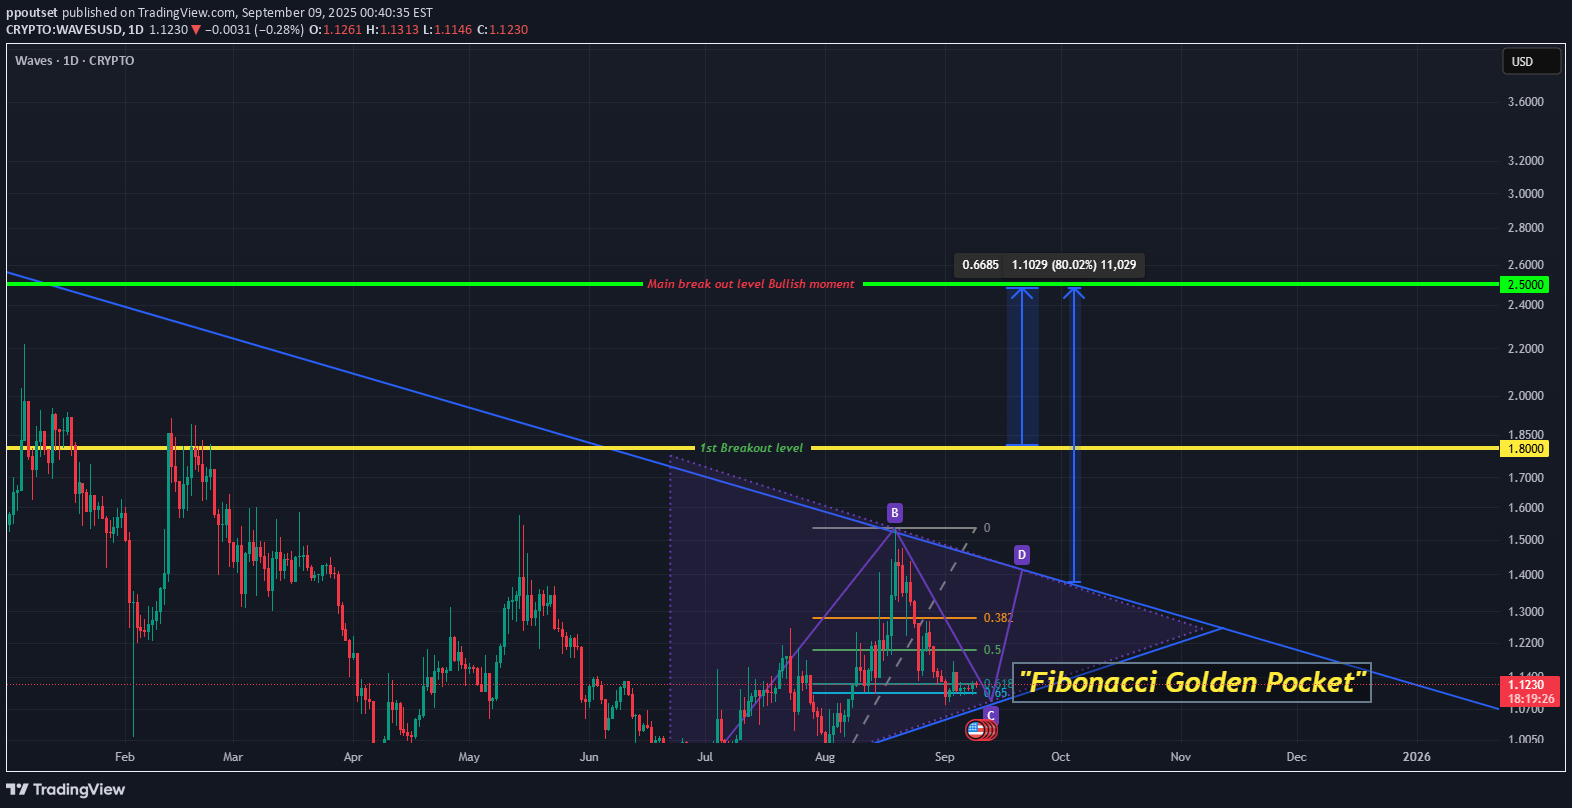
Analysis Idea: WAVES is currently trading inside a symmetrical triangle pattern. Price is consolidating and approaching the apex, which usually leads to a strong breakout. 1.8 TO 2.5
“WAVES Approaching Major Resistance – Possible Bullish Move”
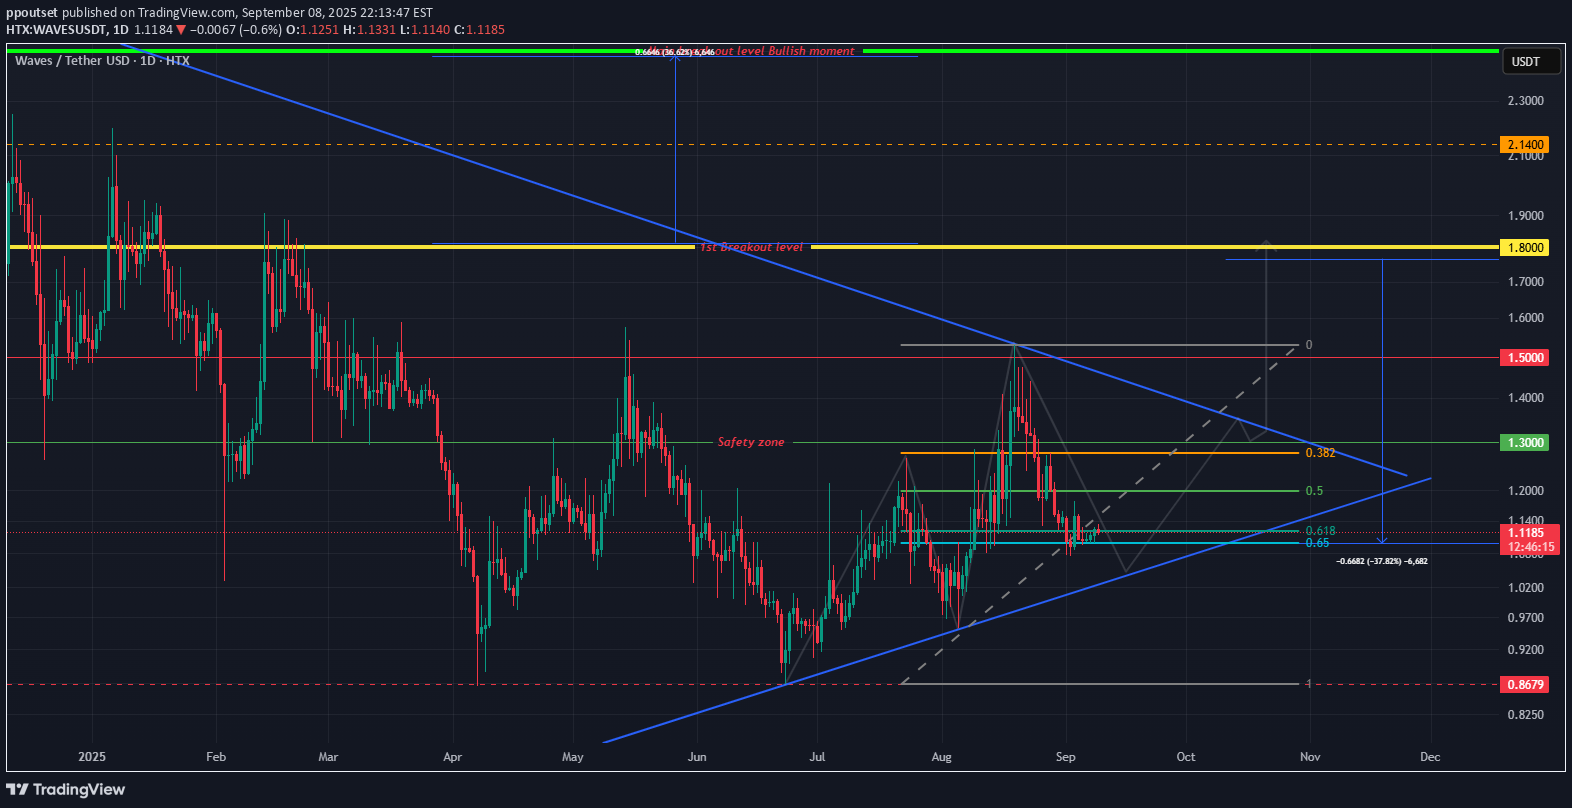
WAVES is currently trading inside a symmetrical triangle pattern. Price is consolidating and approaching the apex, which usually leads to a strong breakout. Safety Zone: ₹95–100 range, holding support. 1st Breakout Level: Around ₹120–125. If this breaks, price can rally further. Main Breakout (Bullish Momentum): ₹160+. Above this level, a strong uptrend can start.

SatochiTrader


Zorroreny
WAVES - bearish 3 drives in the making?

WAVES playing with nerves but when looking at pattern and fibb levels it seems we are doing major bearish 3 drives pattern, where we have one more impulse to new ATH left. We can see that BTC had similar setup which resulted in push toward new ATH and I expect Waves to do similar move. Target for that pattern is fibb 1.272 extension at 200$ range with possible extended push to fibb 1.618 extension if whole crypto market goes into crazy fomo mode.For pattern to workout as planned it's important that we do not make any new lows - we are currently sitting at longerm RSI support diagonal so I expect bounce up. Once we flip MA50 into support the move to upside will speed up.

ProfessorXtrader
Just open log on Waves

Just open long on waves with 20x Invest 100$ in spot Buying.

MT_T
WAVESUSDT: Trend in daily time frame
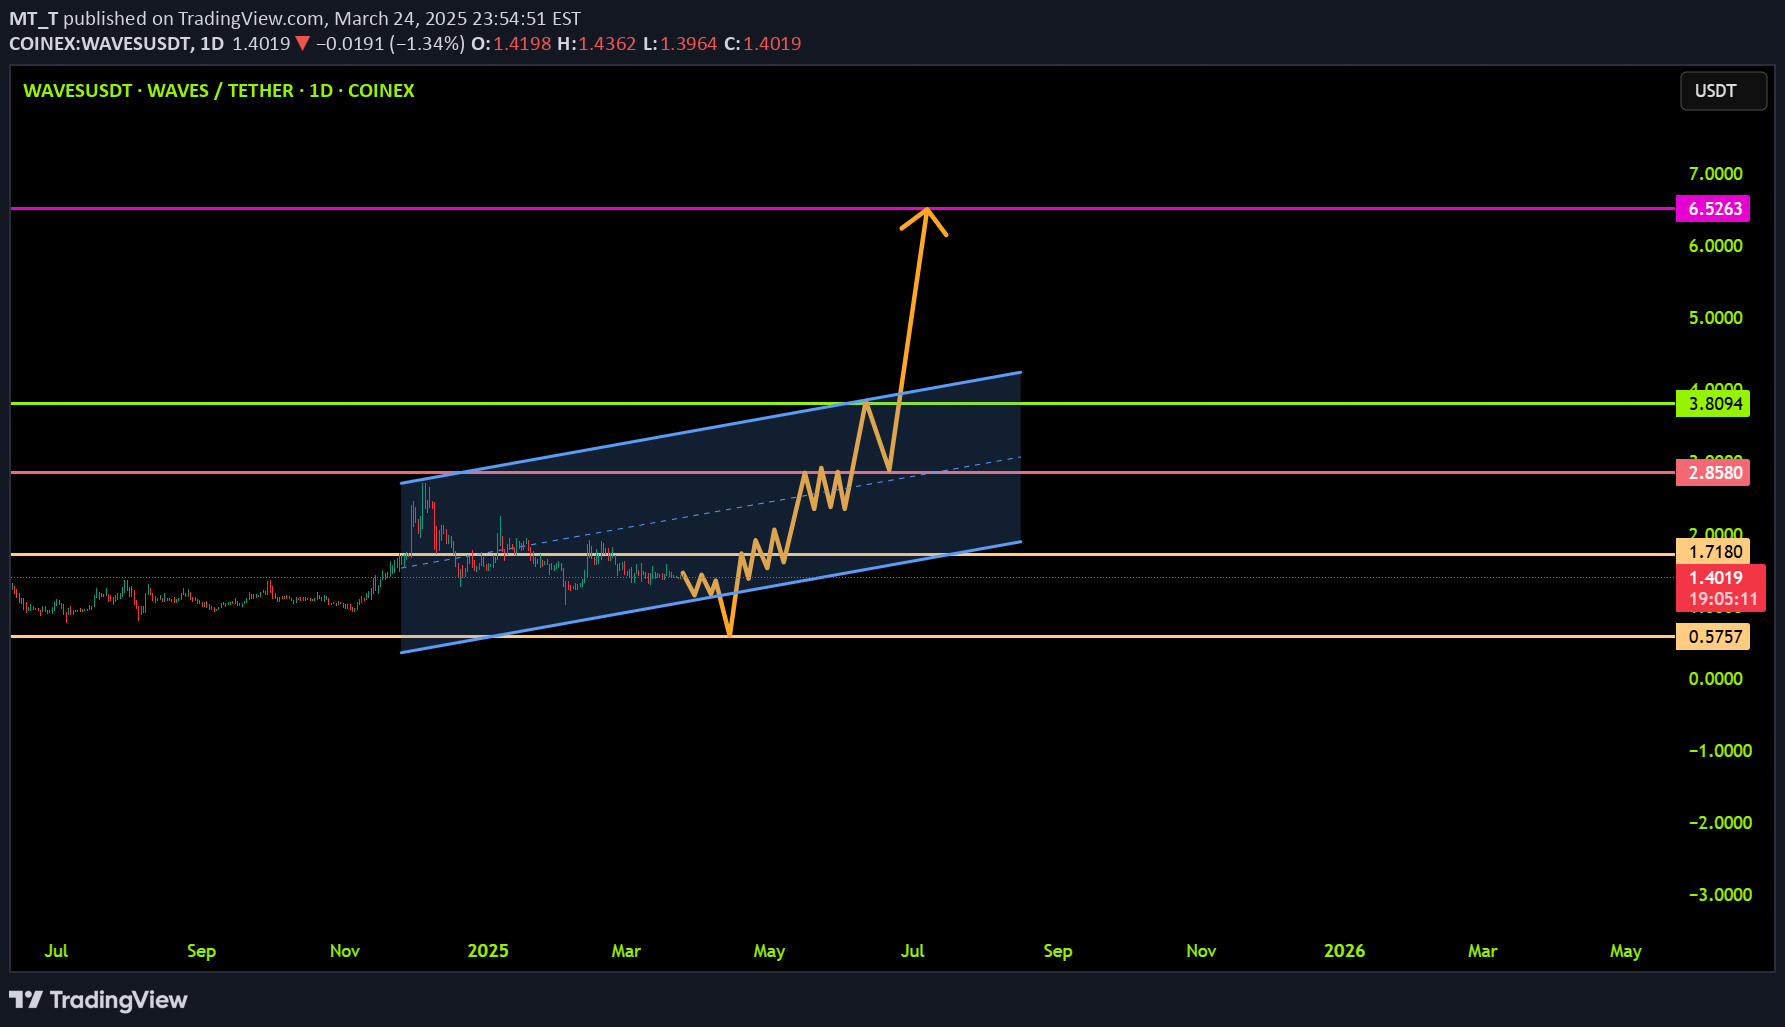
Please pay special attention to the very accurate trend, and colored levels. Its a very sensitive setup, please be careful. BEST, MTJust focus, ........ Trend is very accurate BEST, MTJust focus on the accurate trend, and enjoy BEST, MTJust OMGMassive profits, Enjoy BEST, MT
Disclaimer
Any content and materials included in Sahmeto's website and official communication channels are a compilation of personal opinions and analyses and are not binding. They do not constitute any recommendation for buying, selling, entering or exiting the stock market and cryptocurrency market. Also, all news and analyses included in the website and channels are merely republished information from official and unofficial domestic and foreign sources, and it is obvious that users of the said content are responsible for following up and ensuring the authenticity and accuracy of the materials. Therefore, while disclaiming responsibility, it is declared that the responsibility for any decision-making, action, and potential profit and loss in the capital market and cryptocurrency market lies with the trader.