
VIRTUAL
Virtuals Protocol
| تریدر | نوع سیگنال | حد سود/ضرر | زمان انتشار | مشاهده پیام |
|---|---|---|---|---|
 Kap_WavesRank: 744 | خرید | حد سود: تعیین نشده حد ضرر: تعیین نشده | 11/22/2025 | |
 Alpha-GoldFXRank: 31959 | خرید | حد سود: تعیین نشده حد ضرر: تعیین نشده | 11/27/2025 | |
 MMBTtraderRank: 31275 | خرید | حد سود: ۲ حد ضرر: ۰٫۲ | 10/24/2025 |
Price Chart of Virtuals Protocol
سود 3 Months :
سیگنالهای Virtuals Protocol
Filter
Sort messages by
Trader Type
Time Frame

تحلیل VIRTUAL/USDT: لحظه حساس خروج از کانال نزولی؛ منتظر شکست ۱ دلار باشید!
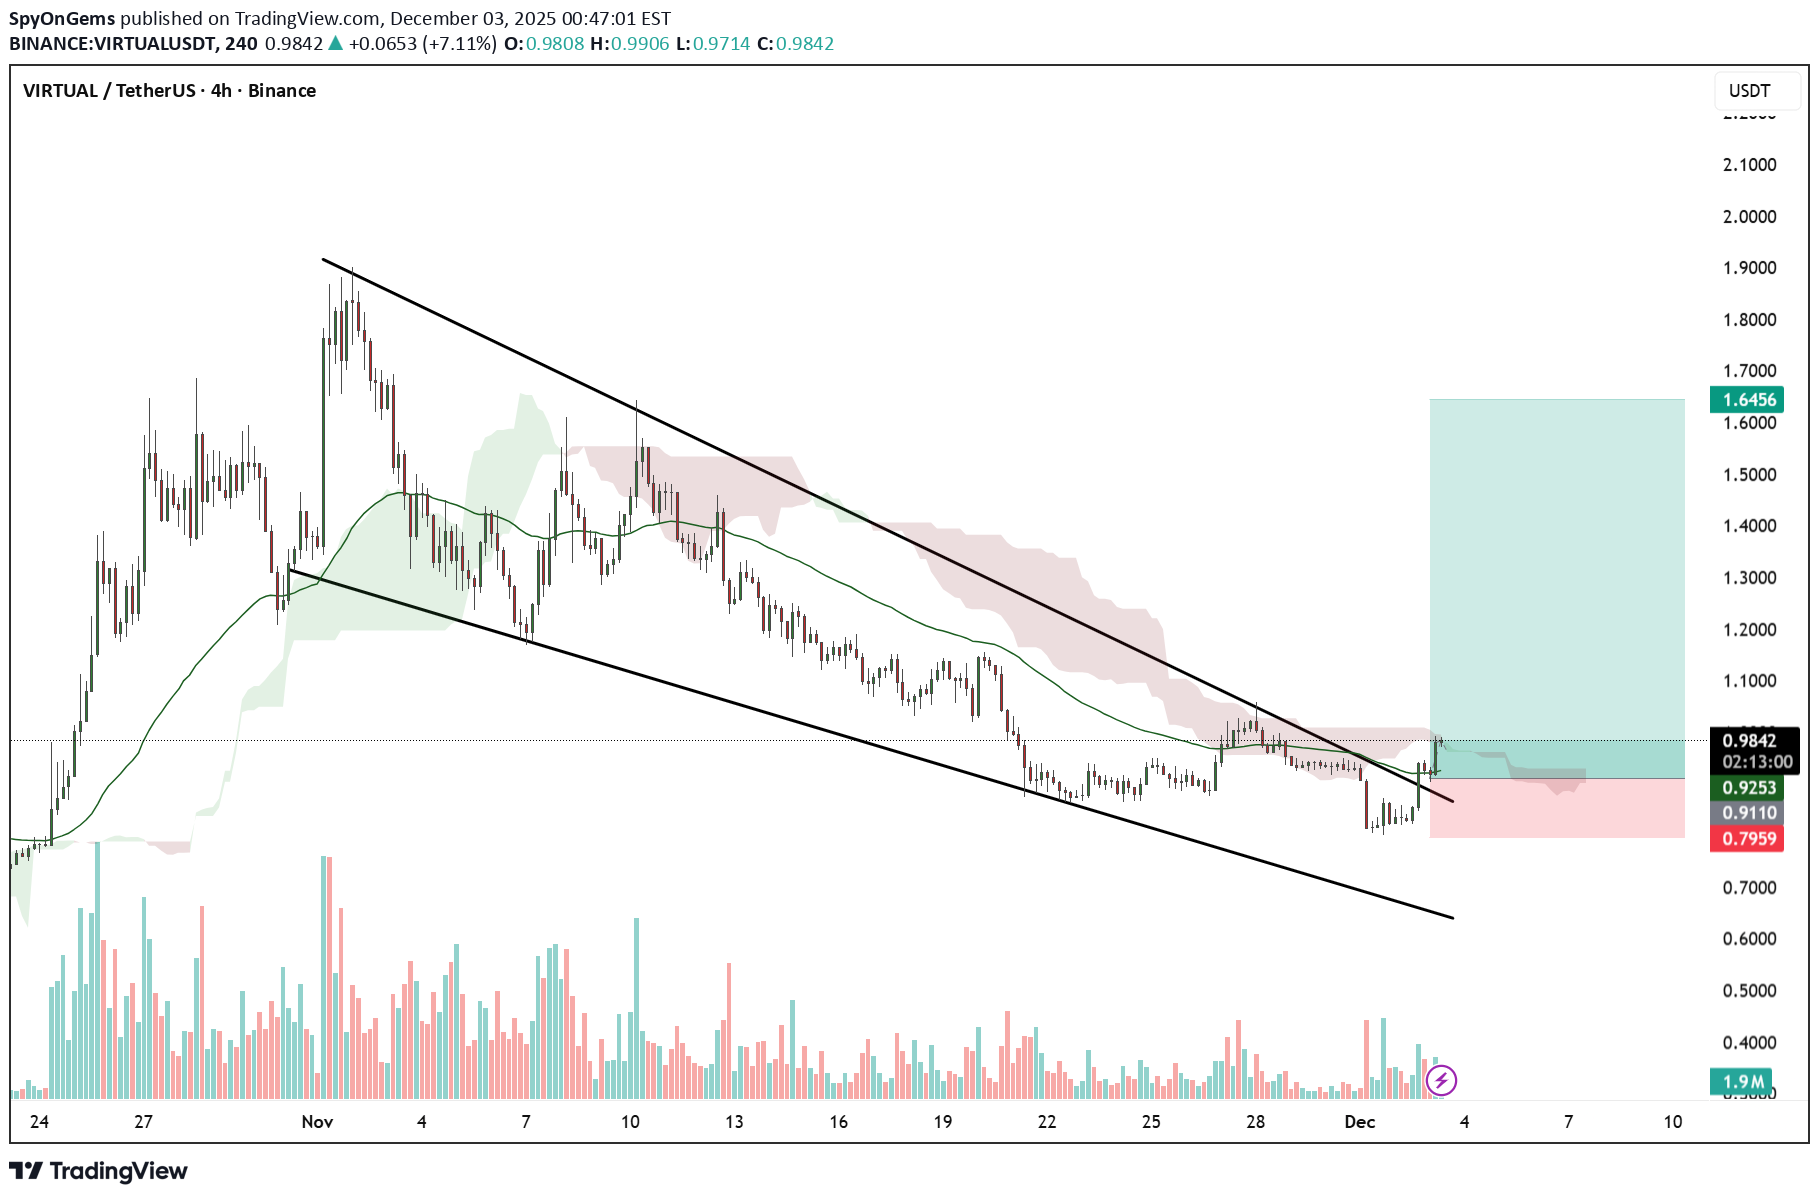
On the 4-hour chart of **VIRTUAL/USDT**, price has been moving inside a clear **descending channel** since mid-November, making lower highs and lower lows. Recently, price rebounded from the lower trendline and is now testing the upper boundary of the channel near **$0.98–$1.00**. The candle structure shows that bulls are trying to break out of this channel, but price is still facing resistance from both the **Ichimoku Cloud** and the **EMA trendline**, which are acting as dynamic resistance levels. A confirmed breakout and 4H candle close above **$1.00–$1.05** would indicate a possible trend reversal toward **$1.20–$1.30**, while rejection from this zone could lead to another decline toward the **$0.85–$0.80** support area. Volume has increased slightly on the recent upward move, showing early buying pressure, but a clean breakout confirmation is still needed for strong bullish continuation.
Alpha-GoldFX
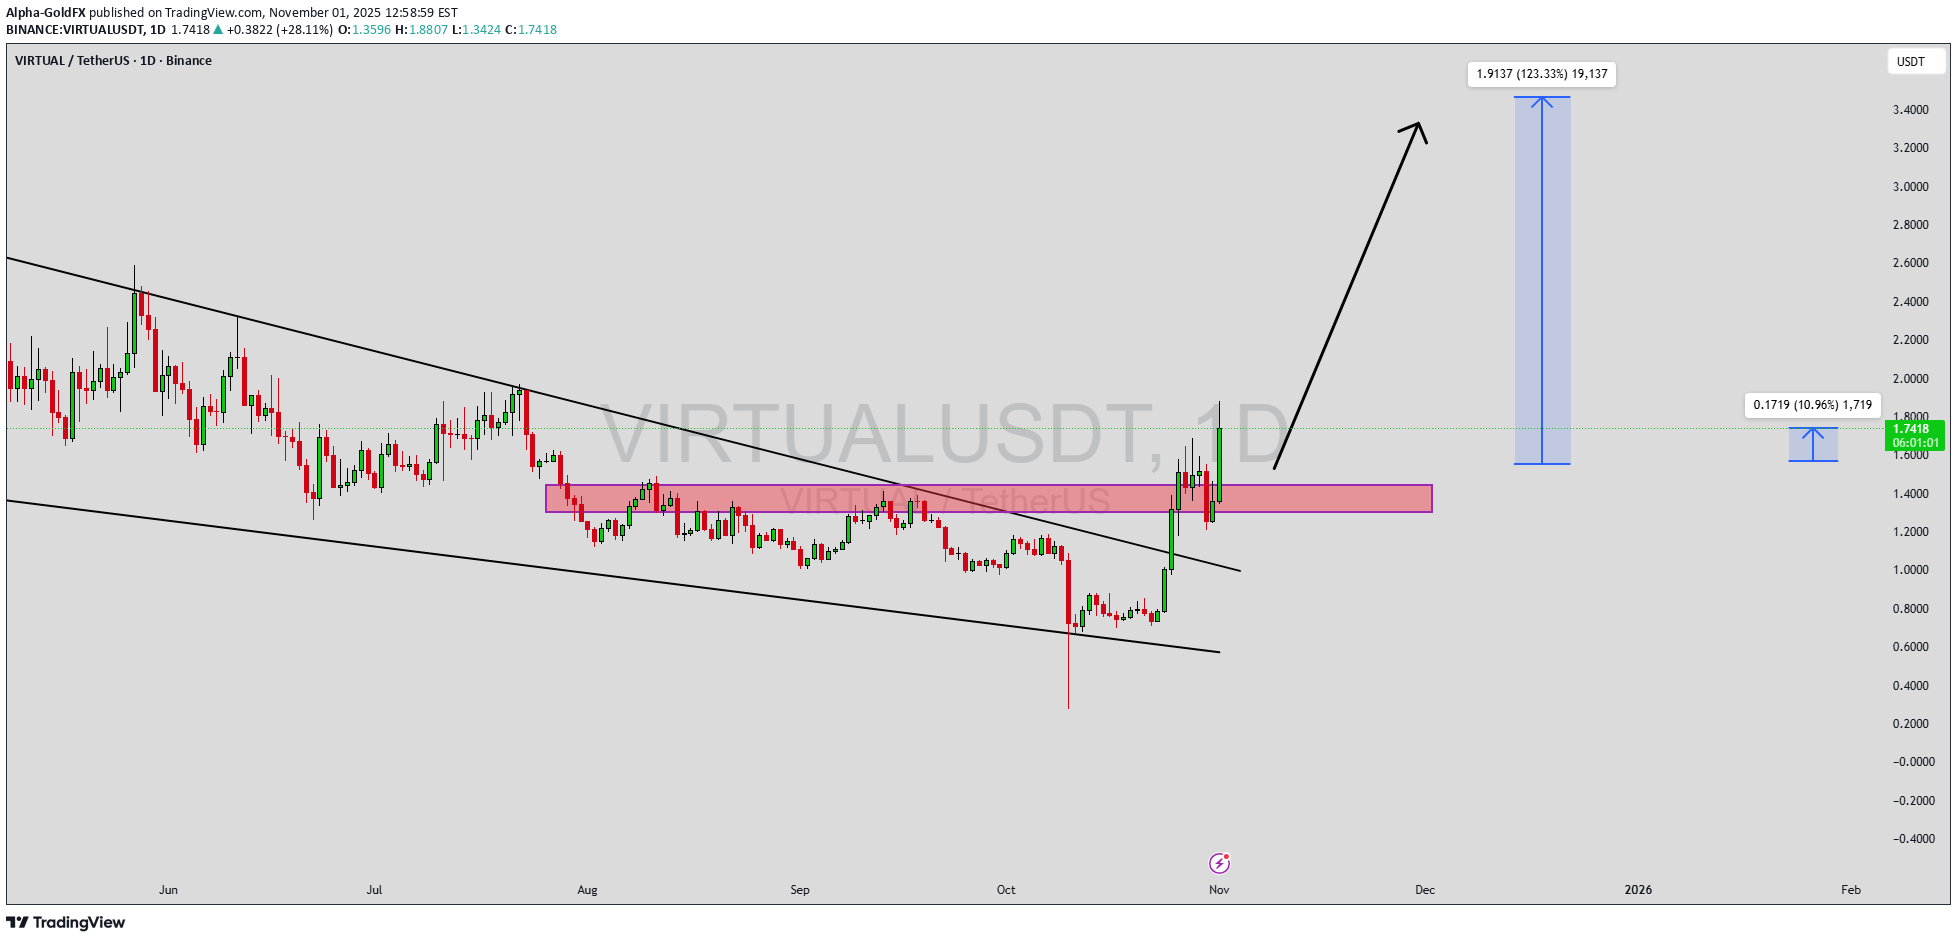
سیگنال صعودی انفجاری VIRTUALUSDT: چنگال نزولی نویدبخش رشد 200 درصدی!
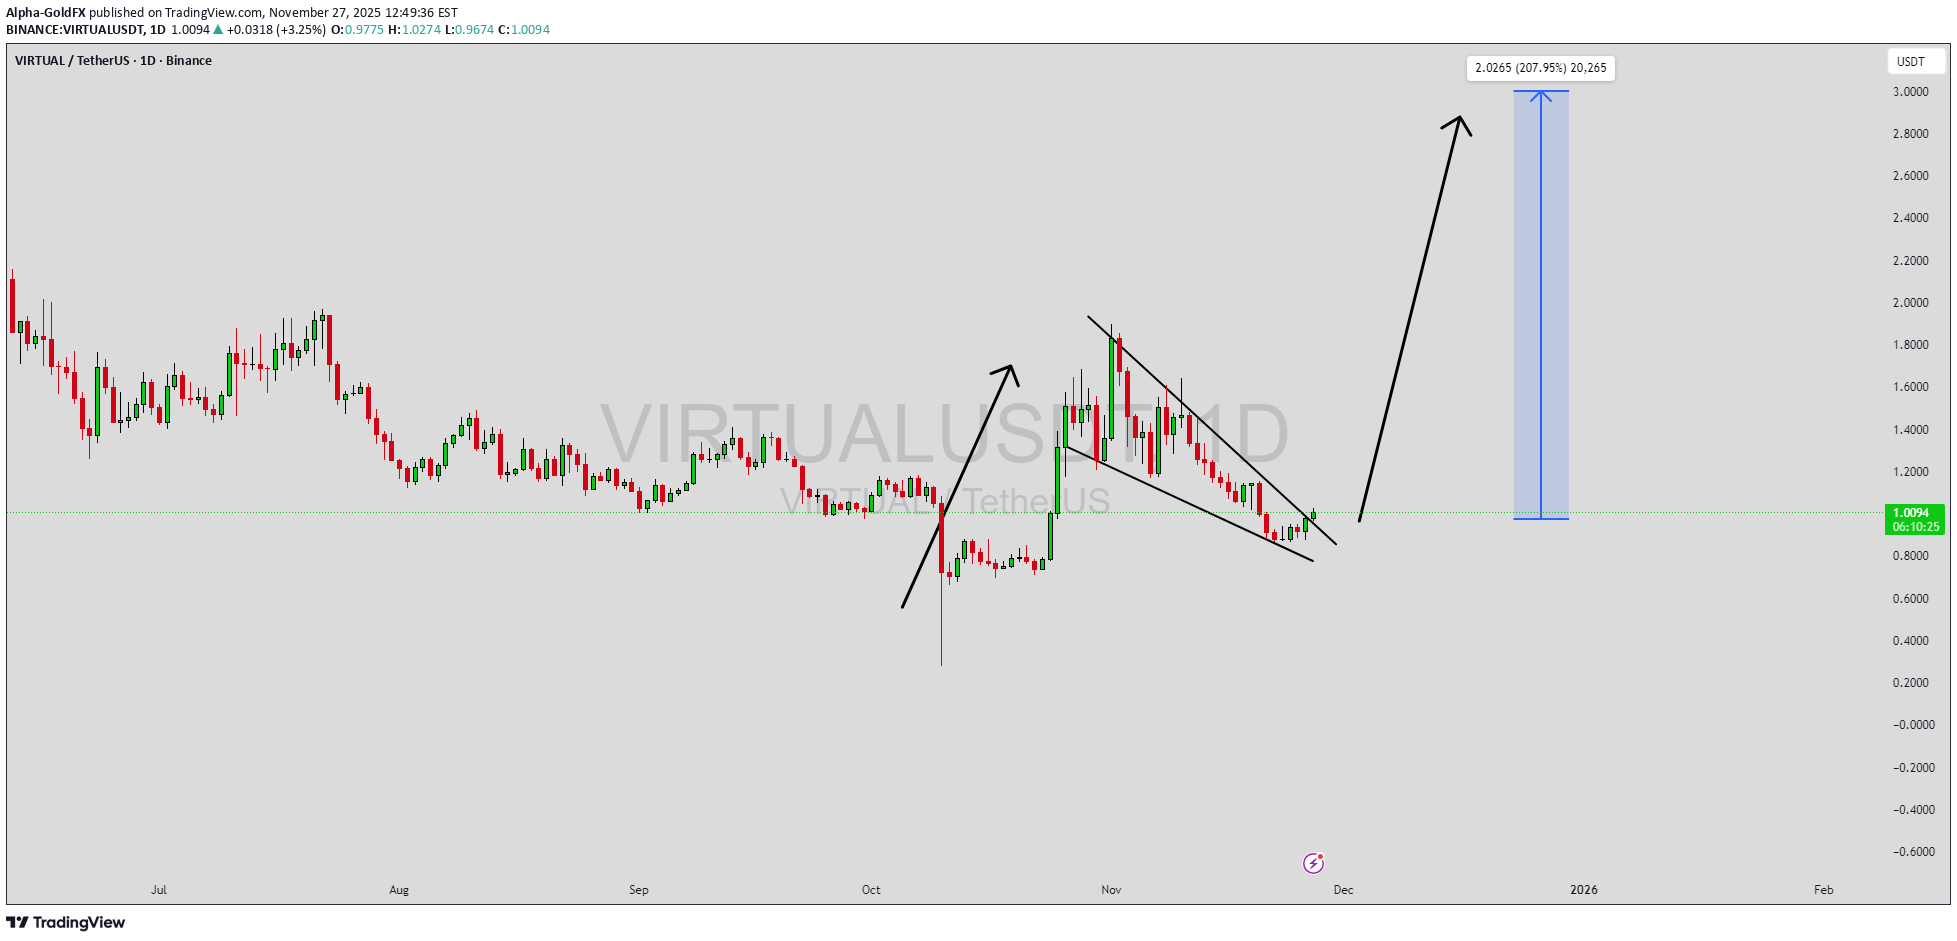
VIRTUALUSDT is forming a clear falling wedge pattern, a classic bullish reversal signal that often indicates an upcoming breakout. The price has been consolidating within a narrowing range, suggesting that selling pressure is weakening while buyers are beginning to regain control. With consistent volume confirming accumulation at lower levels, the setup hints at a potential bullish breakout soon. The projected move could lead to an impressive gain of around 190% to 200% once the price breaks above the wedge resistance. This falling wedge pattern is typically seen at the end of downtrends or corrective phases, and it represents a potential shift in market sentiment from bearish to bullish. Traders closely watching VIRTUALUSDT are noting the strengthening momentum as it nears a breakout zone. The good trading volume adds confidence to this pattern, showing that market participants are positioning early in anticipation of a reversal. Investors’ growing interest in VIRTUALUSDT reflects rising confidence in the project’s long-term fundamentals and current technical strength. If the breakout confirms with sustained volume, this could mark the start of a fresh bullish leg. Traders might find this a valuable setup for medium-term gains, especially as the wedge pattern completes and buying momentum accelerates. ✅ Show your support by hitting the like button and ✅ Leaving a comment below! (What is your opinion about this Coin?) Your feedback and engagement keep me inspired to share more insightful market analysis with you!
Kap_Waves
نقشه راه ویچویش VIRTUALS تا 2026: راز موج الیوت برای جهش بزرگ بعدی
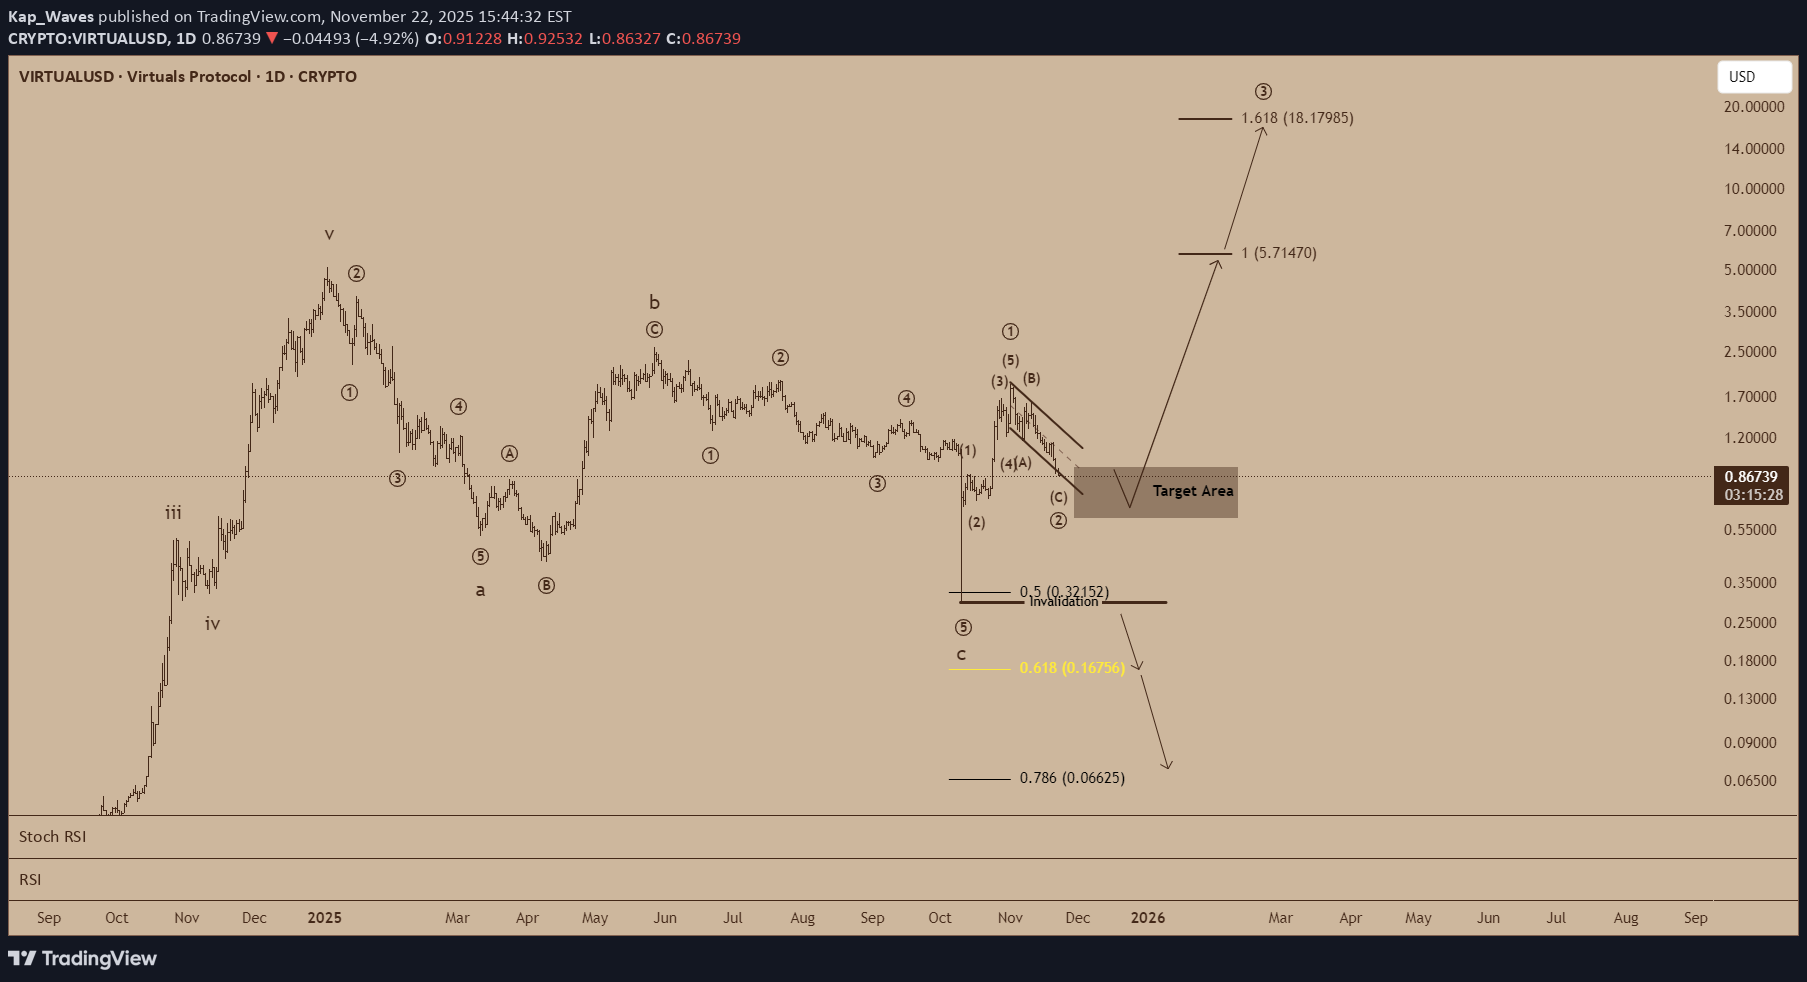
The broader structure on VIRTUALS continues to follow a clean Elliott Wave progression, with price currently moving through what appears to be the final stages of a larger degree wave ② correction. This phase is typically designed to reset sentiment, clear excess leverage, and prepare the market for the next impulsive cycle. The chart highlights a critical Target Area, supported by: 0.5 retracement at 0.3215 (also acting as invalidation) 0.618 retracement at 0.1675 (ideal C-wave termination) 0.786 retracement at 0.0662 (extreme scenario) This confluence creates a structurally important demand zone. As long as price holds above the 0.3215 invalidation, the bullish macro structure remains intact. Bullish Continuation Path If wave ② completes inside the target zone, the next multi-month impulsive cycle would naturally project: Wave 3 (1.618 extension): ~$18.17 These levels reflect proportional Fibonacci relationships often observed in early-cycle expansions. Bearish Alternative Losing the invalidation at 0.3215 opens the door for: A deeper C-wave Sweeps of 0.1675 and potentially 0.0662 Completion of a higher-degree corrective reset before a true bottom is found While still structurally valid, this would delay the next impulsive cycle. Final Thoughts Momentum indicators are nearing oversold conditions, and the wedge structure hints that the market is approaching completion of its corrective phase. Whether price bottoms at the 0.5 or 0.618 retracement, the broader Elliott Wave count suggests that VIRTUALS is preparing for its next major expansion phase—one that could carry significantly beyond the 2024 highs.

Bithereum_io
رمز ارز VIRTUALUSDT در آستانه صعود بزرگ: اهداف قیمتی هیجانانگیز پس از تثبیت حمایت!
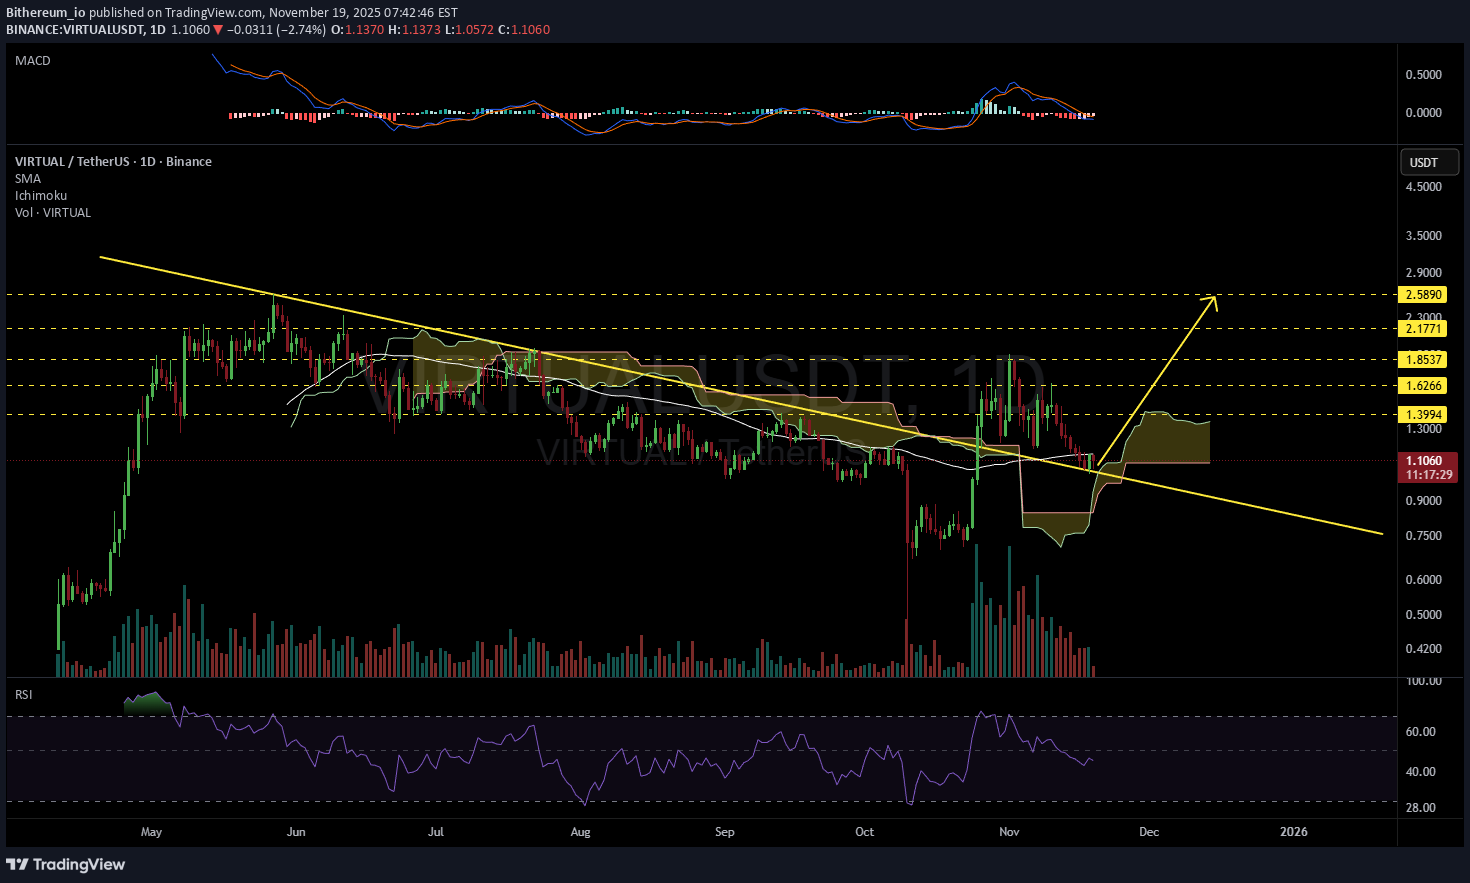
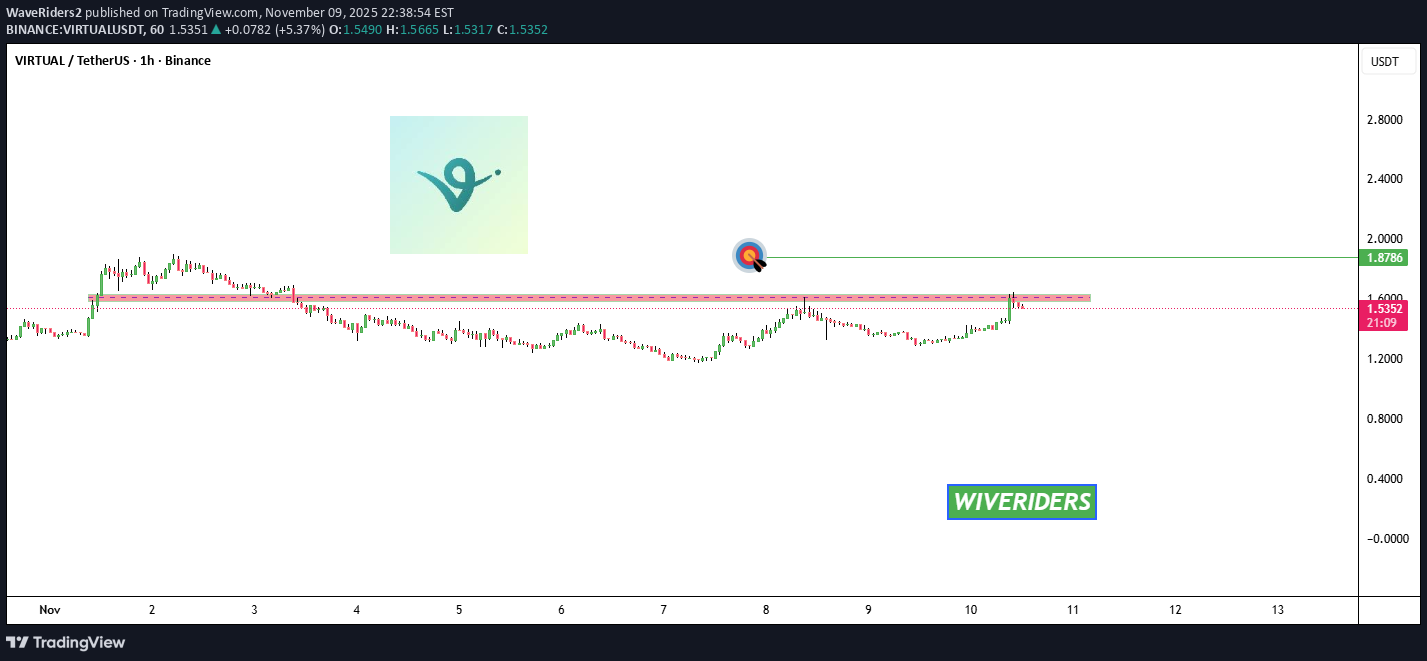
#VIRTUAL pulled back to retest the previously broken descending resistance, and so far the retest has been successful. It is currently battling the daily SMA50, while the broken descending resistance has now turned into support alongside the Ichimoku cloud. If the price breaks above the SMA50, the potential upside targets are: 🎯 $1.3994 🎯 $1.6266 🎯 $1.8537 🎯 $2.1771 🎯 $2.5890 ⚠️ Always remember to protect your capital with a proper stop-loss and disciplined risk management.

WaveRiders2
کدام سطح مقاومت قرمز سرنوشت بیتکوین را رقم میزند؟ (تحلیل تکنیکال VIRTUAL)

johnzelm0723
تحلیل تکنیکال پیشرفته: کشف مسیر ادامه قیمت با شکست سقفهای قبلی (VIRTUALUSDT)
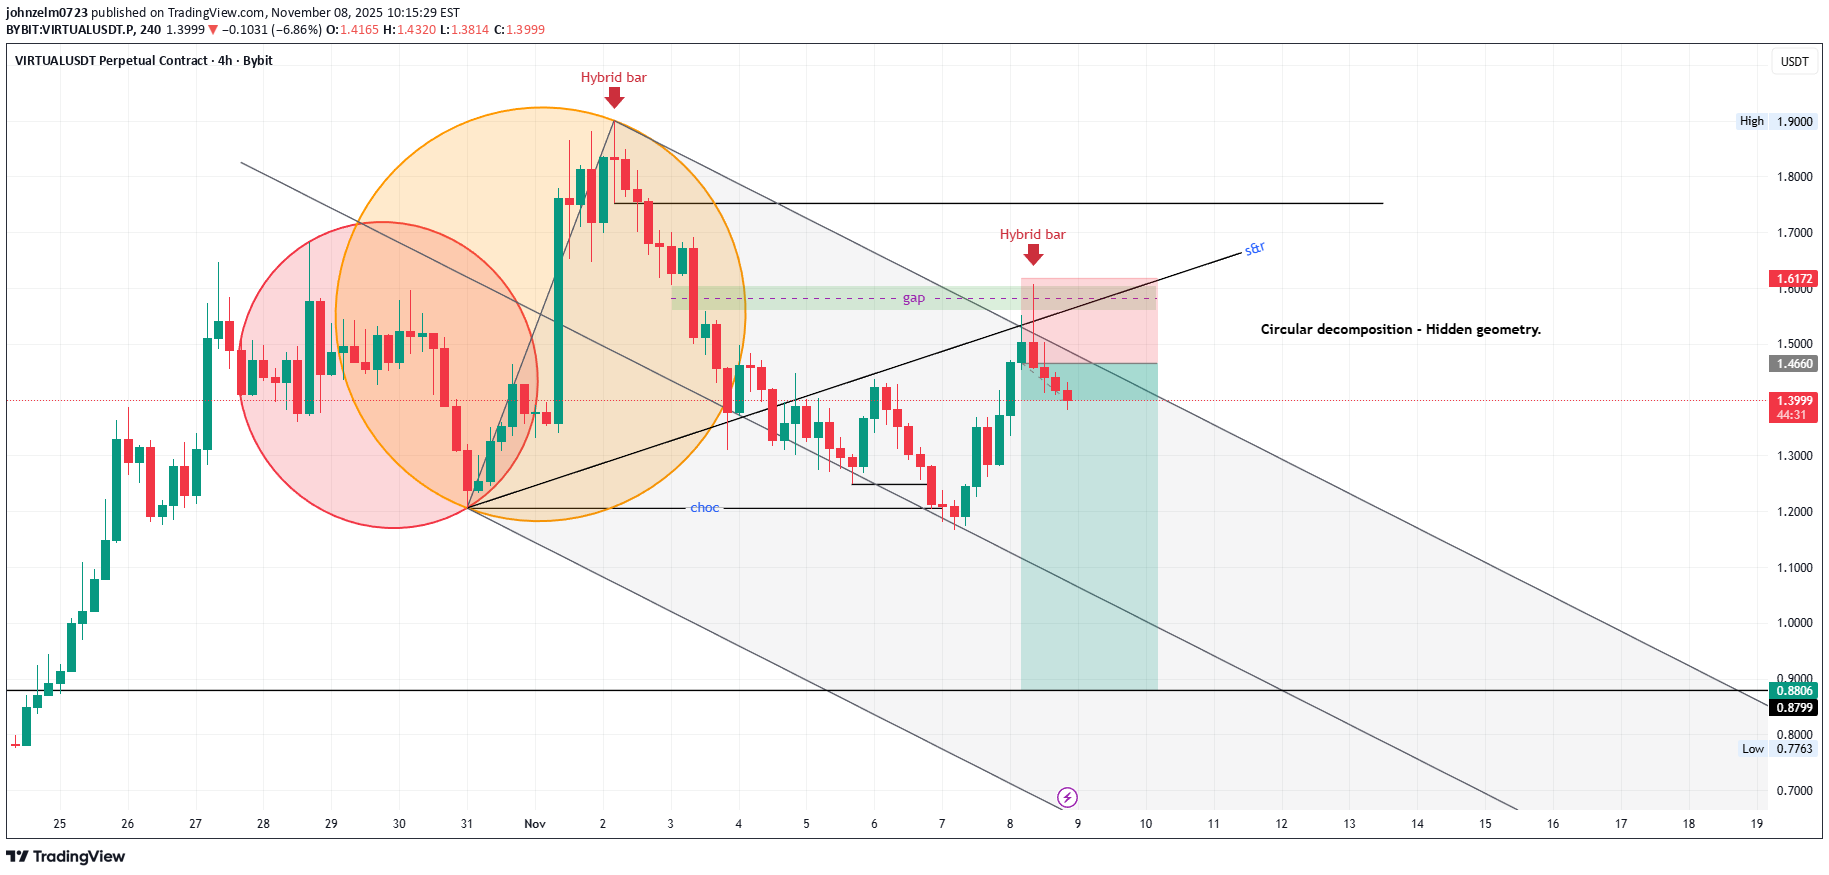
I employ a method known as Circular Decomposition, paired with Andrew's pitchfork, to identify potential price continuations when the market doesn't reach the previous high.

LevelsBySBT
پتانسیل انفجار قیمت Virtuals Protocol: فرصت خرید و نگهداری طلایی!
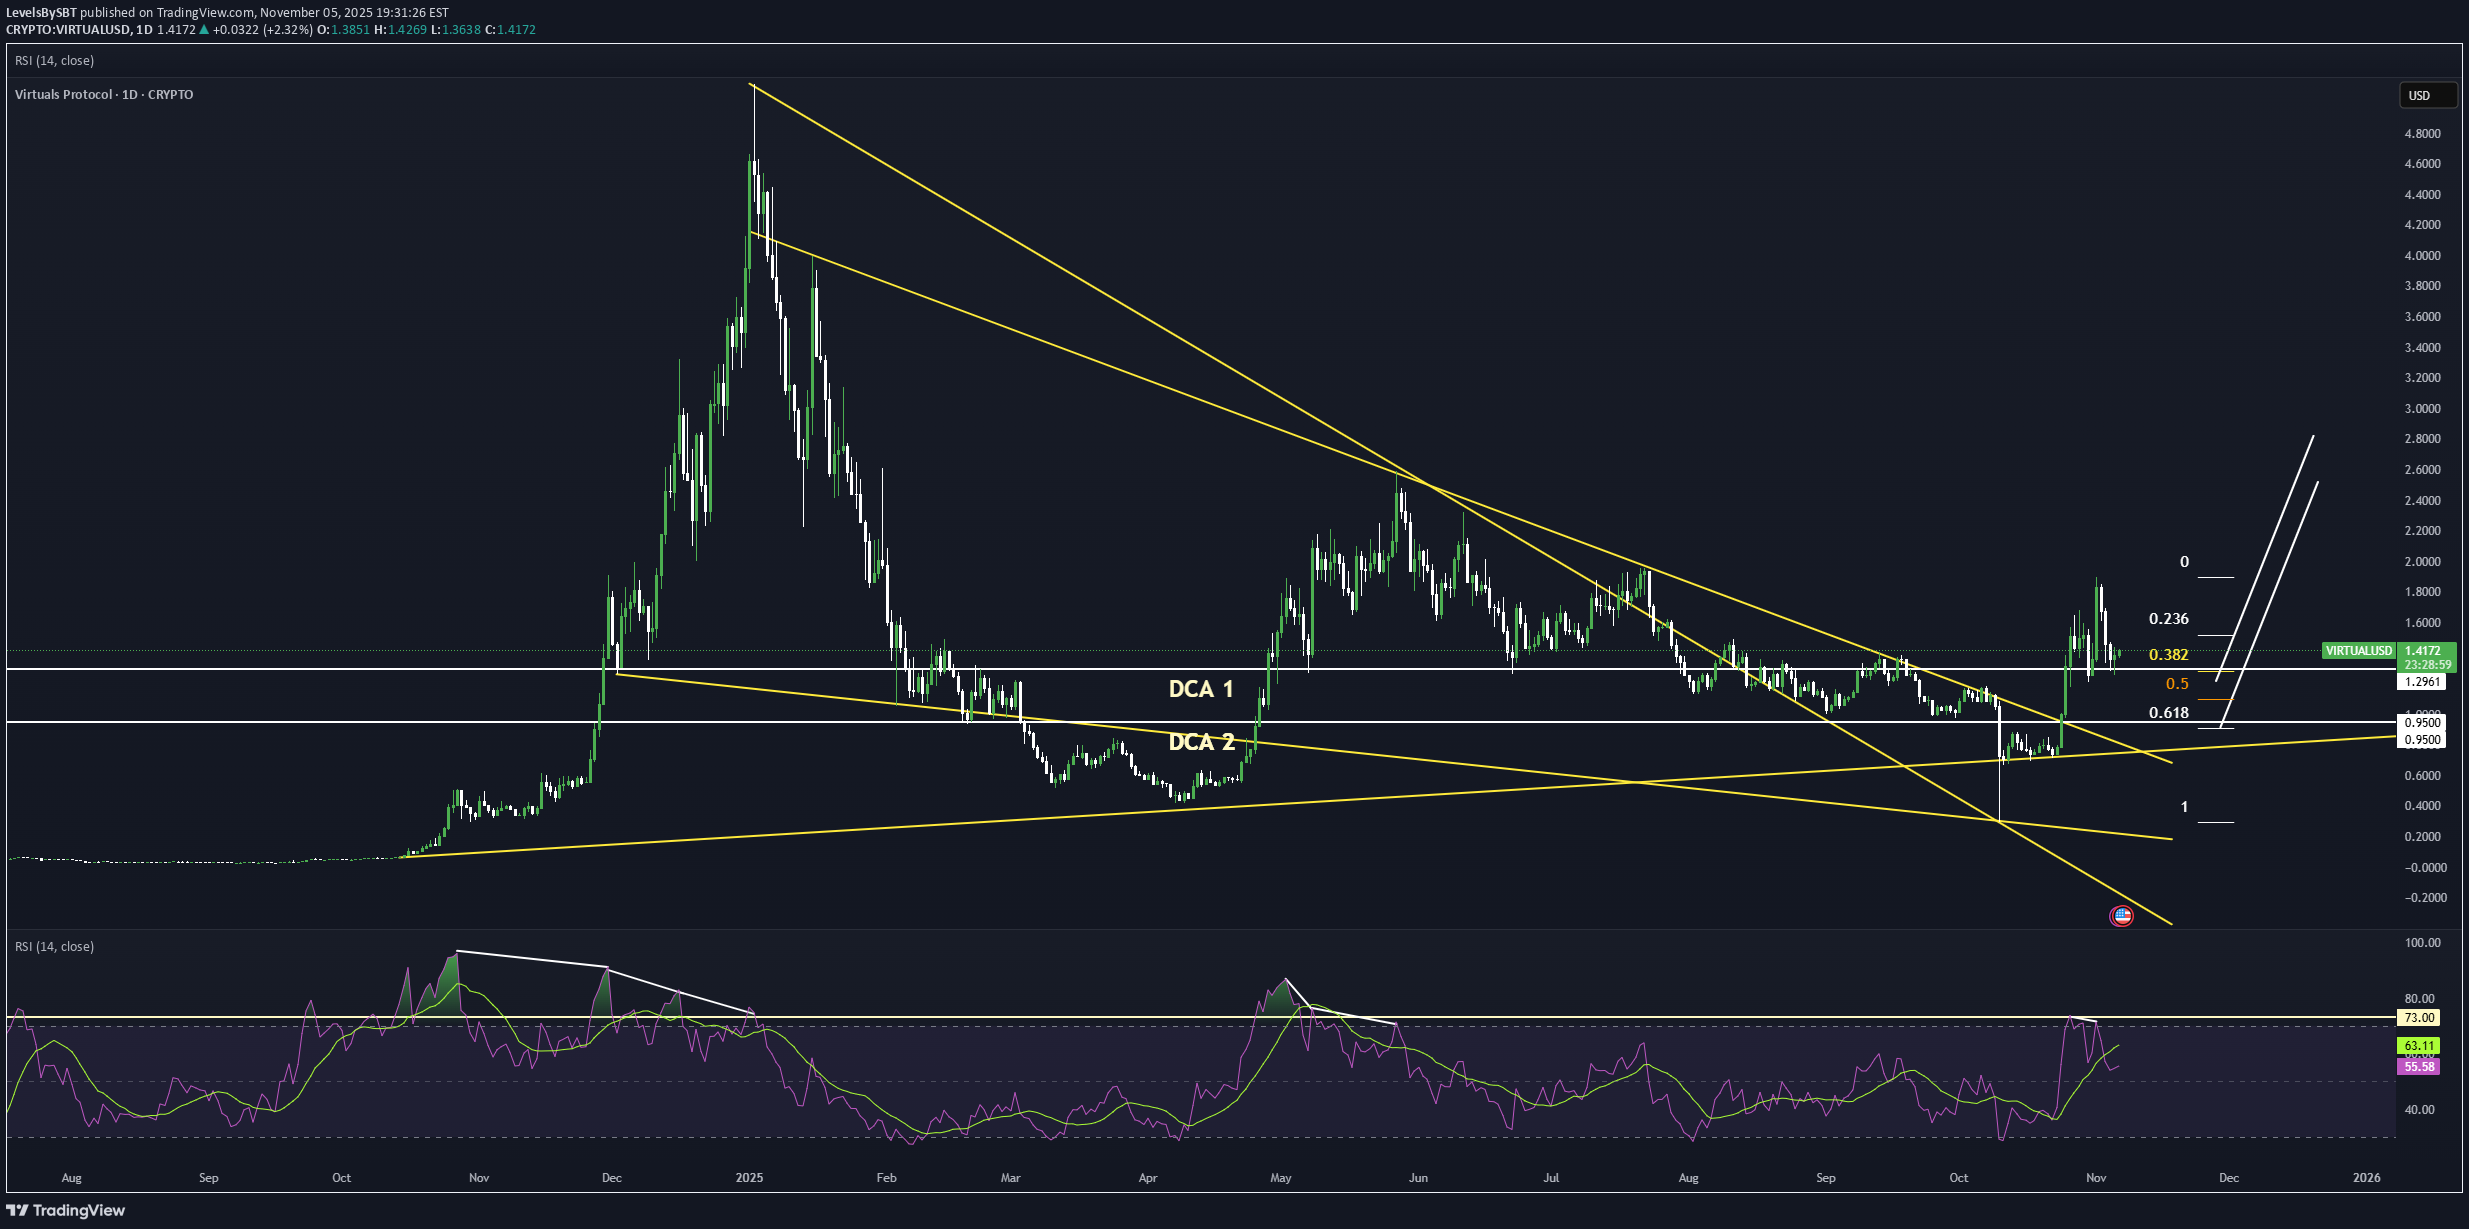
Virtuals Protocol seems to exhibit signs of overall potential Bullish momentum if the price action breaks the previous prominent Higher High with multiple confluences through key Fibonacci and Support levels which presents us with a potential Non-Levered buy and hold opportunity. Entry: (Buy 1 CMP & Buy 2 around 1 - 0.95 range) Stop Loss: 0 (Non-Levered Buy & Hold is recommended) Potential Range for Targets: 2.5 - ATH

BeInCrypto
آیا قیمت پروتکل ورچوال (VIRTUAL) سقوط میکند یا به زودی اوج میگیرد؟ تحلیل حمایت و مقاومت
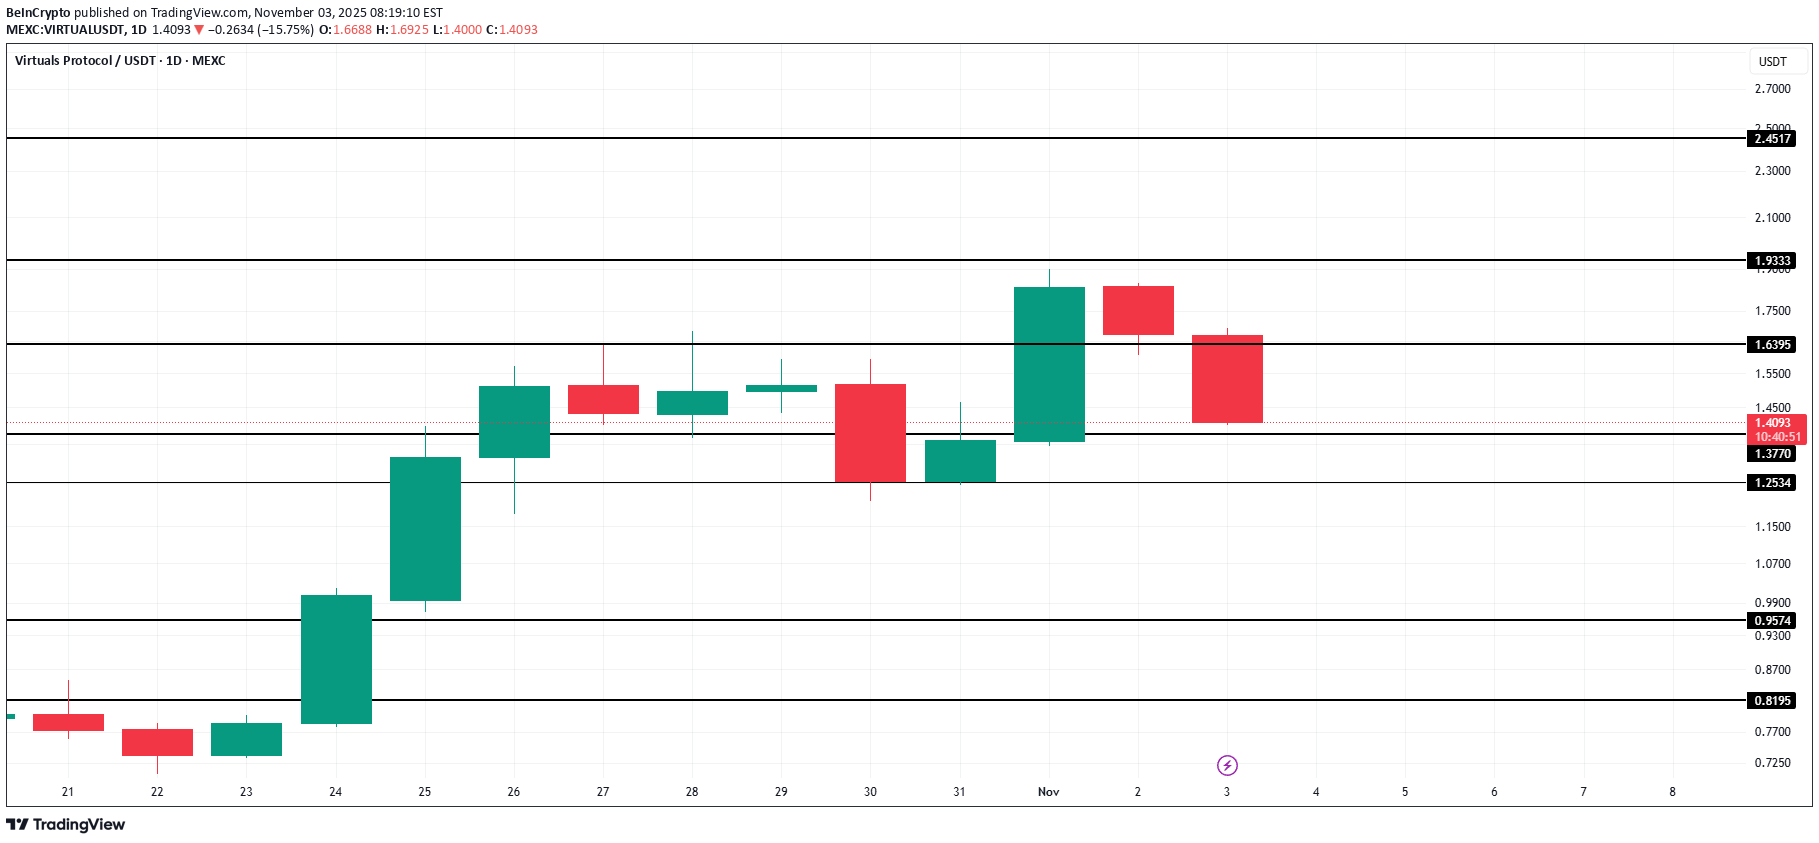
VIRTUAL has become one of the weakest performers today, dropping 16% in the past 24 hours. The token is currently trading at $1.53 after slipping through two critical support levels. If market conditions remain weak, VIRTUAL could extend its decline toward $1.37, marking another potential support test. This level will be crucial for determining whether the altcoin stabilizes or faces additional downside. However, a rebound remains possible as technical indicators show improving signs. The exponential moving averages (EMAs) are approaching a potential Golden Cross, with the signal line nearing a bullish crossover. If confirmed, VIRTUAL could rally toward $2.00, signaling a shift in momentum and invalidating the current bearish outlook.

Cryptojobs
تحلیل جدید VIRTUAL: آیا ریزش قیمتی ادامه دارد یا صعودی بزرگ در راه است؟
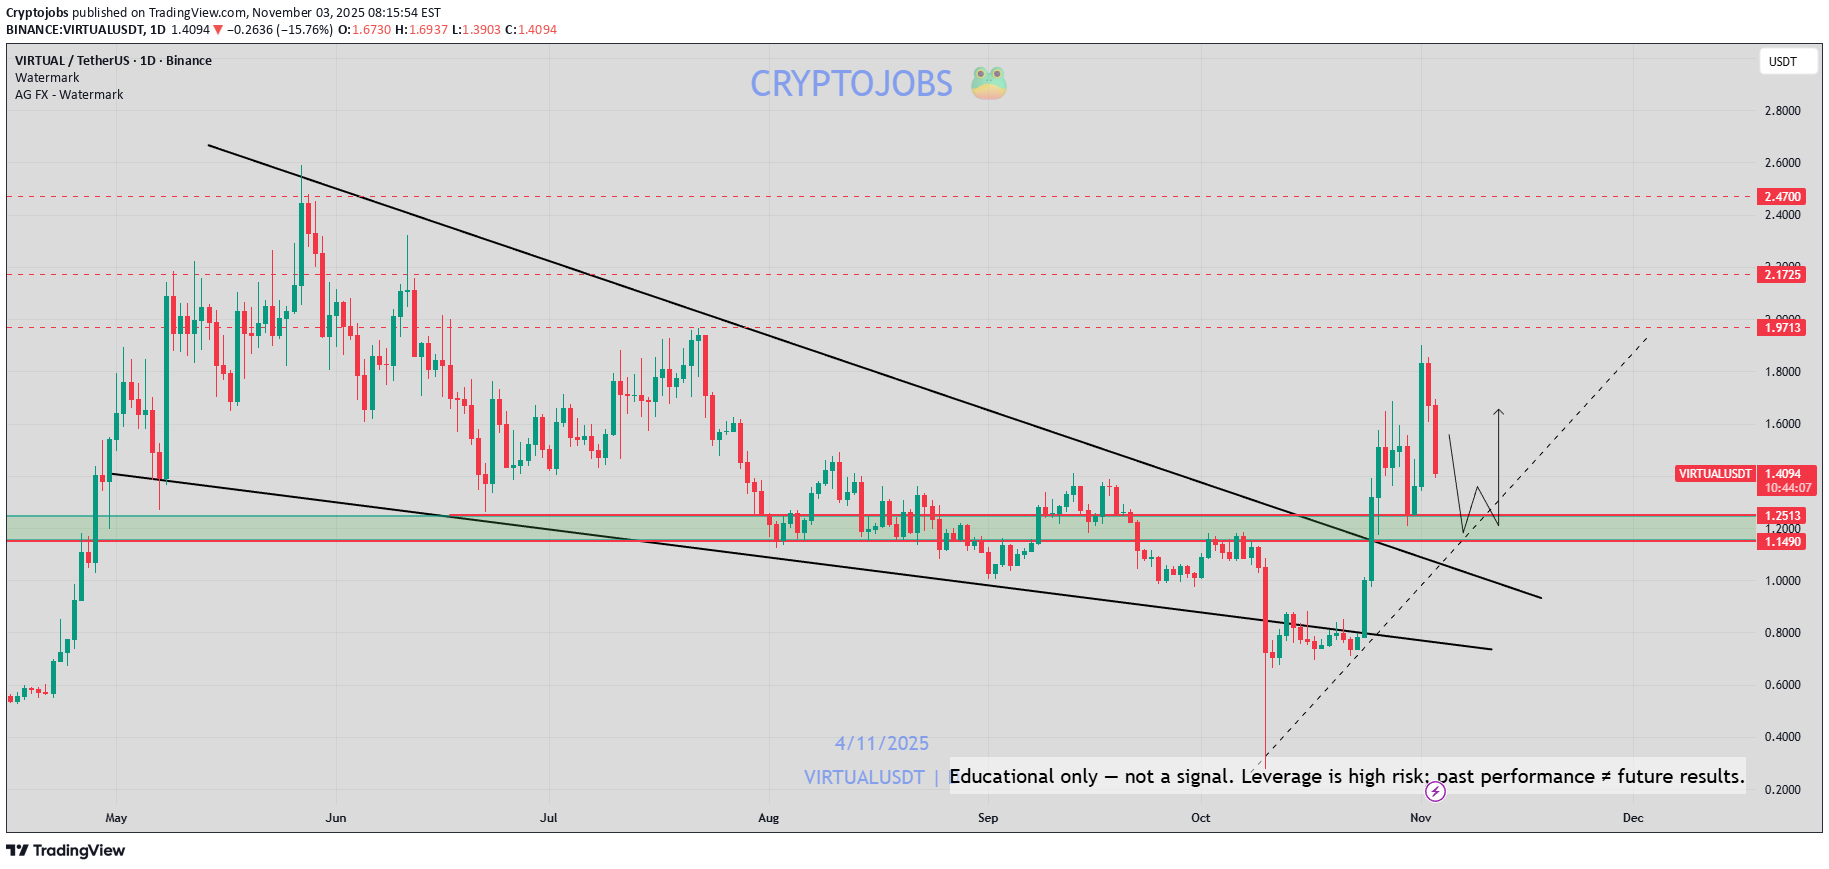
VIRTUAL - Price update: Strong sell pressure at the moment, likely because of #BTC move 📉 Currently, I keep an eye on this possible expension triangle pattern. Meaning that a successfull test of the green zone / lower trend could lead to another HH 📈 This could be a bullish retest on the daily basis. Bull territorry above 1.150$ level. (second chart). If we lose the 1.15$ then watch out for the 1.00 $ demand zone. #dyor #VIRTUAL
Alpha-GoldFX
VIRTUALUSDT: سیگنال انفجار قیمت ۹۰ درصدی در راه است؟ (الگوی گوه نزولی)
VIRTUALUSDT is displaying a promising bullish setup with the emergence of a falling wedge pattern, a classic reversal signal that often precedes a significant upward movement. This pattern indicates that the market’s selling pressure is fading, and buyers are gradually gaining control. Once a breakout occurs above the wedge resistance, it could trigger a strong bullish wave, potentially leading to a 90% to 100% gain. Traders are closely monitoring this setup, as the technical outlook suggests a solid opportunity for a sustained rally. The volume for VIRTUALUSDT remains strong, reflecting growing market confidence and increasing investor participation. Such healthy trading activity adds weight to the possibility of a successful breakout, as volume confirmation is a key factor in validating bullish reversals. A spike in volume on the breakout could serve as a clear signal for momentum traders to enter, further accelerating price appreciation. Investor sentiment around VIRTUALUSDT continues to improve as more participants recognize its potential upside from current levels. The alignment of technical strength, good liquidity, and improving interest suggests that this pair could outperform in the coming sessions. Traders keeping an eye on this coin may find it to be one of the more attractive short-to-medium-term setups on the market right now. ✅ Show your support by hitting the like button and ✅ Leaving a comment below! (What is You opinion about this Coin) Your feedback and engagement keep me inspired to share more insightful market analysis with you!
Disclaimer
Any content and materials included in Sahmeto's website and official communication channels are a compilation of personal opinions and analyses and are not binding. They do not constitute any recommendation for buying, selling, entering or exiting the stock market and cryptocurrency market. Also, all news and analyses included in the website and channels are merely republished information from official and unofficial domestic and foreign sources, and it is obvious that users of the said content are responsible for following up and ensuring the authenticity and accuracy of the materials. Therefore, while disclaiming responsibility, it is declared that the responsibility for any decision-making, action, and potential profit and loss in the capital market and cryptocurrency market lies with the trader.