
VET
VeChain
| تریدر | نوع سیگنال | حد سود/ضرر | زمان انتشار | مشاهده پیام |
|---|---|---|---|---|
 AlvinDeo96Rank: 1319 | خرید | حد سود: تعیین نشده حد ضرر: تعیین نشده | 7 hour ago | |
 CryptoAnalystSignalRank: 30933 | خرید | حد سود: تعیین نشده حد ضرر: تعیین نشده | 12/17/2025 |
Price Chart of VeChain
سود 3 Months :
سیگنالهای VeChain
Filter
Sort messages by
Trader Type
Time Frame
AlvinDeo96
Relief Rally Inbound?
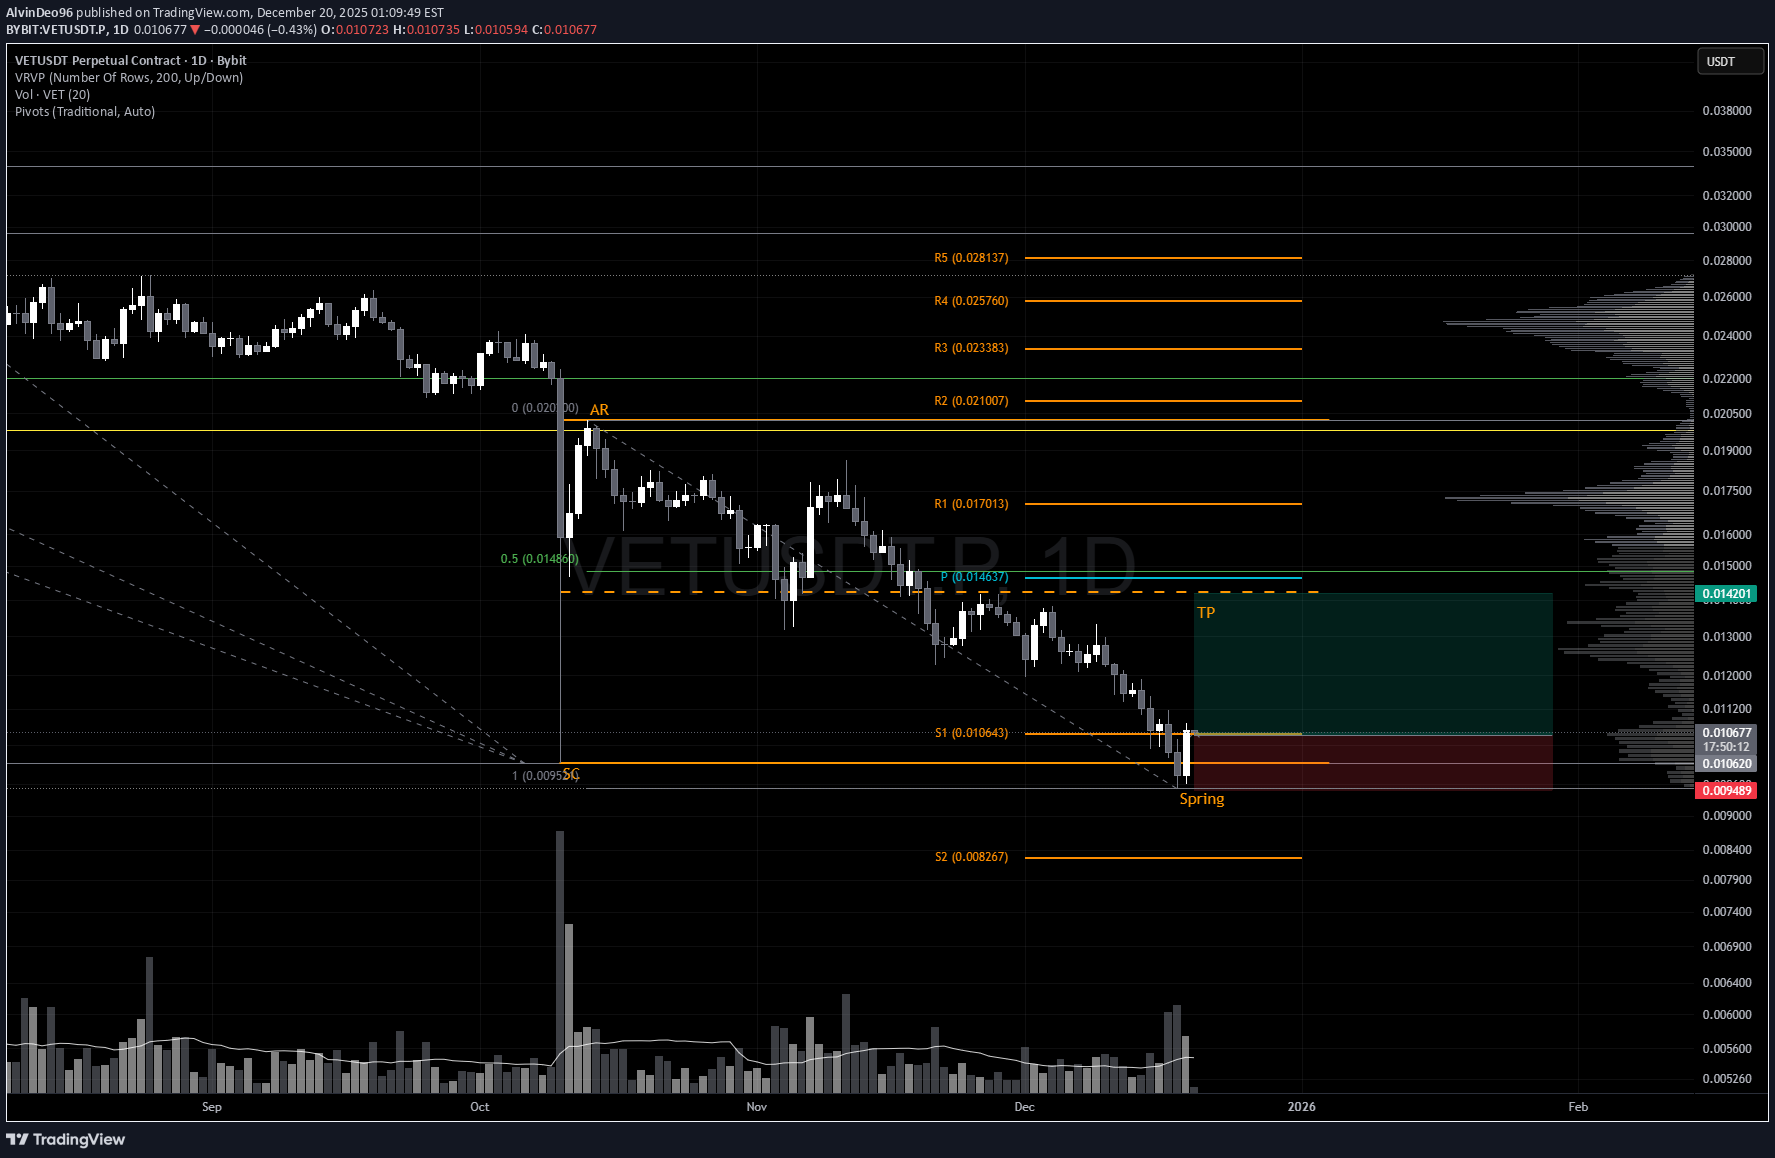
VET is shaping up for a potential reversal. After the aggressive October 10 sell‑off, price responded with a clean Automatic Rally (AR) before rolling over into a controlled pullback. This latest dip appears to be sweeping the October 10 lows, and the December 19 bullish engulfing candle is the first meaningful sign of demand stepping back in. Crucially, price closed back inside the prior range, which keeps the structure constructive. While heavier volume on the reversal would’ve added confidence, the low‑volume nature of the sweep actually supports a spring narrative — supply has been drying up for weeks, and there’s been no evidence of aggressive selling pressure. That’s exactly what you want to see heading into a potential Wyckoff spring. Trade Scenario Initial TP would be just below the range EQ which lines up with the yearly pivot and 50% of the range retracement. From here, if the price can close, hold and form higher lows above this level, would strongly suggest that a bottom is in. The next meaningful upside target sits around $0.0194, where prior resistance and structural alignment converge. Market Context A surprising number of alts are printing similar spring‑like structures right now: • Washed‑out lows • Diminishing volume • Reclaims back into range • Early signs of demand returning
CryptoAnalystSignal
#VET/USDT Traders watch VeChain 10% upside targeting 0.01176 ?
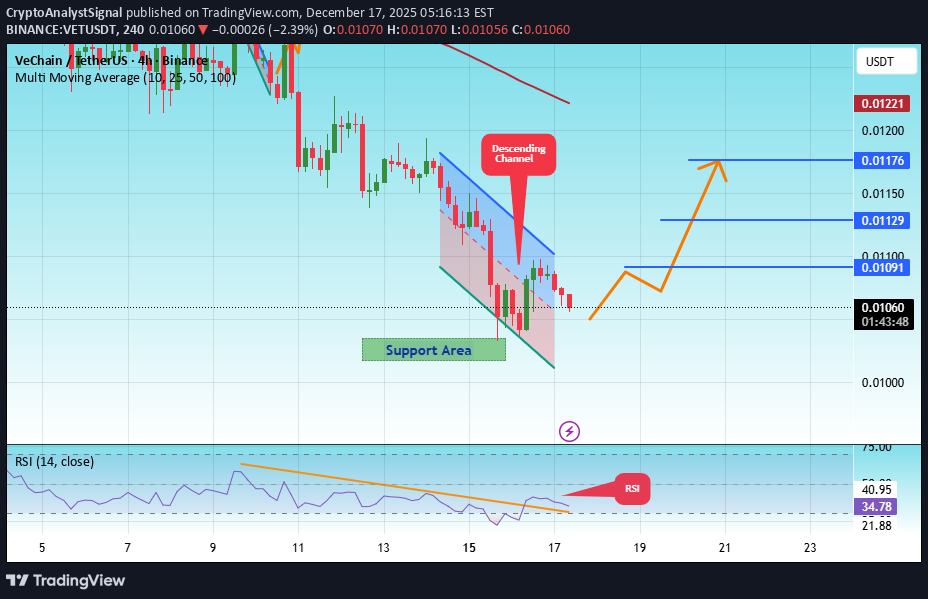
#VET The price is moving in a descending channel on the 1-hour timeframe. It has reached the lower boundary and is heading towards breaking above it, with a retest of the upper boundary expected. We have a downtrend on the RSI indicator, which has reached near the lower boundary, and an upward rebound is expected. There is a key support zone in green at 0.01022. The price has bounced from this level multiple times and is expected to bounce again. We have a trend towards consolidation above the 100-period moving average, as we are moving close to it, which supports the upward movement. Entry price: 0.01059 First target: 0.01090 Second target: 0.01129 Third target: 0.01176 Don't forget a simple principle: money management. Place your stop-loss below the support zone in green. For any questions, please leave a comment. Thank you.

VET/USDT
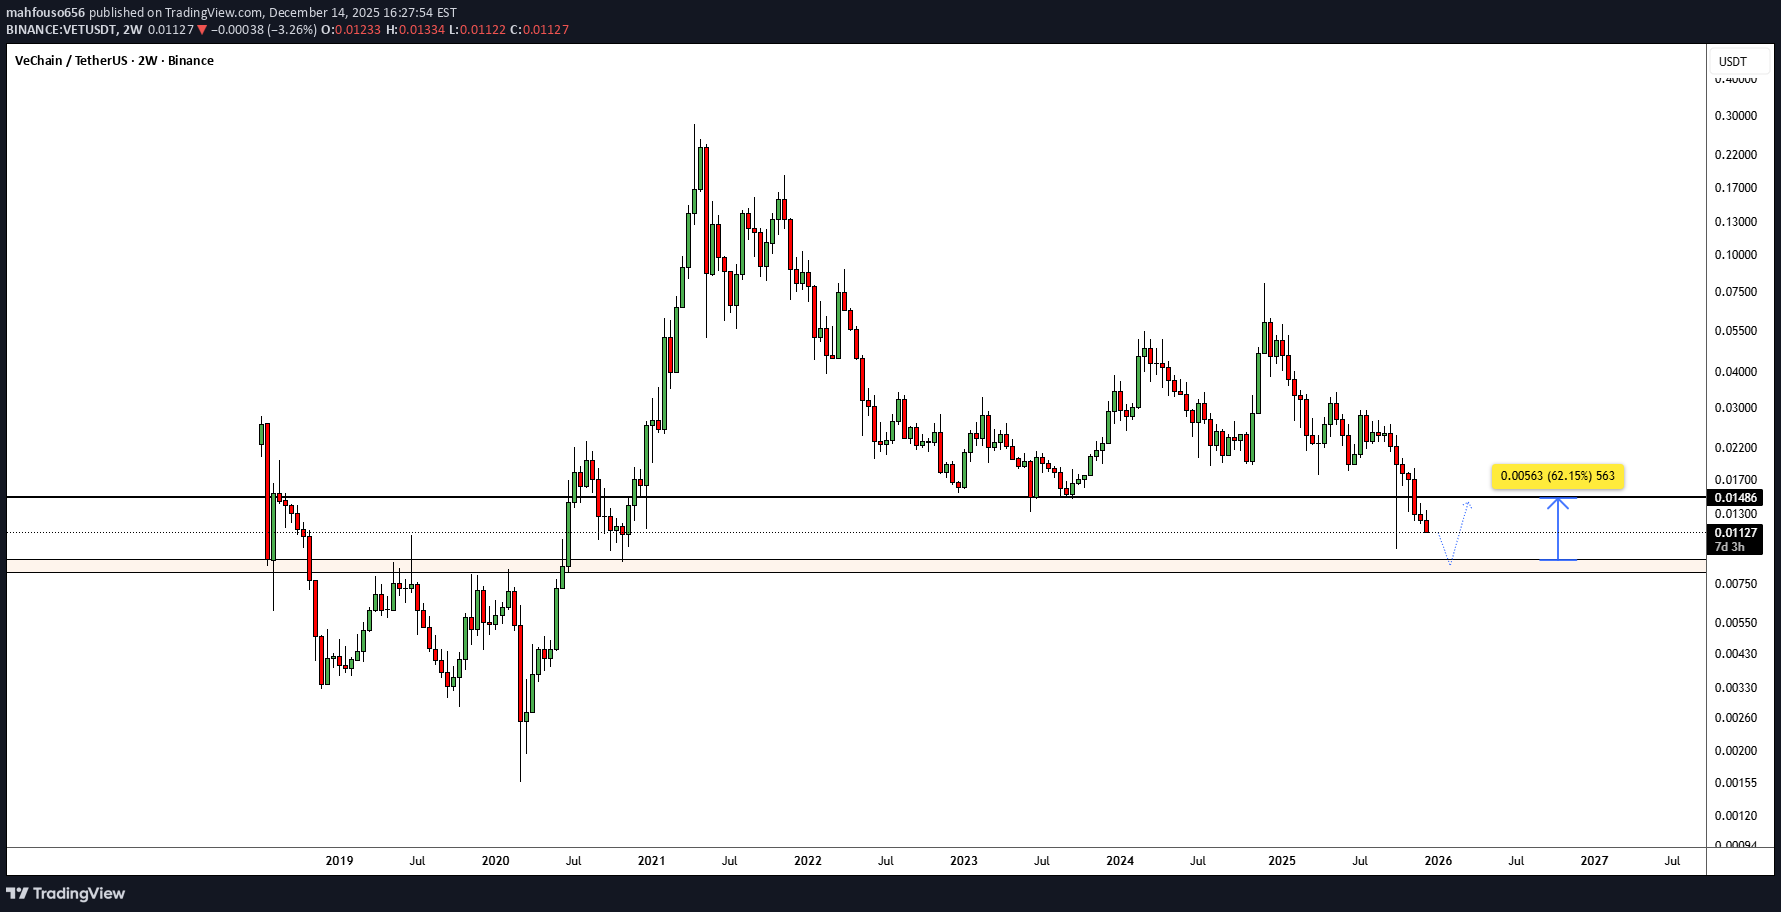
Nice opportunity on VET/USDT, waiting to reach the support level (0.00907 - 0.00820) Stop lose is whenever a weekly candle closes below the support level. Technical view only, not a financial advice.

Cryptojobs
VET - BEARISH OUTLOOK
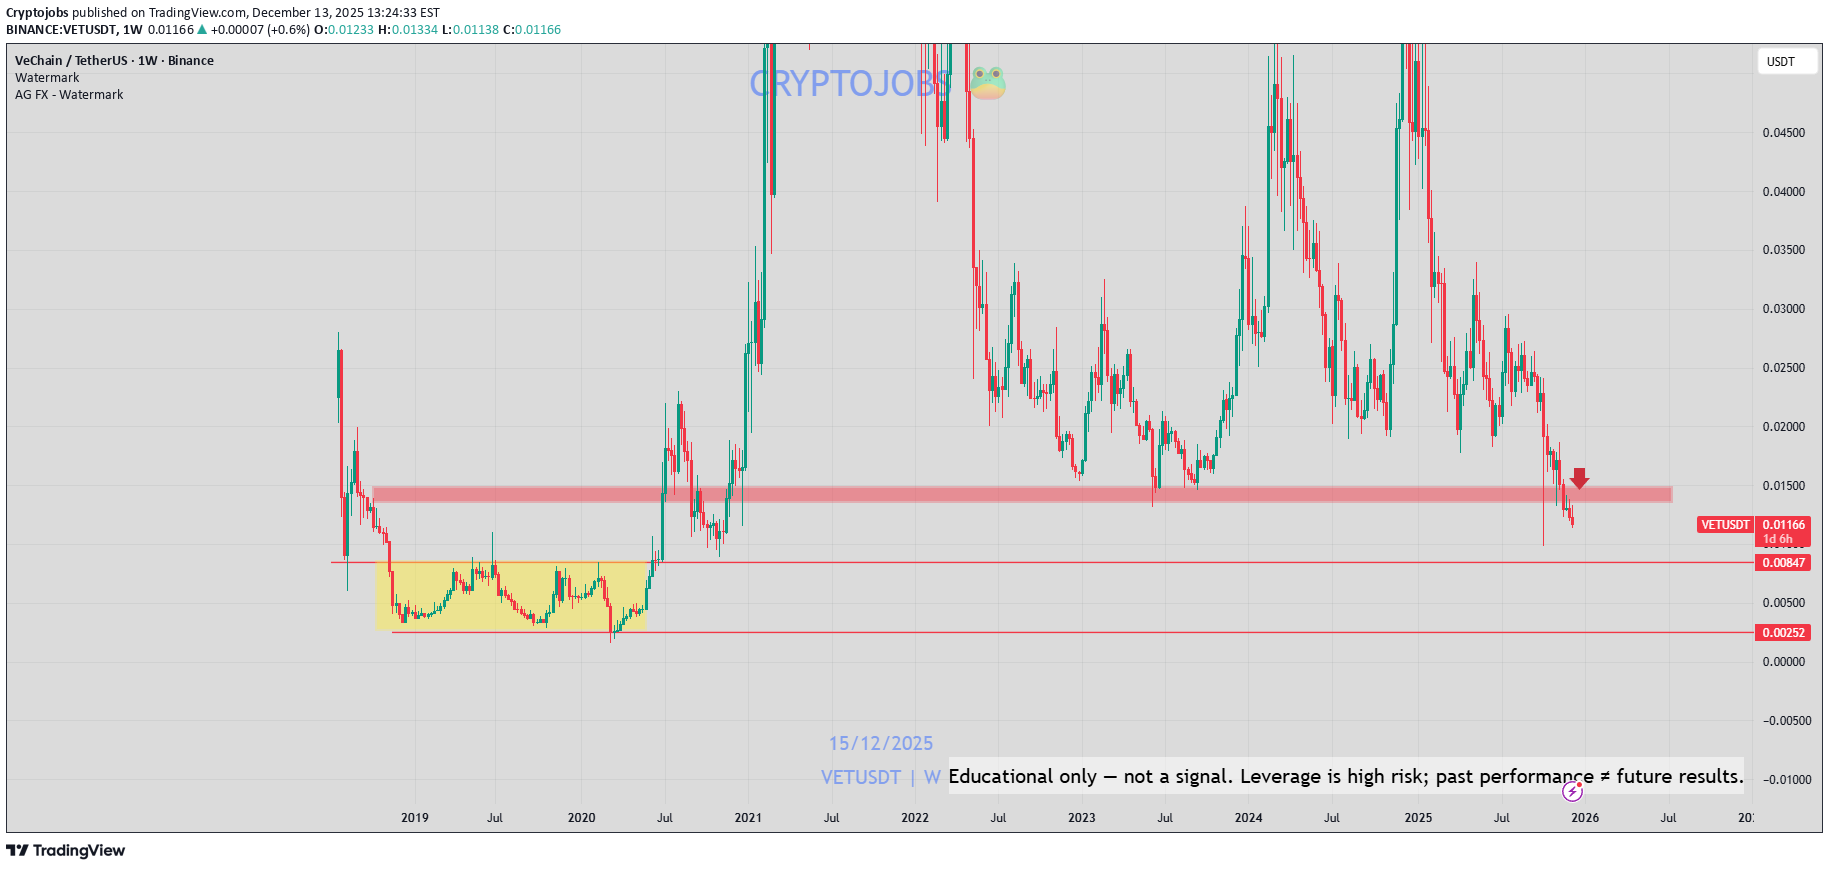
VET - Price Analysis 🟥 Very bearish chart 📉 Price confirmed a breakout under $ 0.0150, which is a multi-year support! 🚨 No buy pressure at the moment & H4 chart also looks like a bearish accumulation structure 📉 Prices could dump another 20 to 30% very easily without major support ahead. Lower key levels I see: 0.0100− 0.00870 - $ 0.006500 Market conditions are pretty bad, but the chart also reflects the lack of demand! Think about this: 2019's lowest demand/accumulation zone was around 0.0350 − 0.003300. If we move toward it, that would be another -60% bloodbath! 🚨
CryptoAnalystSignal
#VET/USDT Traders watch VeChain 10% upside targeting 0.01341 ?
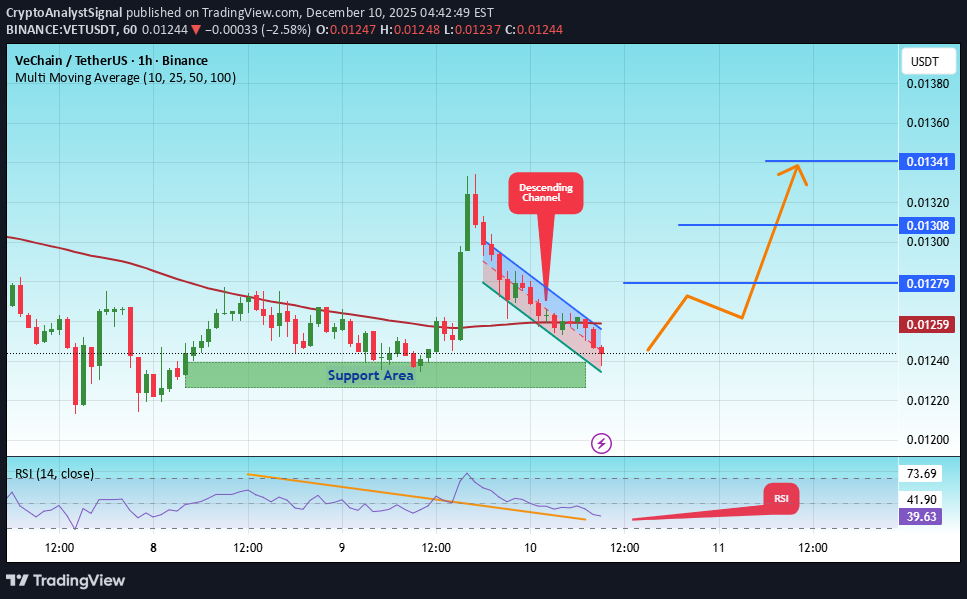
#VET The price is moving in a descending channel on the 1-hour timeframe. It has reached the lower boundary and is heading towards breaking above it, with a retest of the upper boundary expected. We have a downtrend on the RSI indicator, which has reached near the lower boundary, and an upward rebound is expected. There is a key support zone in green at 0.01230. The price has bounced from this zone multiple times and is expected to bounce again. We have a trend towards stability above the 100-period moving average, as we are moving close to it, which supports the upward movement. Entry price: 0.01243 First target: 0.01280 Second target: 0.01308 Third target: 0.01341 Don't forget a simple principle: money management. Place your stop-loss below the support zone in green. For any questions, please leave a comment. Thank you.
CryptoAnalystSignal
#VET/USDT Traders watch VeChain 10% upside targeting 0.01340?
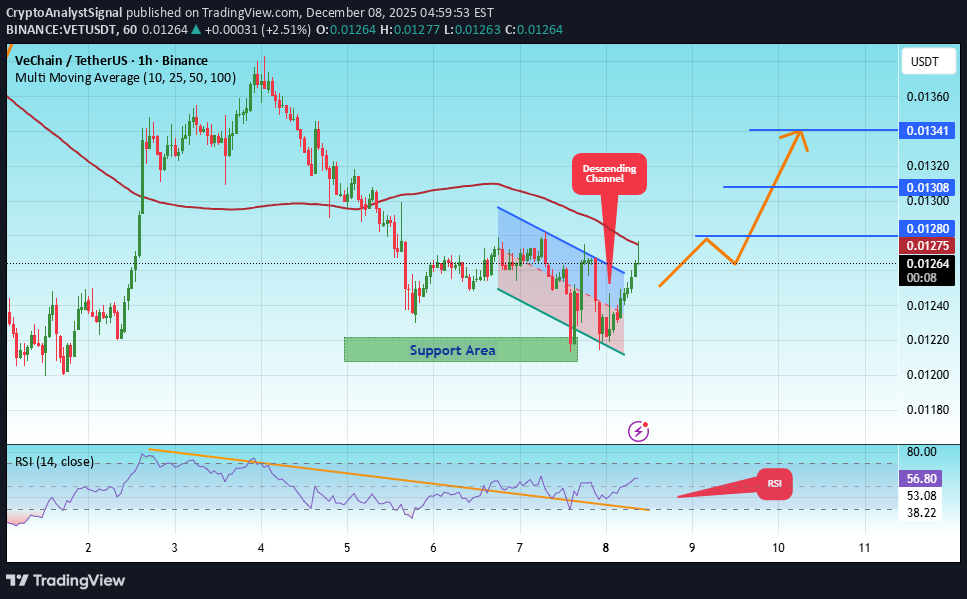
#VET The price is moving in a descending channel on the 1-hour timeframe. It has reached the lower boundary and is heading towards breaking above it, with a retest of the upper boundary expected. We have a downtrend on the RSI indicator, which has reached near the lower boundary, and an upward rebound is expected. There is a key support zone in green at 0.01212. The price has bounced from this level multiple times and is expected to bounce again. We have a trend towards consolidation above the 100-period moving average, as we are moving close to it, which supports the upward movement. Entry price: 0.01264 First target: 0.01280 Second target: 0.01300 Third target: 0.01340 Don't forget a simple principle: money management. Place your stop-loss order below the support zone in green. For any questions, please leave a comment. Thank you.#VET First target: 0.01280 Reached Second target: 0.01300 Reached Third target: 0.01340 Reached

Bithereum_io
تحلیل VET/USDT: آماده انفجار؟ سطوح کلیدی خروج از گُوِه نزولی!
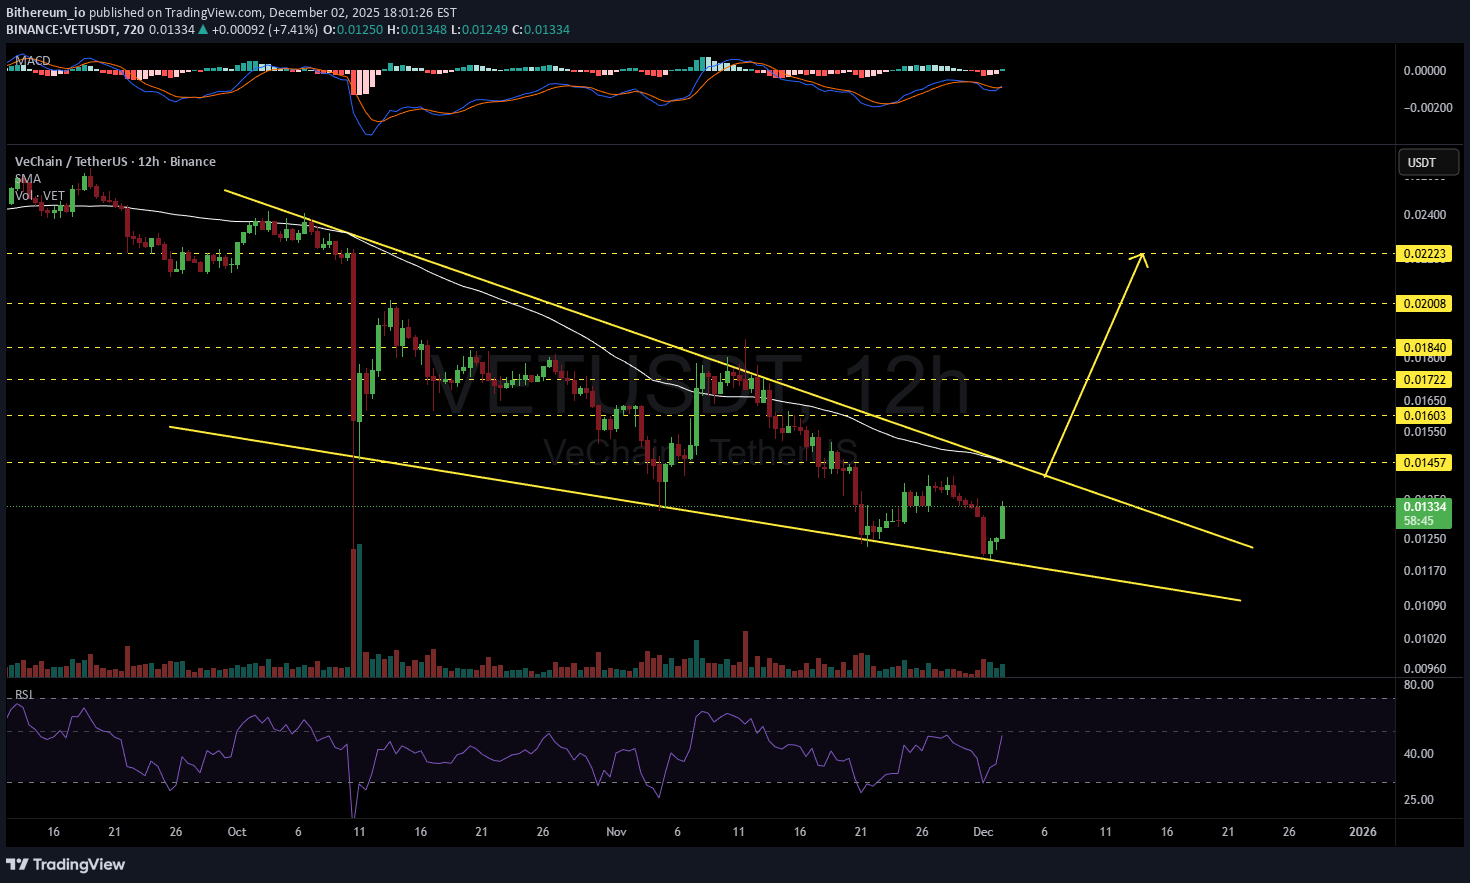
#VET is moving inside a falling wedge pattern on the 12H timeframe chart. In case of a breakout above the wedge resistance and the 12H SMA50, the potential targets are: 🎯 $0.01457 🎯 $0.01603 🎯 $0.01722 🎯 $0.01840 🎯 $0.02008 🎯 $0.02223 ⚠️ Always remember to protect your capital with a proper stop-loss and disciplined risk management.
CryptoAnalystSignal
آیا وِیچِین (VET) تا ۰.۰۱۴۴۱ بالا میرود؟ تحلیل حرکت ۱۰ درصدی قیمت
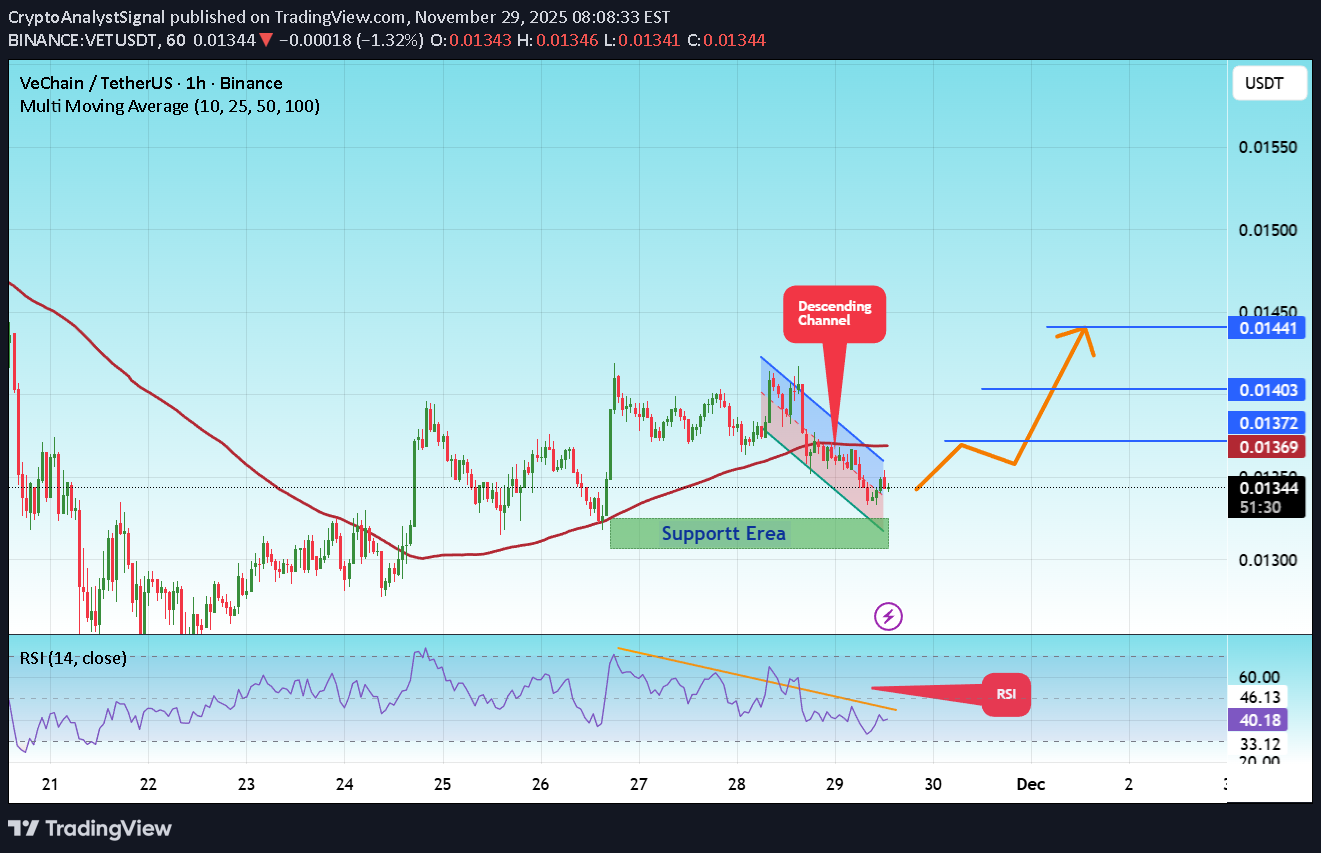
#VET The price is moving in a descending channel on the 1-hour timeframe. It has reached the lower boundary and is heading towards a breakout, with a retest of the upper boundary expected. We are seeing a bearish bias in the Relative Strength Index (RSI), which has reached near the lower boundary, and an upward bounce is expected. There is a key support zone in green at 0.01320. The price has bounced from this level several times and is expected to bounce again. We are seeing a trend towards stabilizing above the 100-period moving average, which we are approaching, supporting the upward trend. Entry Price: 0.01345 First Target: 0.01372 Second Target: 0.01403 Third Target: 0.01441 Remember a simple principle: Money Management. Place your stop-loss order below the green support zone. For any questions, please leave a comment. Thank you.

TenderTown
تحلیل تکنیکال وِت (VET): راز انفجار قیمت در کف حمایتی!
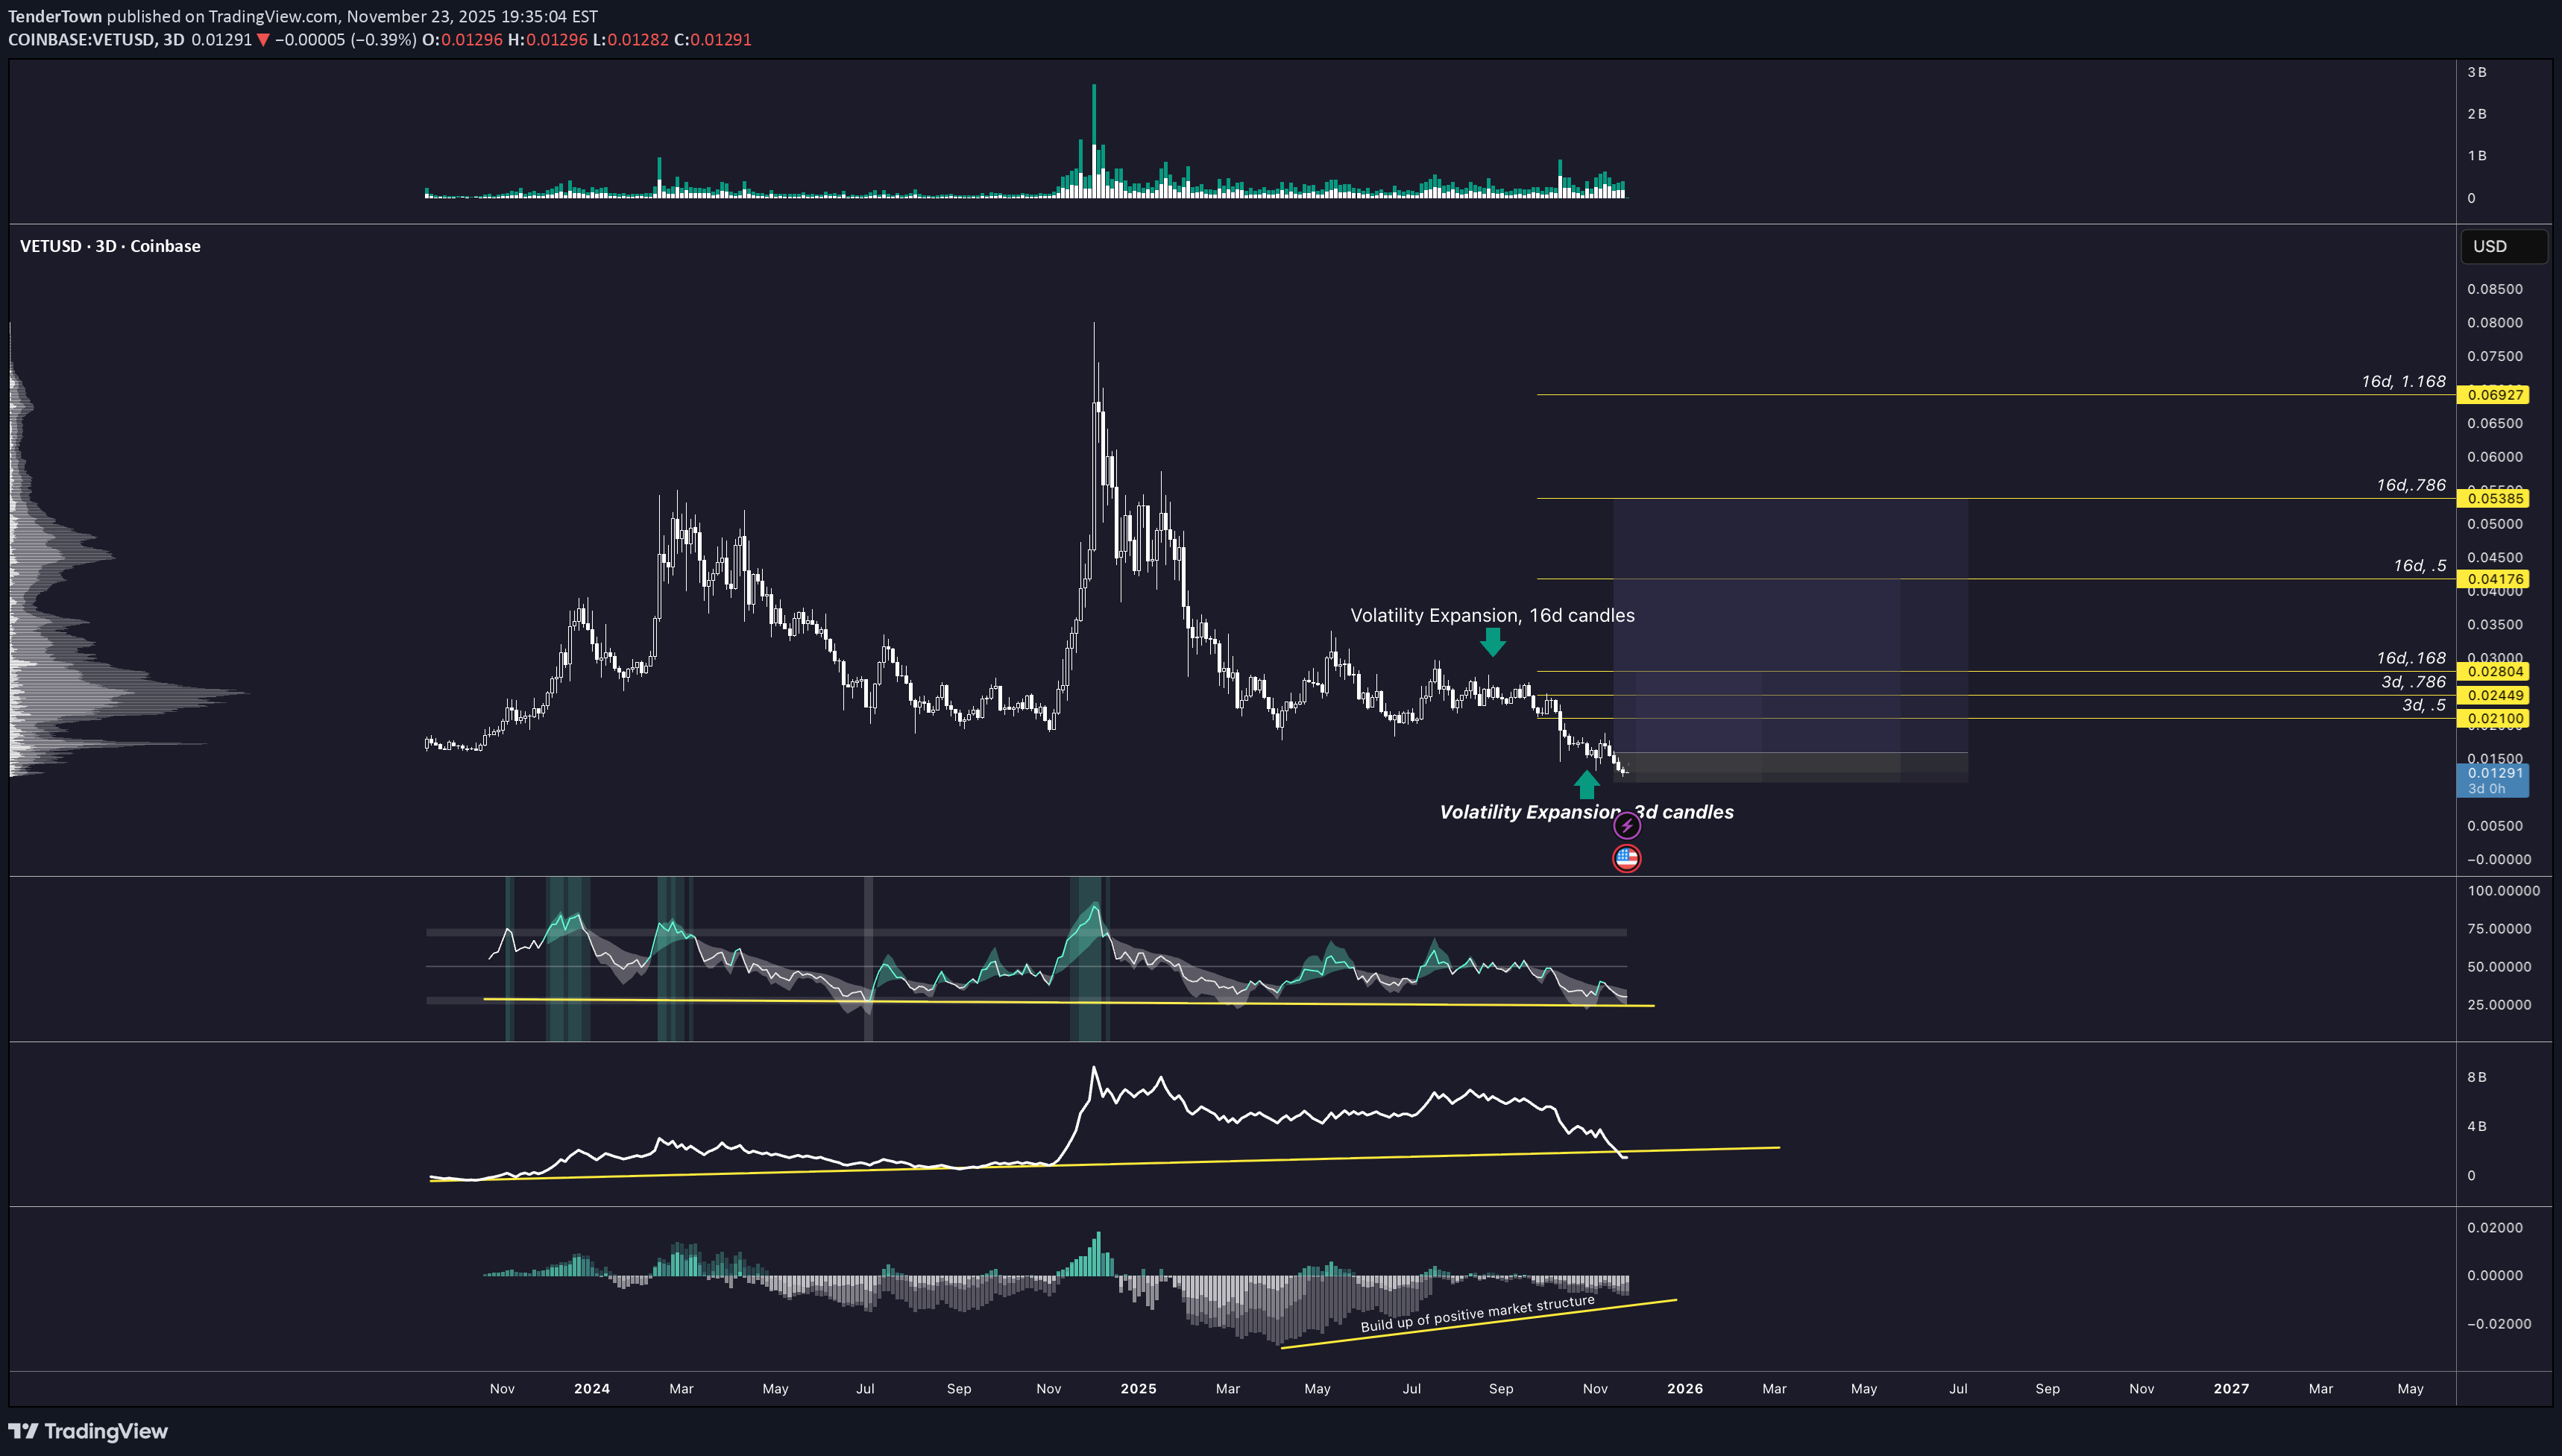
This chart highlights how VET behaves when volatility expansion occurs at major swing levels. There are two clear reference points marked. The first is the expansion that lasted sixteen candles. That move defined the prior expansion cycle and shows how price behaves when it breaks out of a compressed range with rising volatility. It also provides a baseline for cycle duration and expected reach. The second is the current three day expansion signal on the right side of the chart. Price is pressing into a multi-month support floor while the market has been contracting for an extended period. This is the same condition that preceded the last major expansion. The repeated small-range candles, declining volatility, and low momentum readings all confirm compression. The expansion targets are mapped using both the three day and sixteen day fib projections. The initial levels sit at zero point zero two four four nine and zero point zero two eight two zero four. The extended cycle levels sit at zero point zero four one seven six, zero point zero five three eight five, and zero point zero six nine two seven. These reflect the historical reach of prior volatility expansion cycles and outline the potential move if the current base holds. The shaded zones represent the probable path of expansion if volatility normalizes. The key point is that price is forming another expansion trigger at the bottom of the range while the broader structure remains unchanged. When these conditions align, the market has repeatedly responded with strong multi-week expansion cycles.

mastercrypto2020
سیگنال خرید فوری VET/USDT: کسب سود ۵ برابری با اهرم بالا!
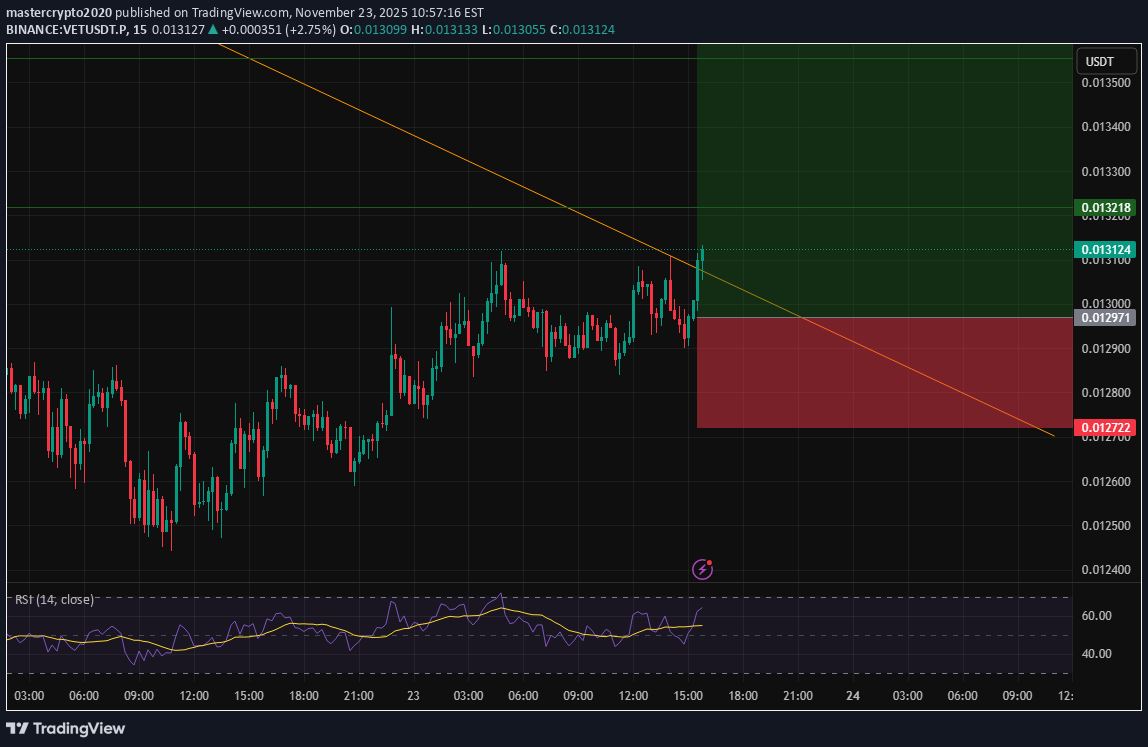
--- 📢 Official Trade Signal – VET/USDT 📈 Position Type: LONG 💰 Entry Price: 0.012970 --- 🎯 Take-Profit Targets (Partial Exits): TP1 = 0.013218 TP2 = 0.013556 TP3 = 0.013934 TP4 = 0.014329 TP5 = — --- 🛑 Stop-Loss: 0.012719 📊 Timeframe: 15m ⚖️ Risk/Reward Ratio: 5.45 💥 Suggested Leverage: 5× – 10× --- 🧠 Technical Analysis Summary VET shows strong accumulation around the 0.01280–0.01300 demand zone with early signs of bullish continuation. Market structure shift + momentum recovery indicate potential movement toward upper liquidity levels at 0.01321 and 0.01355. Targets align with key resistance zones and short-term liquidity clusters. --- ⚙️ Trade Management Rules ✔️ Take partial profit at TP1 ✔️ Move SL to Break-Even once TP1 is reached ✔️ Trail SL as price approaches TP2–TP4 ✔️ Avoid re-entry if SL is triggered ✔️ Confirm structure before entering --- ⚠️ Risk-Management Note If TP1 hits and then price returns to break-even, it is not a loss — the trade simply closed with zero risk. Capital preservation comes first. --- 📌 TradingView Hashtags #VETUSDT #VET #CryptoSignal #LongSetup #TradingView #TechnicalAnalysis #FuturesTrading #Altcoins ---
Disclaimer
Any content and materials included in Sahmeto's website and official communication channels are a compilation of personal opinions and analyses and are not binding. They do not constitute any recommendation for buying, selling, entering or exiting the stock market and cryptocurrency market. Also, all news and analyses included in the website and channels are merely republished information from official and unofficial domestic and foreign sources, and it is obvious that users of the said content are responsible for following up and ensuring the authenticity and accuracy of the materials. Therefore, while disclaiming responsibility, it is declared that the responsibility for any decision-making, action, and potential profit and loss in the capital market and cryptocurrency market lies with the trader.