
UTK
Utrust
| تریدر | نوع سیگنال | حد سود/ضرر | زمان انتشار | مشاهده پیام |
|---|---|---|---|---|
No results found. | ||||
Price Chart of Utrust
سود 3 Months :
سیگنالهای Utrust
Filter
Sort messages by
Trader Type
Time Frame

Asjack
UTKUSDT

$UTK ready for a huge breakout? -- No financial advice DYOR --

Proyeccion UTK

Proyeccion mediano plazo UTK, antes de moverse al alza.

pericles90
UTK Xmoney: Bullish Reversal in Sight?
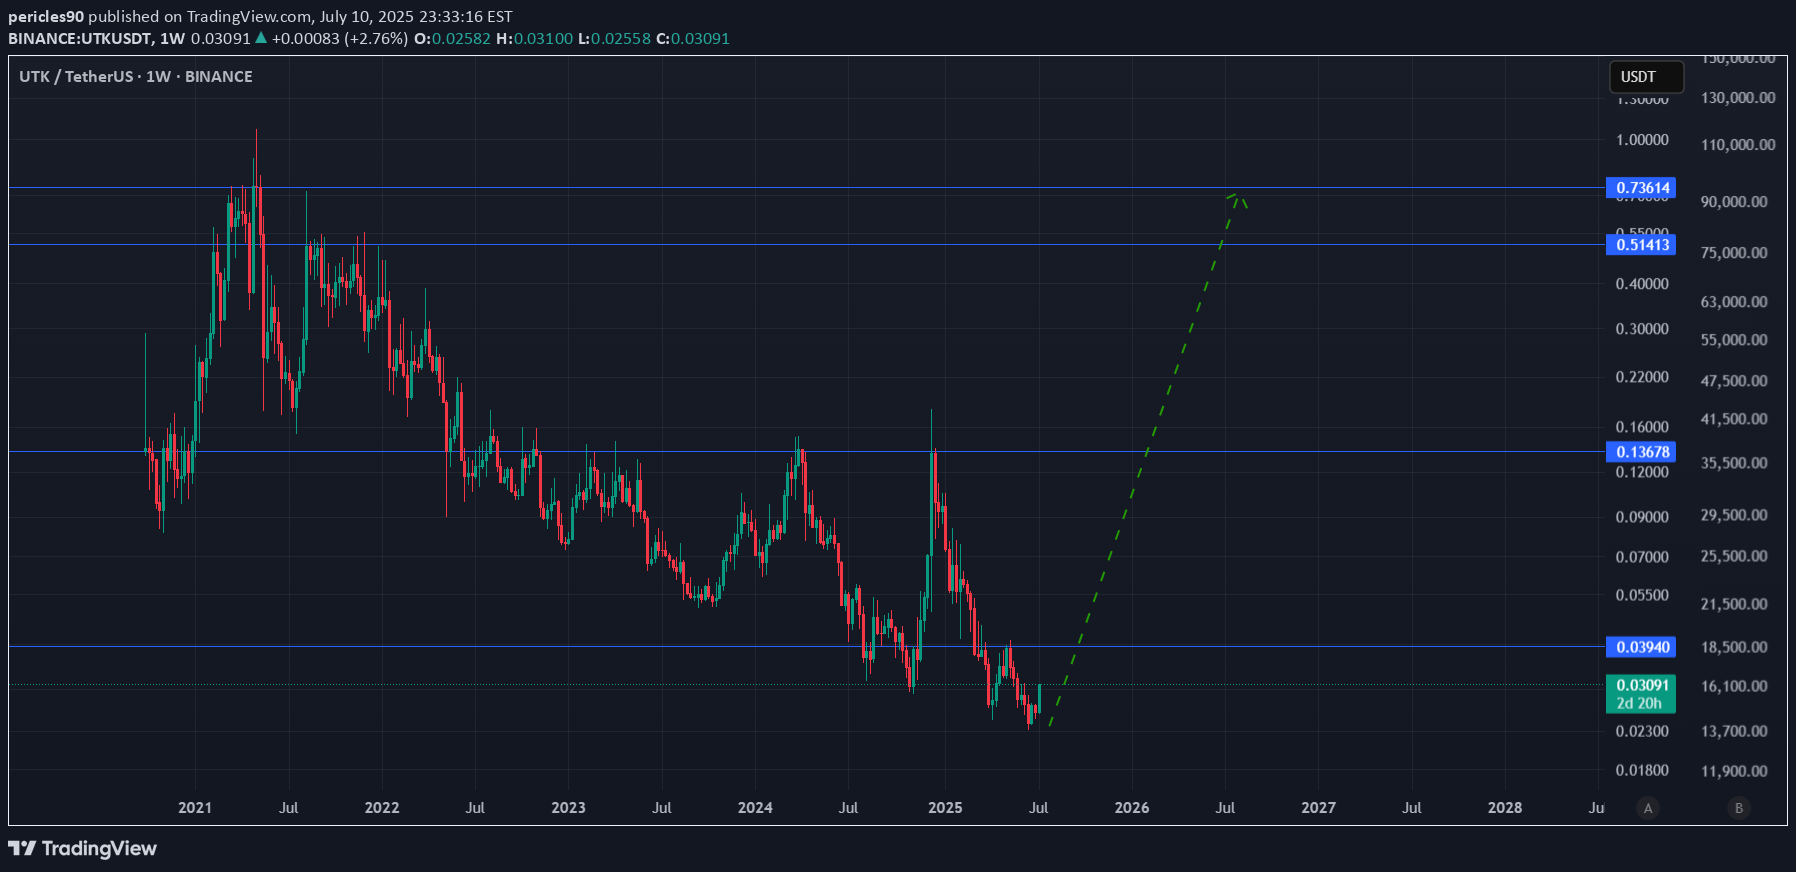
After a prolonged bearish trend, UTK Xmoney appears to be forming a strong bottom near the $0.03–$0.04 range. The weekly chart suggests that the asset may be entering a new bullish cycle, especially considering the previous historical support and resistance levels.My projection (green dotted line) envisions a gradual recovery, with UTK breaking through key resistances at $0.13678 and $0.51413, aiming for the $0.73614 region by 2026. This scenario is based on:Technical Analysis: Multiple rejections of the lower support zone and historical pattern of strong upswings after prolonged accumulation periods.Market Sentiment: Increasing adoption of Xmoney’s payment solutions, partnerships, and overall crypto market cycles.Risk Management: If the $0.03940 support fails, downside risk increases significantly.Trade Idea:Long-term position from current levels ($0.03–$0.04) targeting $0.73, with partial profit-taking at $0.13 and $0.51. Stop-loss below $0.039.Disclaimer:This analysis is for informational purposes only and not financial advice. Always do your own research.

MasterAnanda
Utrust Bottom Confirmed & Easy 663% Bullish Target

What's really great about the Altcoins right now is that the bottom is already confirmed. In this chart it comes as a rounded bottom.UTKUSDT is trading above long-term support, the August 2024 low. The bottom formed below this level, orange line on the chart, and now that the pair recovered all that is left is for the bulls to step in, hit the gas.Trading volume is null, almost zero until March 2025. When the lowest prices ever becoming available, there is a massive influx of capital and trading volume goes up. Everybody loves bottom prices when the market is set to grow.So the signals are the rounded bottom, the broken downtrend and a rise in volume —drop and recovery above long-term support.The next move is already here and is part of a broader bullish cycle, the 2025 bull market. First, there will be a rise leading to a higher high, the 663% mapped on the chart. After a strong resistance level is hit, there can be a correction. This correction will end in a higher low followed by additional growth.This additional growth will be the final portion of the bullish impulse, the bull run. Easy buy and hold.Patience is key. The market will grow.The bullish signals are fully confirmed here. This means that probabilities are high for a new bullish wave. Let's say 99% chance that prices will rise and 1% chance that there will be a bear market next.Namaste.

Zorroreny
UTK about to start journey to new ATH

UTK did deep and long correction and is now ready for new impulse up. We are oversold, have longterm bullish divergence, have broken major diagonal resistance line and are now above it.Looking with pattern we see similarity with OM and if we are to do the same move then we can expect strong puch all the way to fibb 1.618 extension (same 500x move as OM did) and at the end you already know what awaits us - OM being canary in the coalmine...

CryptoNuclear

CryptoNuclear


PhoenixBlue
UTK - X Money meets XMoney?

If X Money is in any way related to XMoney, then this is going straight to $1+ xMoneyGreg has recently taken over, and X (twitter) has decided to rebrand its payments from x Payments to X Money. All this when xMoney is looking to raise a round and they have EU compliance through for both FIAT and Crypto. For Crypto, they have a Virtual Asset Service Provider licensing approved by the Central Bank of portugal (bportugal.pt/en/page/registration-virtual-assets-service-providers) For Fiat, they are an e-money institution licensed by the National Bank of Romania via their acquisition of TwisPay (twispay.com/en/about/) (multiversx.com/blog/romanian-central-bank-approves-twispay-acquisition) Now, XMoney.com is the home of the UTK token, which is on the MultiversX (EGLD) Blockchain. This is quite compelling, both from a Technical point of view and from a fundamental perspective.From a technical perspective we see a huge bull flag accumulation on massive volume. Why the sudden purchase by so many? This pull back presents an excellent R-R entry point. Connecting the dots from a fundamental perspective is an exercise for the reader. I may be very bullish on UTK, but remember to DYOR on speculation. Where there is smoke, there fire

rainbow_sniper
Prepare to BUY Spot UTKUSDT (D1 Cycle)

Prepare to BUY Spot UTKUSDT (D1 Cycle)🌟 Capture the Opportunity with UTKUSDT! 🌟🌍 Market Overview:UTKUSDT shows strong potential for upward movement on the D1 timeframe, making it an excellent setup for mid-term gains.📊 Trade Plan:📌 Entry Point: Around $0.089 – Setup RainBow MG3 indicator to signal BUY on H4.🎯 Target: $0.10 - $0.12 – Targeting significant short-term gains.⏳ Hold Time: 1-2 weeks – Strategically aligned with the D1 trend.💡 Note: This is not financial advice. Always DYOR before trading.🔥 UTKUSDT is positioned for a solid move – Get ready to act! 🔥

CryptoAdana
UTK/USDT TEKNİK ANALİZİ

* Coin : UTK/USDT* Chart timeframe : 1 Day*AI BUY : 10.11.2024 ✅* Supportive Side Condition :➡️ Change Candle Color➡️ EngineeringRobo Cloud✅* People's pulse : GREEN 4 ✅* Correlation with BTC; 0.44* Volatility ; % 31.63* 24 Hour Volume : LOW* Smart Money (Following whales) : IN✅*The downward trend breakout has occurred. ✅➡️5/5 perfect ✅Strategy;➡️ AI Buy with BUY, 10.11.2024➡️ AI Make some profit on Take Profit signals and resistance levels,➡️ AI Wait until you see SELL. I wish you plenty of profits. The investment information, comments and recommendations contained herein are not within the scope of investment consultancy. Investment consultancy service is provided within the framework of the investment consultancy agreement to be signed between brokerage firms, portfolio management companies, banks that do not accept deposits and the customer. The comments and recommendations contained herein are based on the personal opinions of those who make comments and recommendations. These opinions may not be suitable for your financial situation and risk and return preferences. For this reason, making an investment decision based solely on the information contained herein may not produce results that meet your expectations.
Disclaimer
Any content and materials included in Sahmeto's website and official communication channels are a compilation of personal opinions and analyses and are not binding. They do not constitute any recommendation for buying, selling, entering or exiting the stock market and cryptocurrency market. Also, all news and analyses included in the website and channels are merely republished information from official and unofficial domestic and foreign sources, and it is obvious that users of the said content are responsible for following up and ensuring the authenticity and accuracy of the materials. Therefore, while disclaiming responsibility, it is declared that the responsibility for any decision-making, action, and potential profit and loss in the capital market and cryptocurrency market lies with the trader.