
TAO
Bittensor
| تریدر | نوع سیگنال | حد سود/ضرر | زمان انتشار | مشاهده پیام |
|---|---|---|---|---|
 TheSignalystRank: 2947 | خرید | حد سود: تعیین نشده حد ضرر: تعیین نشده | 11/20/2025 | |
 Senku010Rank: 5352 | فروش | حد سود: تعیین نشده حد ضرر: تعیین نشده | 11/20/2025 |
Price Chart of Bittensor
سود 3 Months :
خلاصه سیگنالهای Bittensor
سیگنالهای Bittensor
Filter
Sort messages by
Trader Type
Time Frame
Senku010
تحلیل تکنیکال TAOUSDT: راز ورود در مدل خرس (Downtrend) برملا شد!
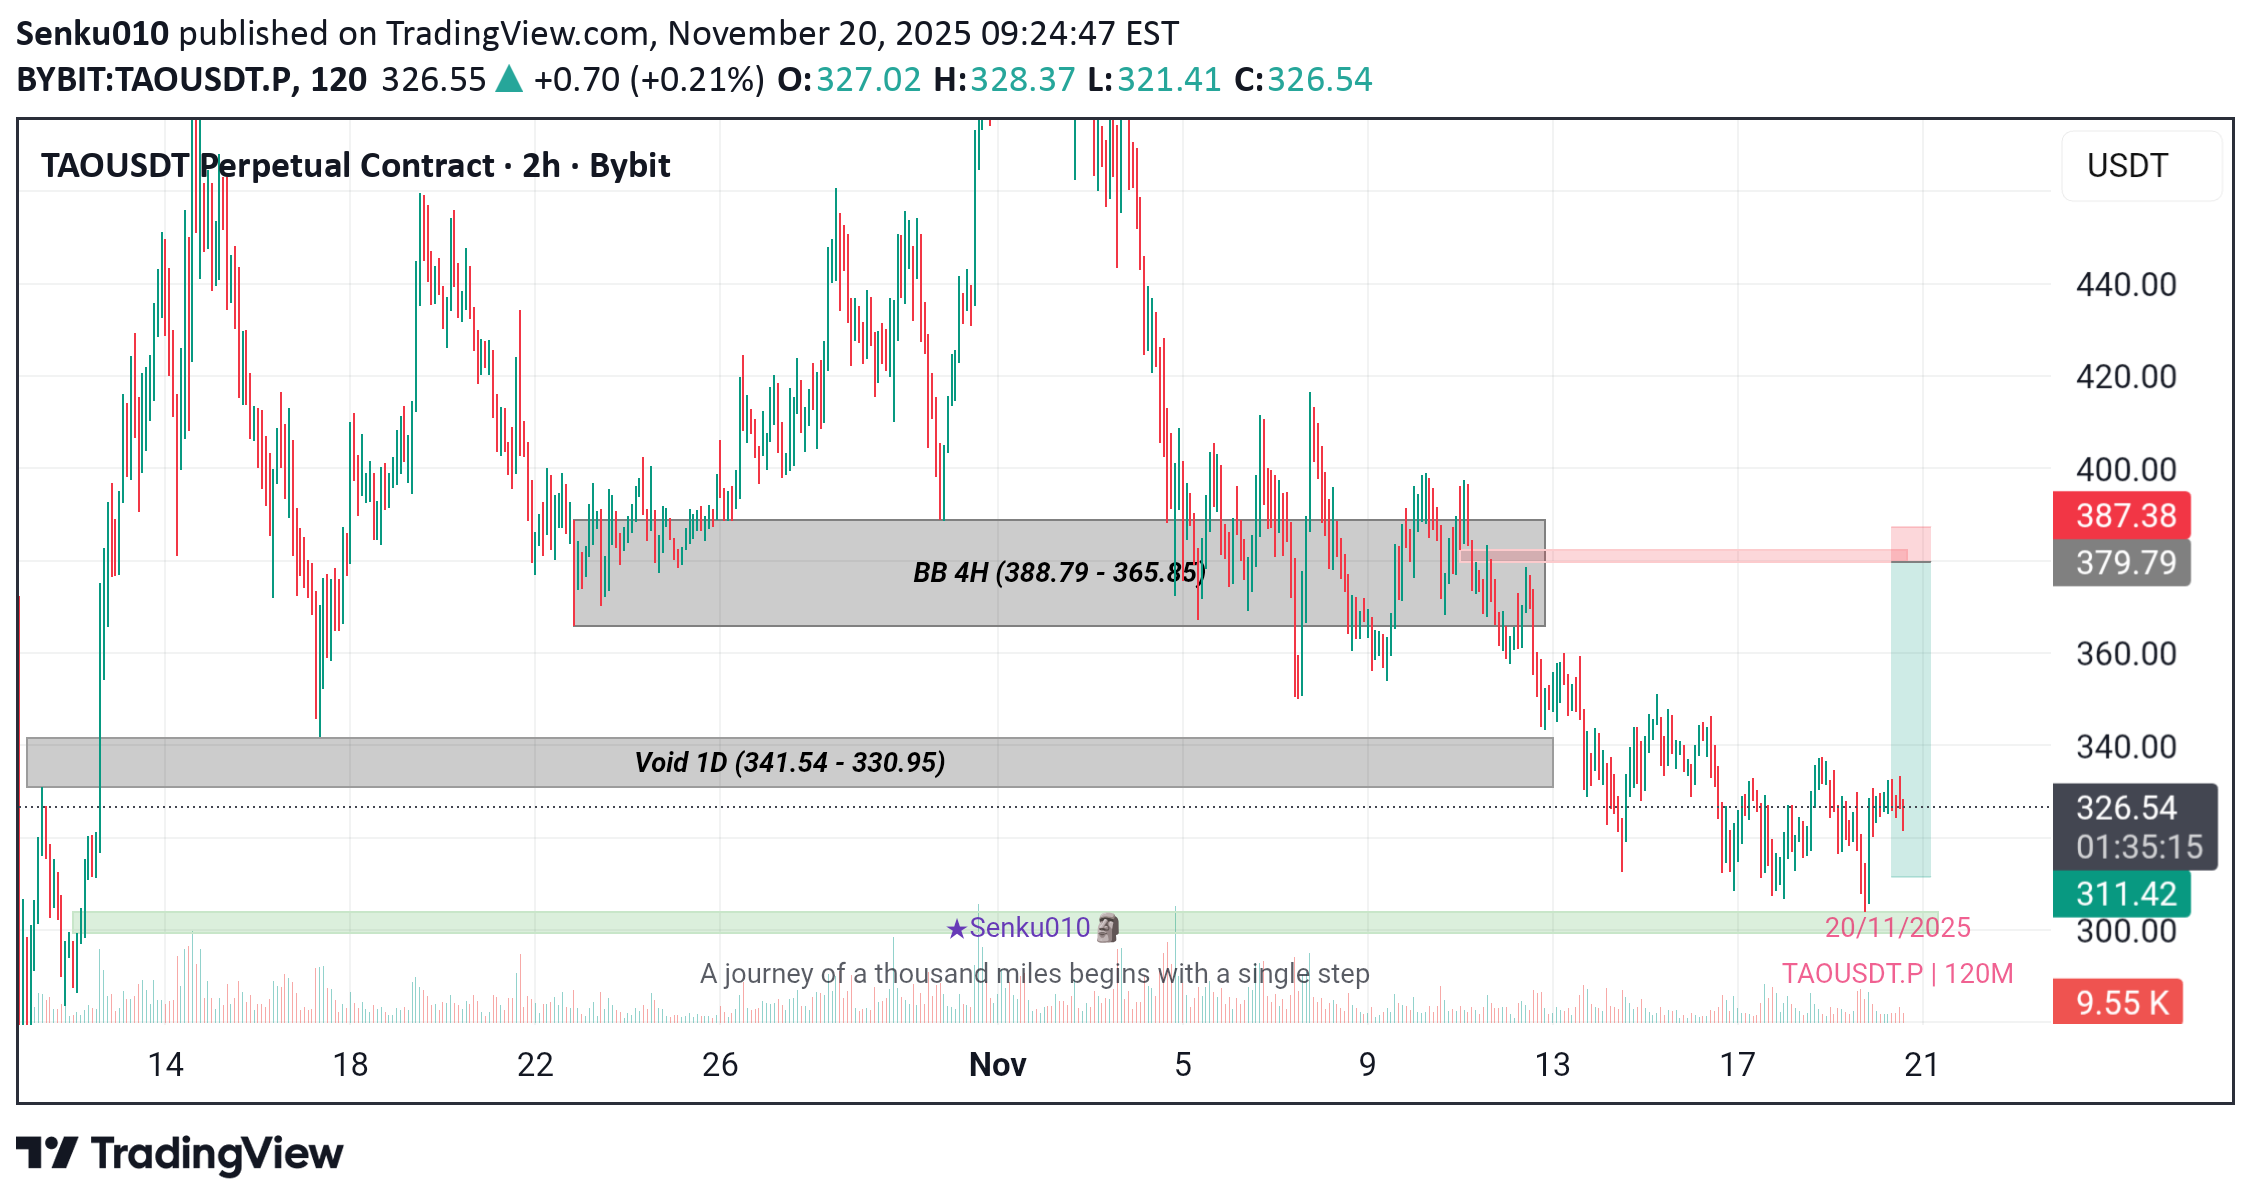
• Directional Bias: The macro-bias is a Strong Downtrend • validated by the mitigation of two major higher timeframe imbalances: the {Void 1D} at 542.04 - 502.45 and the {Void 1D} at 341.54 - 330.95 overhead supply has been satisfied, clearing the path for the decline
TheSignalyst
رمزگشایی ساده: استراتژی معاملاتی TAO در محدوده حمایت و مقاومت!
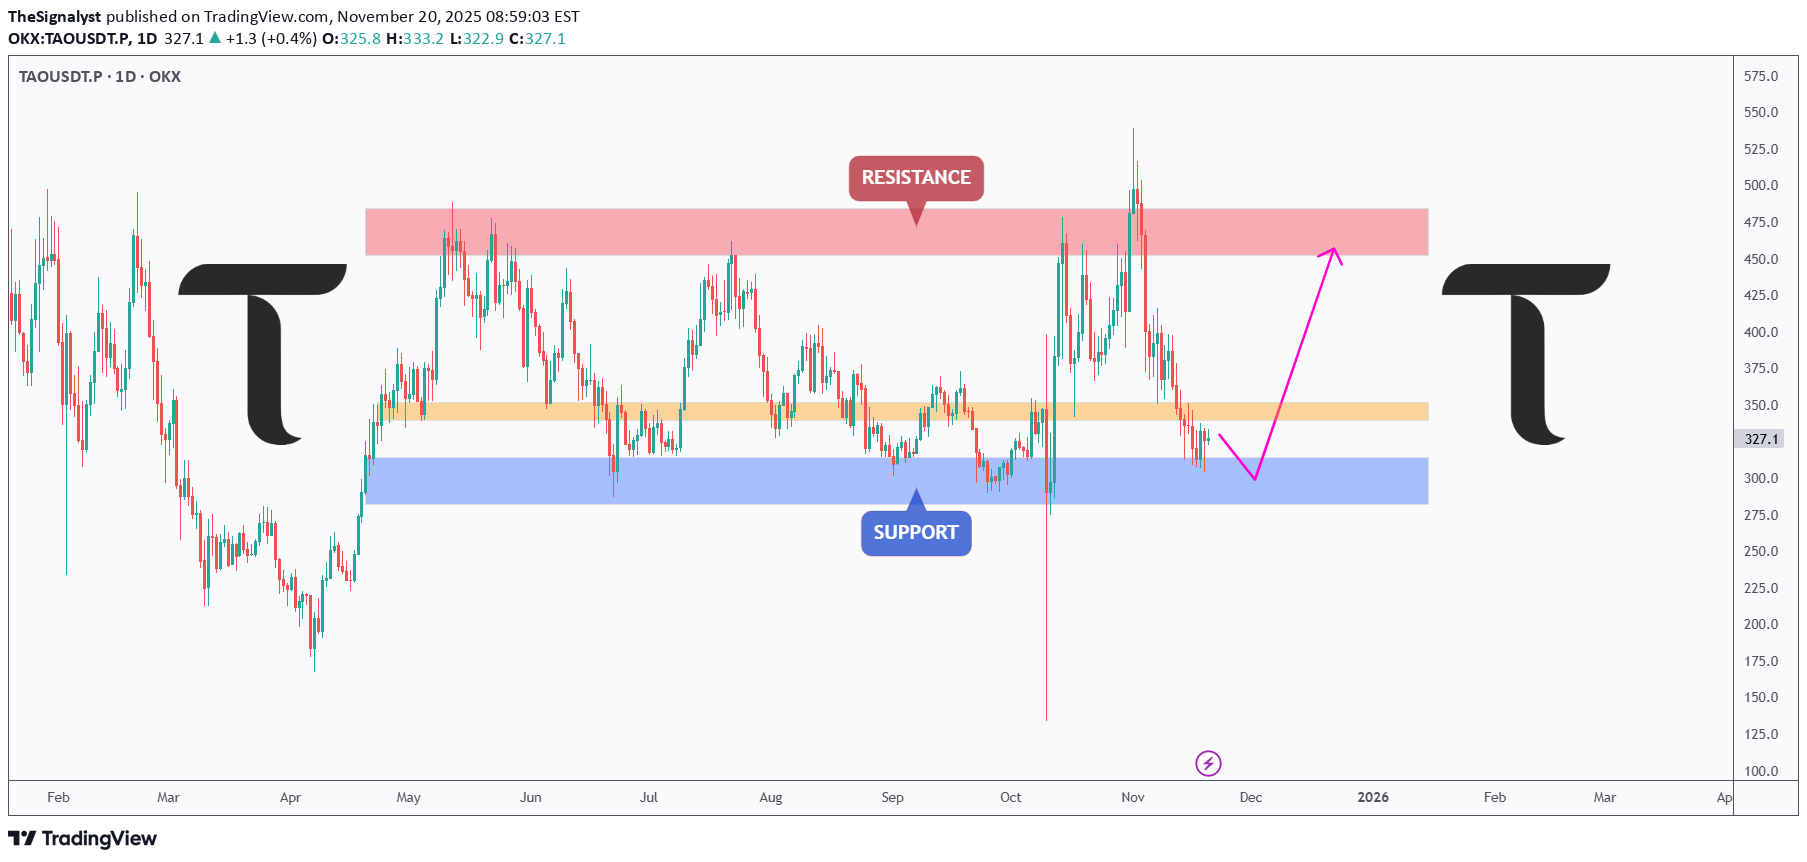
📦 TAO is currently trading inside a wide range , hovering above a major support zone that has held the price multiple times throughout the year. As long as this blue support area continues to hold, we will be looking for longs and expecting buyers to step in. 📈For the bulls to fully take over , TAO needs to break and hold above the orange structure zone, which has been acting as a strong barrier for months. A clean breakout above it would open the way toward the red resistance zone and potentially higher. Until then, this remains a simple range: Support for buys… resistance for sells… and structure for confirmation. 🤔 ⚠️ Disclaimer: This is not financial advice. Always do your own research and manage risk properly. 📚 Stick to your trading plan regarding entries, risk, and management. Good luck! 🍀 All Strategies Are Good; If Managed Properly! ~Richard Nasr.

CryptoWithJames
تحلیل تکنیکال TAO: آماده صعود 41 درصدی از الگوی گُوِه نزولی!
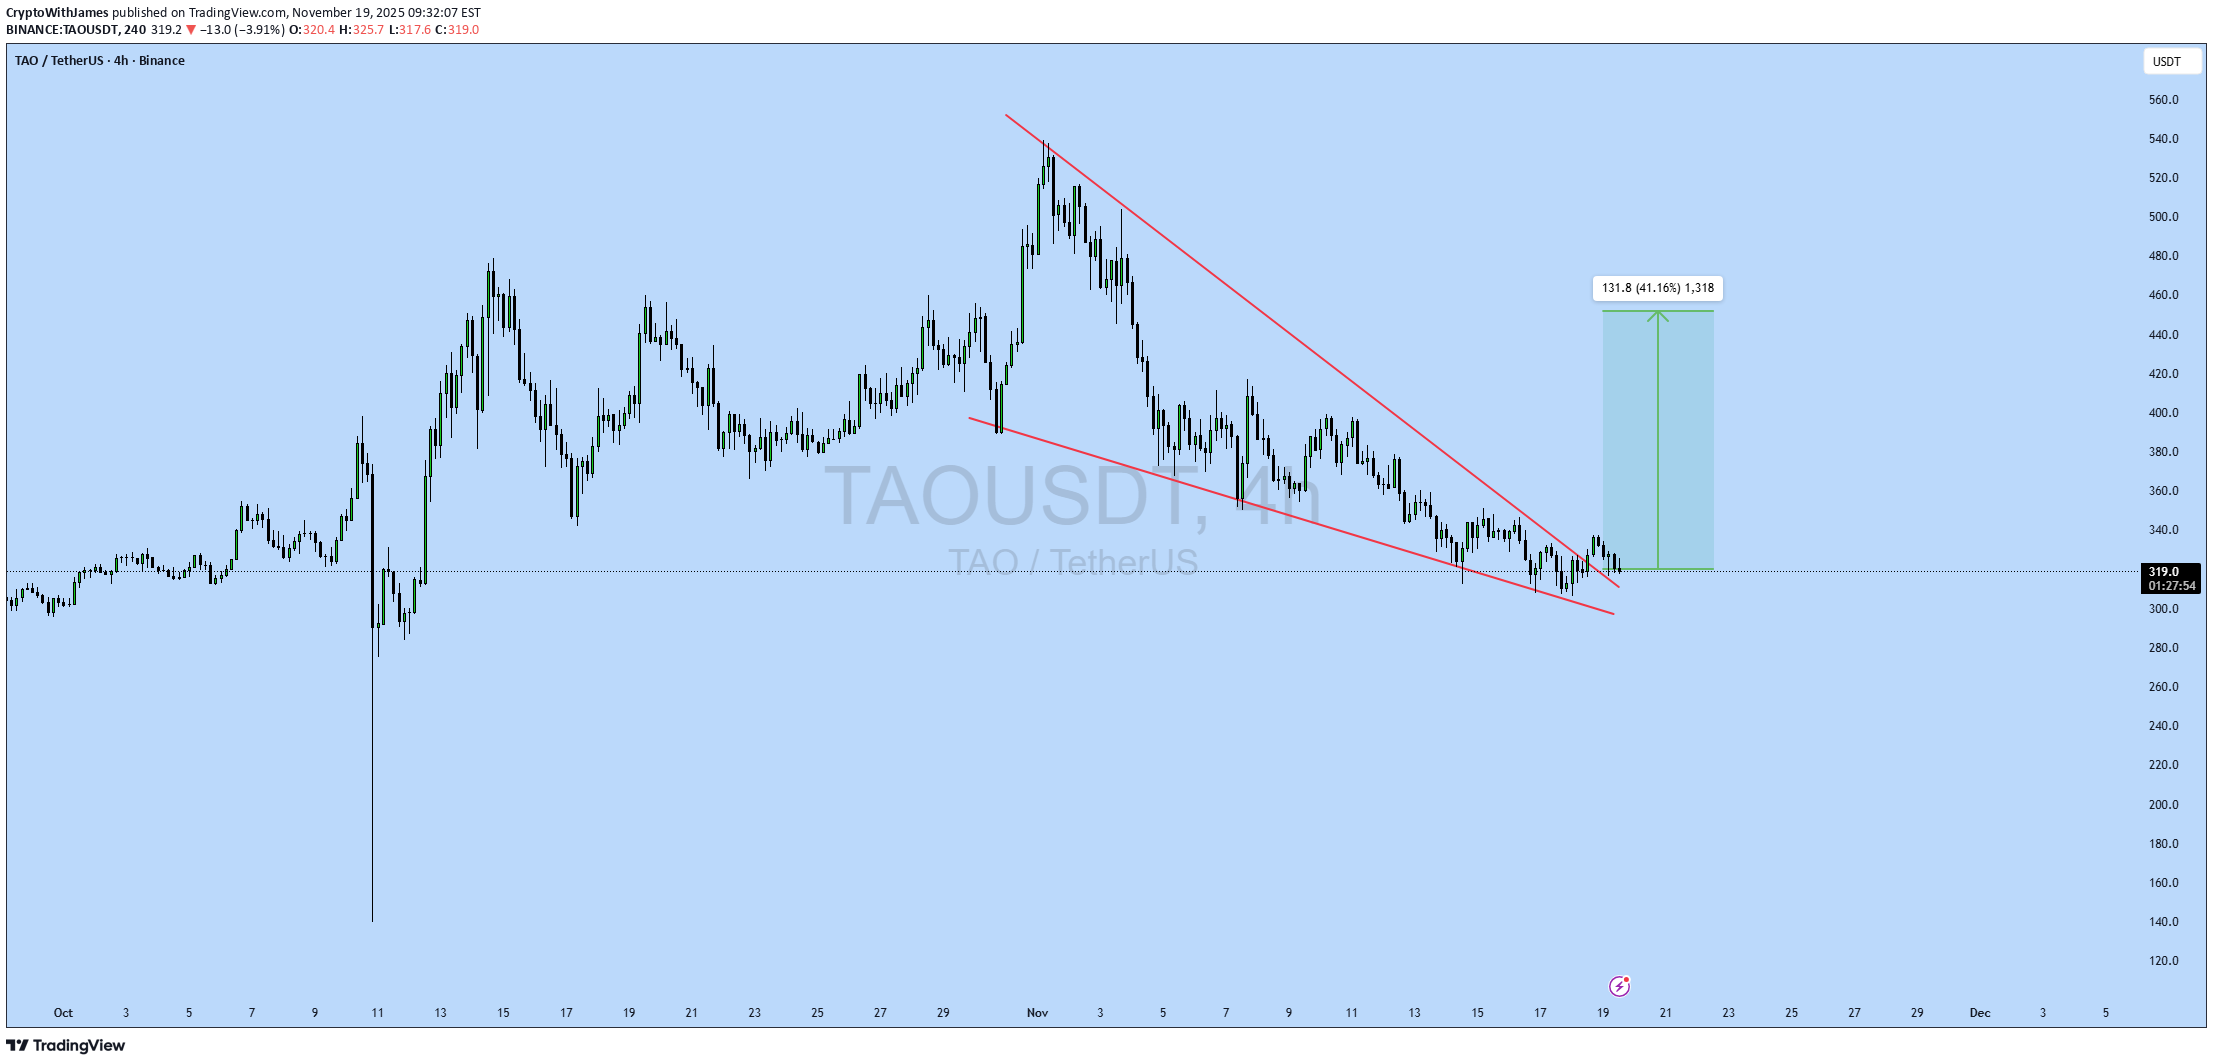
#TAO UPDATE TAO Technical Setup Pattern: Falling Wedge Pattern Current Price: $320.3 Target Price: $452.1 Target % Gain: 41.16% Technical Analysis: TAO is breaking out of a falling wedge pattern on the 4H chart, showing bullish potential. The price has recently surged above the resistance trendline, with volume increasing, indicating a possible continuation towards the target price. The upward momentum is supported by the recent breakout. Time Frame: 4H Risk Management Tip: Always use proper risk management.

تحلیل TAO/USDT: آیا موج سوم انفجاری آغاز میشود؟ (اهداف ۶۶۵ تا ۱۲۰۰)
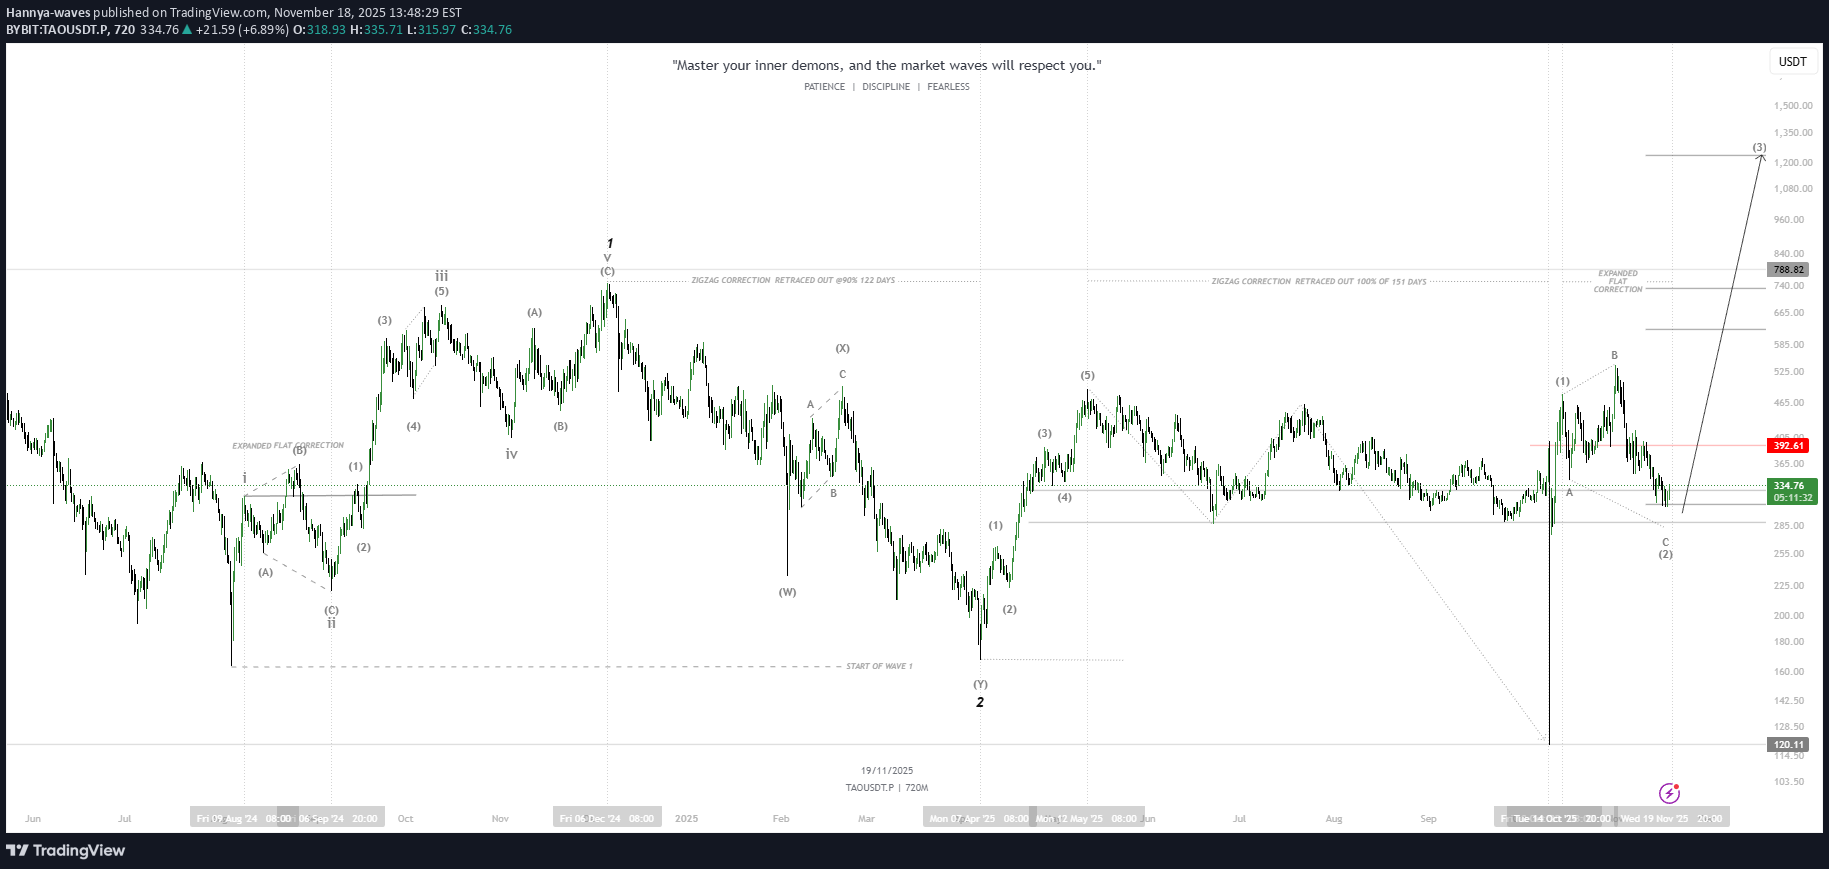
tao-usdt Thesis (one-liner): Looks like a completed Wave 1 up and a Wave 2 corrective structure has finished — price is sitting on the lower edge of the Wave-2 support zone (~₱334), so the more likely path is the start of an impulsive Wave 3 that aims much higher (targets shown on your chart around ₱665 → ₱788 → ₱1,200+). Why I like this count (plain English) The left–to–right structure shows a clean five-wave advance earlier (labelled 1), followed by a multi-leg corrective pattern (A-B-C / expanded flat / zigzag annotations). That is textbook for a Wave-1 → Wave-2 sequence. Wave-2 retraced and built a horizontal support band — price is back at that band (near ₱334), which often marks the springboard for a strong Wave-3. The projected Wave-3 on your chart is aggressive (typical: Wave-3 is often the longest); the chart’s measured expansions line up with major resistance levels at ~₱665, ₱788, then ~₱1,200. Key levels (from your chart) Current / support area: ~₱334 (immediate). Near resistance / breakout confirmation: ₱392.6 (red line). A clean daily close above here is a strong confirmation for the bullish case. Primary invalidation: a decisive break and daily close below the support band (~₱285–₱300 on your annotated box) would invalidate the bullish Wave-3 projection and point to a deeper corrective leg (the chart also shows a lower anchor near ₱120 as extreme scenario). Targets (progressive): first target ~₱665, next ~₱788, extended target ~₱1,200+ (these are on your Fibonacci/expansion rulers). Practical trade ideas (clear, with risk control) Conservative: Wait for a break & daily close above ₱392.6. Enter on retest if price pulls back — stop below ₱334 (or tighter depending on your edge). Aggressive (scalp / partial): Buy small size at current support ~₱334, add on a confirmed breakout above ₱392.6. Place a stop below ₱285 (invalidates the bullish structure). Targets & sizing: Scale out at the defined target bands (take partial profits at ~₱665, more at ~₱788) and let a small runner aim for ₱1,200+. Keep position sizing small enough that the stop is an acceptable % loss. Risk notes & alternate scenario If price collapses below the support band (~₱285) with volume, the count likely fails and a deeper correction to much lower levels becomes probable (your chart shows the lower extreme near ₱120). Treat that as invalidation, not a surprise — adjust risk accordingly. Always respect timeframes: this count is multi-month (weekly/daily structure). Short-term noise will happen; wait for your confirmation rules. Quick Elliott refresher (one paragraph) Elliott Wave reads markets as repeating psychology: impulses move in 5 waves (1–5) and corrections in 3 waves (A-B-C). After a 5-wave advance, a correcting 3-wave set (Wave-2) often retraces a portion of the move — when that correction ends at a logical support zone, the next impulse (Wave-3) tends to be the strongest and most profitable. Final thought (trading etiquette): keep stops tight, size small on unconfirmed moves, and only let a portion of the trade run for the big target. As your chart says up top — “Master your inner demons, and the market waves will respect you.” Patience + rules = edge.

Smarttrader0786
سیگنال خرید SMC برای تاقوسدت (TAQUSDT): استراتژی معاملاتی کامل و سودآور!

Hello, TradingView community and my subscribers, please if you like ideas do not forget to support them with your likes and comments, thank you so much and we will start a LONG outlook on #TAQUSDT explained. Price action analysis

CryptoNuclear
آینده TAO/USDT در این محدوده حیاتی: صعود بزرگ یا سقوط آزاد؟

TAO/USDT is now sitting on one of the most critical price zones of its entire mid-term structure. On the 2D timeframe, price has returned to the Golden Demand Zone at 340–305 — an area that previously acted as accumulation, breakout base, and institutional defense line. Now the market is testing it again, which means: > How price reacts here will determine the next major directional wave. --- 🔶 Why the 340–305 Zone Is Extremely Important A proven demand zone where buyers consistently stepped in with strength. A flip zone (old resistance → new support). A region where institutions filled liquidity before previous rallies. Multiple long wicks were created here → indicating liquidity sweeps and strong buy absorption. In simple terms: This zone is the foundation of the current trend cycle. --- 📈 Bullish Scenario — “Institutional Rebound Setup” If 340–305 holds firmly, the market may form a strong bullish reversal: 1. Bullish confirmation from the zone Look for: Strong bullish 2D candle Long lower wick Rejection from 305 followed by a close above 340 This would indicate aggressive buy-side defense. 2. Upside targets (layered resistances) 385 → first resistance, local take-profit zone 460 → key supply zone 560 → major resistance from previous distribution 725 → high-range target if bullish continuation strengthens Bullish narrative: > If the 305–340 zone is defended again, TAO is likely preparing for a multi-wave bullish move toward upper-range resistances. --- 📉 Bearish Scenario — “Breakdown = Trend Reset” If price closes below 305 on the 2D chart, the structure shifts into a deeper corrective phase: 1. Breakdown of the Golden Zone Buyers lose control A failed retest of 305–340 → confirmation of bearish dominance 2. Downside targets 260–220 → next minor support 163 → major structural low and liquidity magnet in a full breakdown scenario Bearish narrative: > Losing 305 is not a simple breakdown — it signals a trend cycle reset and opens the door for deeper distribution. --- 🔍 Market Mood & Pattern: Range, Traps, and Energy Compression TAO has been forming a large multi-month range Repeated fakeouts and long wicks → liquidity hunting, not trending This type of structure usually forms before a major breakout or major dump Price is sitting at the tail end of compression — the next move out of 340–305 will define the coming trend direction. #TAOUSDT #TAO #CryptoAnalysis #KeyLevels #MarketStructure #DemandZone #Breakout #Liquidity #SwingTrading #CryptoOutlook
$TAO Plan
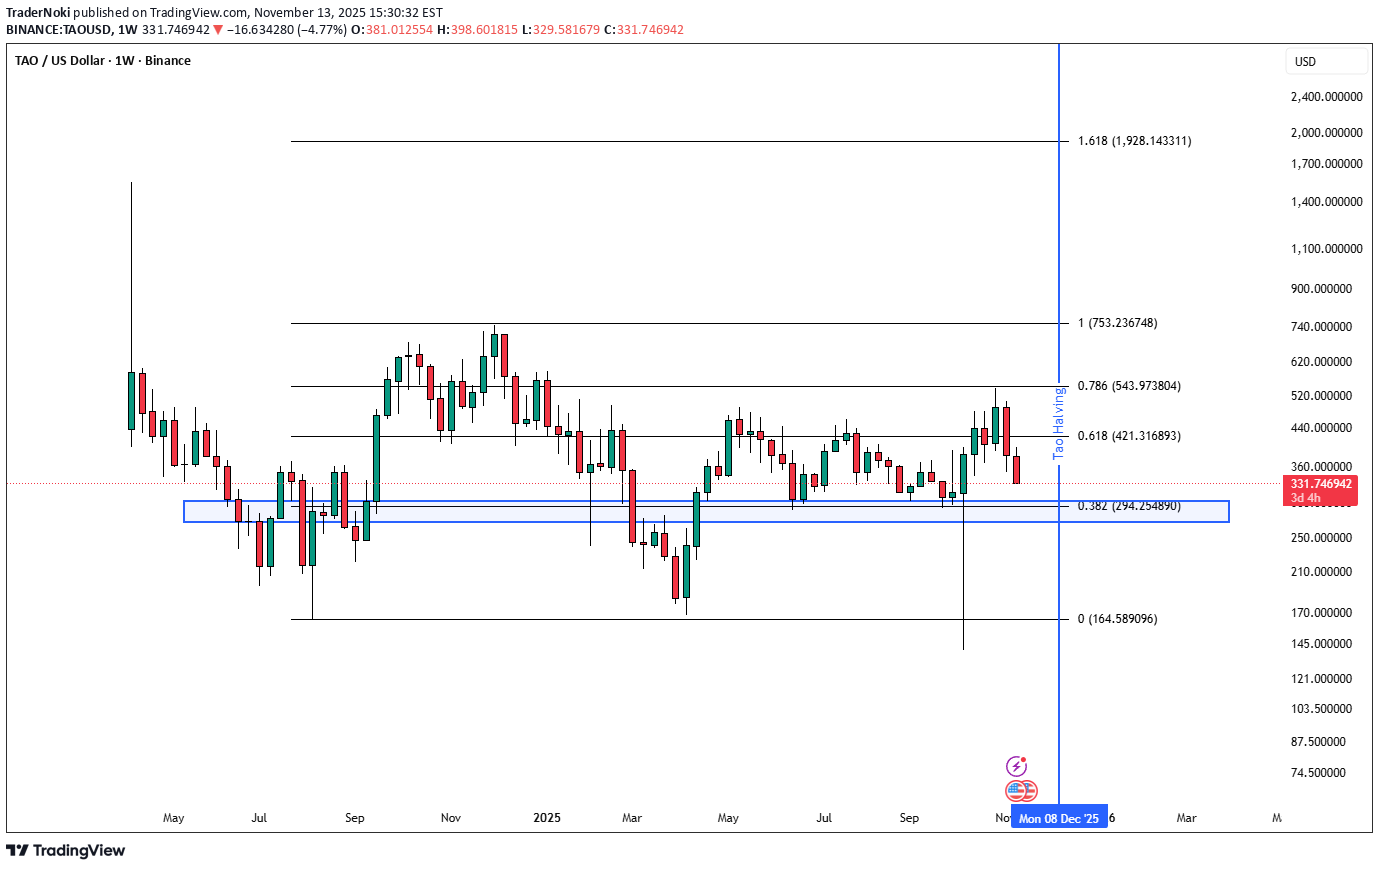
TAO I put my buy orders in blue box. This is around 300/270 dollars. Also on the montly and weekly chart you can see this is a strong support. With 0.382 fib level around $294, I think this box will hold and we will see a bounce from it.Didn't get filled but keeping bids active.

RayHanBros
سیگنال خرید TAO: ورود، اهداف قیمتی و حد ضرر (تحلیل تکنیکال)
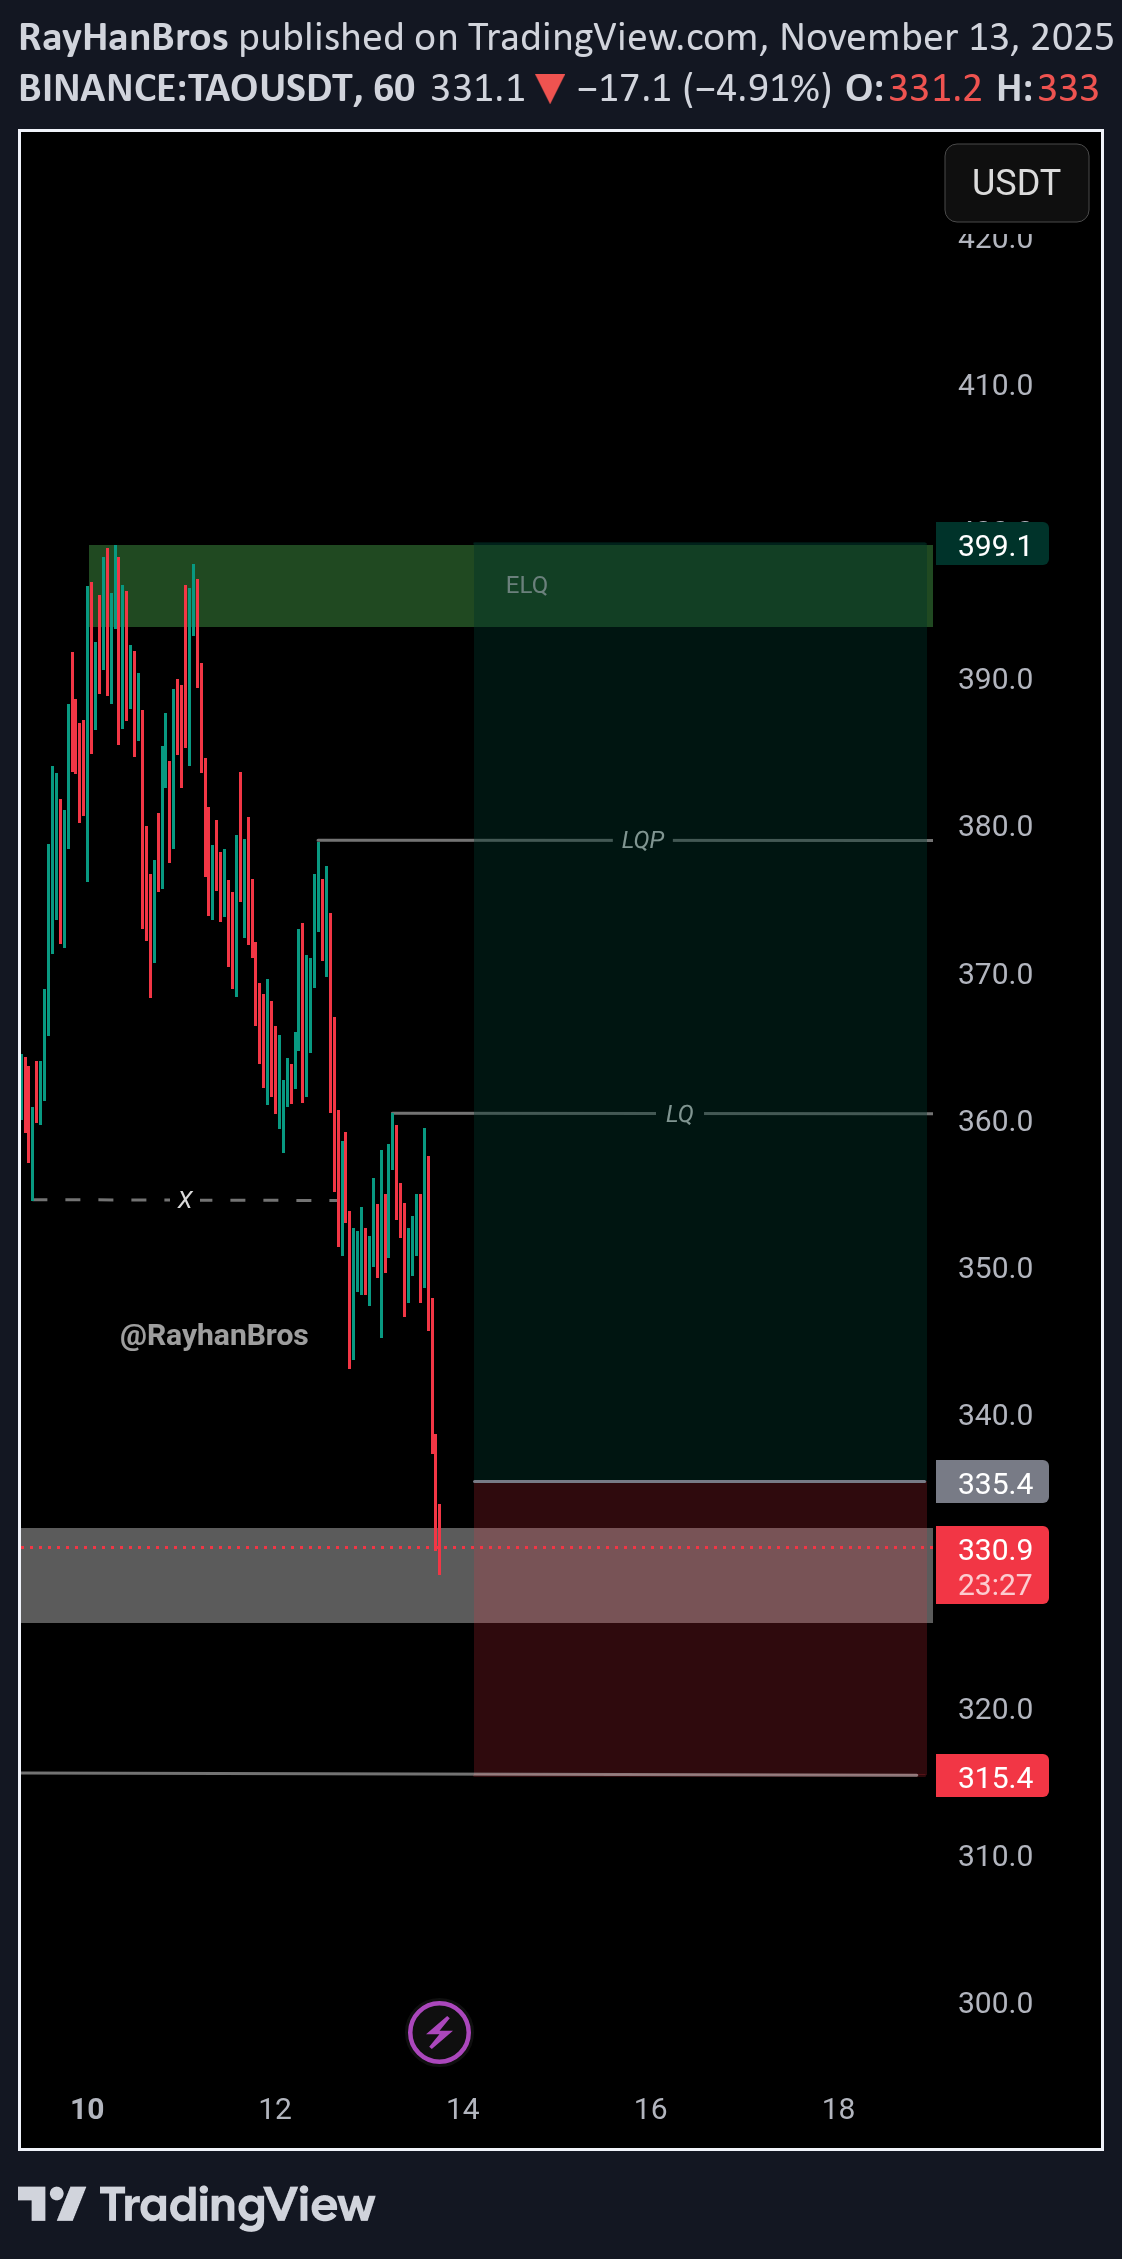
🟩 Entry Zone: 330$ - 320$ 🎯 Targets: 1️⃣ 345$ 2️⃣ 360$ 3️⃣ 380$ 4️⃣ 400$+ 🔻 Stop-Loss: Below 305$

WaveRiders2

cenkerol0
تحلیل شوکهکننده: آیا ریزش بزرگ در راه است؟ (تاو و سناریوی ۴ ساعته)
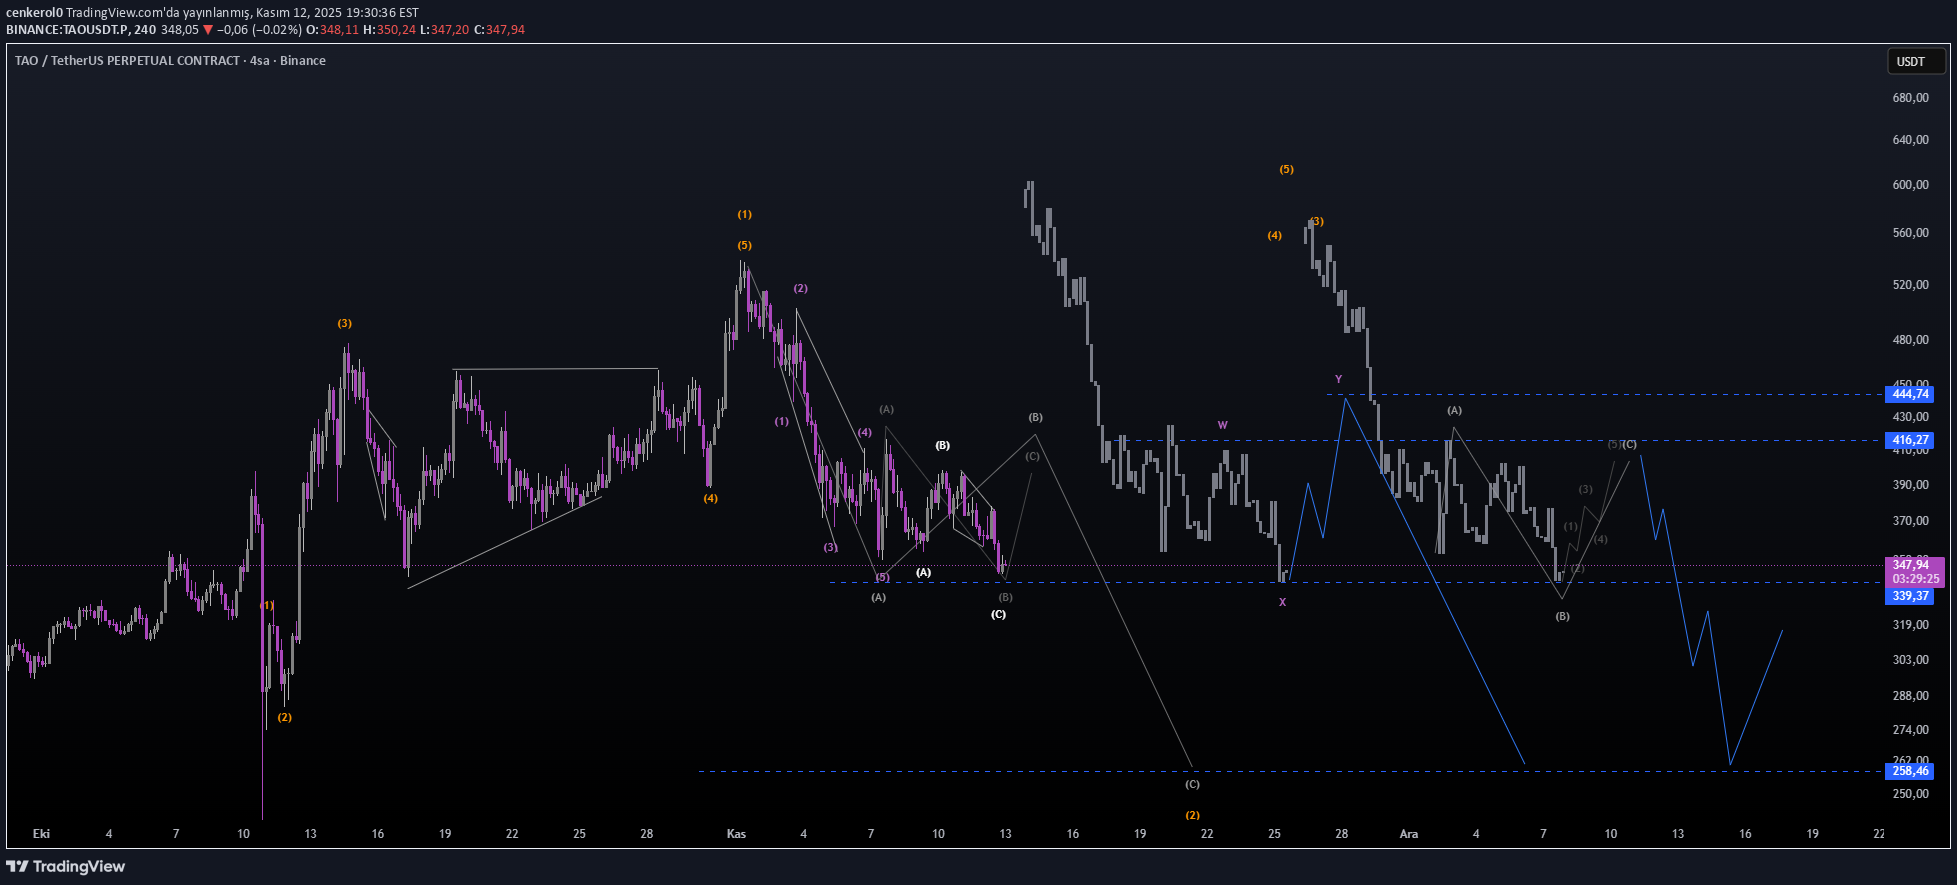
This possibility has become more secure.. There is another possibility. The place I took as the 1st wave is evaluated as in the first drawing and the ABC correction becomes a wave and convert it to the wave A that we changed here.
Disclaimer
Any content and materials included in Sahmeto's website and official communication channels are a compilation of personal opinions and analyses and are not binding. They do not constitute any recommendation for buying, selling, entering or exiting the stock market and cryptocurrency market. Also, all news and analyses included in the website and channels are merely republished information from official and unofficial domestic and foreign sources, and it is obvious that users of the said content are responsible for following up and ensuring the authenticity and accuracy of the materials. Therefore, while disclaiming responsibility, it is declared that the responsibility for any decision-making, action, and potential profit and loss in the capital market and cryptocurrency market lies with the trader.