
SYRUP
Maple Finance
| تریدر | نوع سیگنال | حد سود/ضرر | زمان انتشار | مشاهده پیام |
|---|---|---|---|---|
 Richtv_officialRank: 5037 | خرید | حد سود: تعیین نشده حد ضرر: تعیین نشده | 11/3/2025 | |
 Goldfinch_songRank: 6955 | خرید | حد سود: تعیین نشده حد ضرر: تعیین نشده | 11/17/2025 | |
 CryptoWithJamesRank: 34115 | خرید | حد سود: ۰٫۷۲۵ حد ضرر: تعیین نشده | 10/14/2025 | |
 Alpha-GoldFXRank: 34315 | خرید | حد سود: تعیین نشده حد ضرر: تعیین نشده | 10/30/2025 |
Price Chart of Maple Finance
سود 3 Months :
سیگنالهای Maple Finance
Filter
Sort messages by
Trader Type
Time Frame

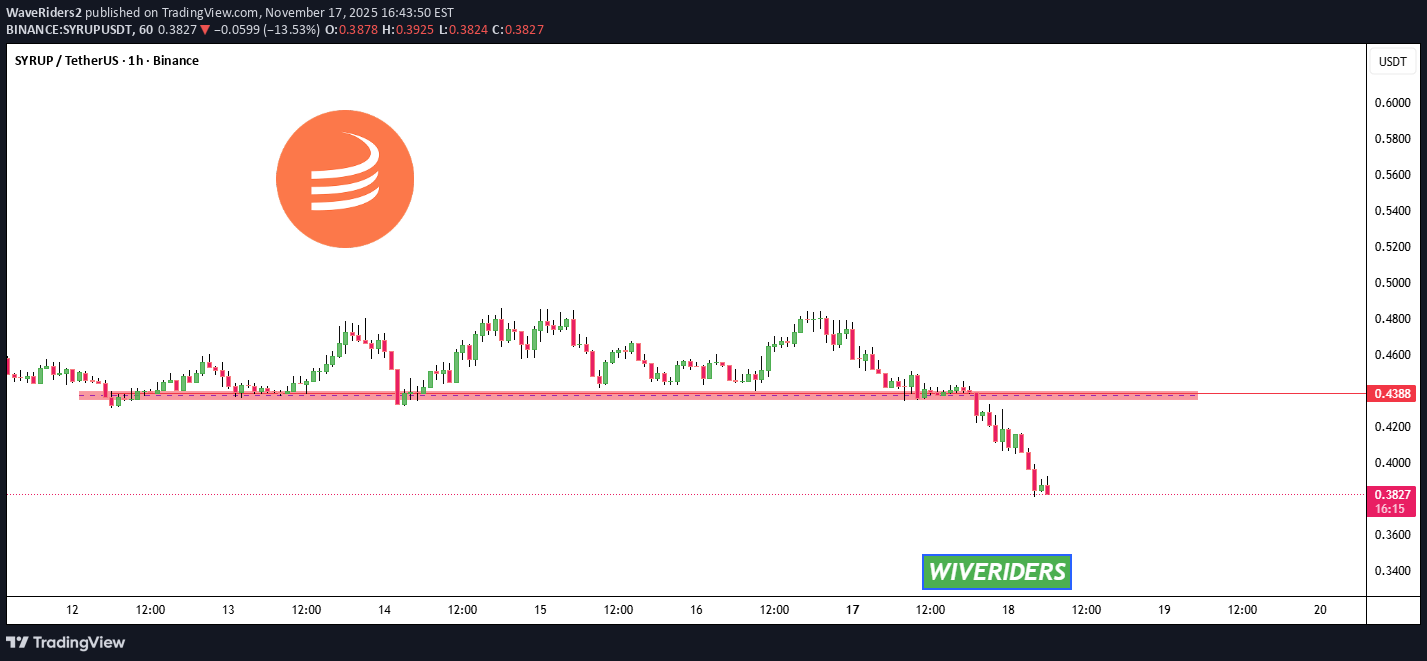
WaveRiders2
سطح مقاومت قرمز SYRUP: آیا خریداران آماده شکستن سقف قیمت هستند؟
Goldfinch_song
تحلیل SYRUP (Maple Finance): فرصت خرید شیرین در کمین پس از ریزش شدید!
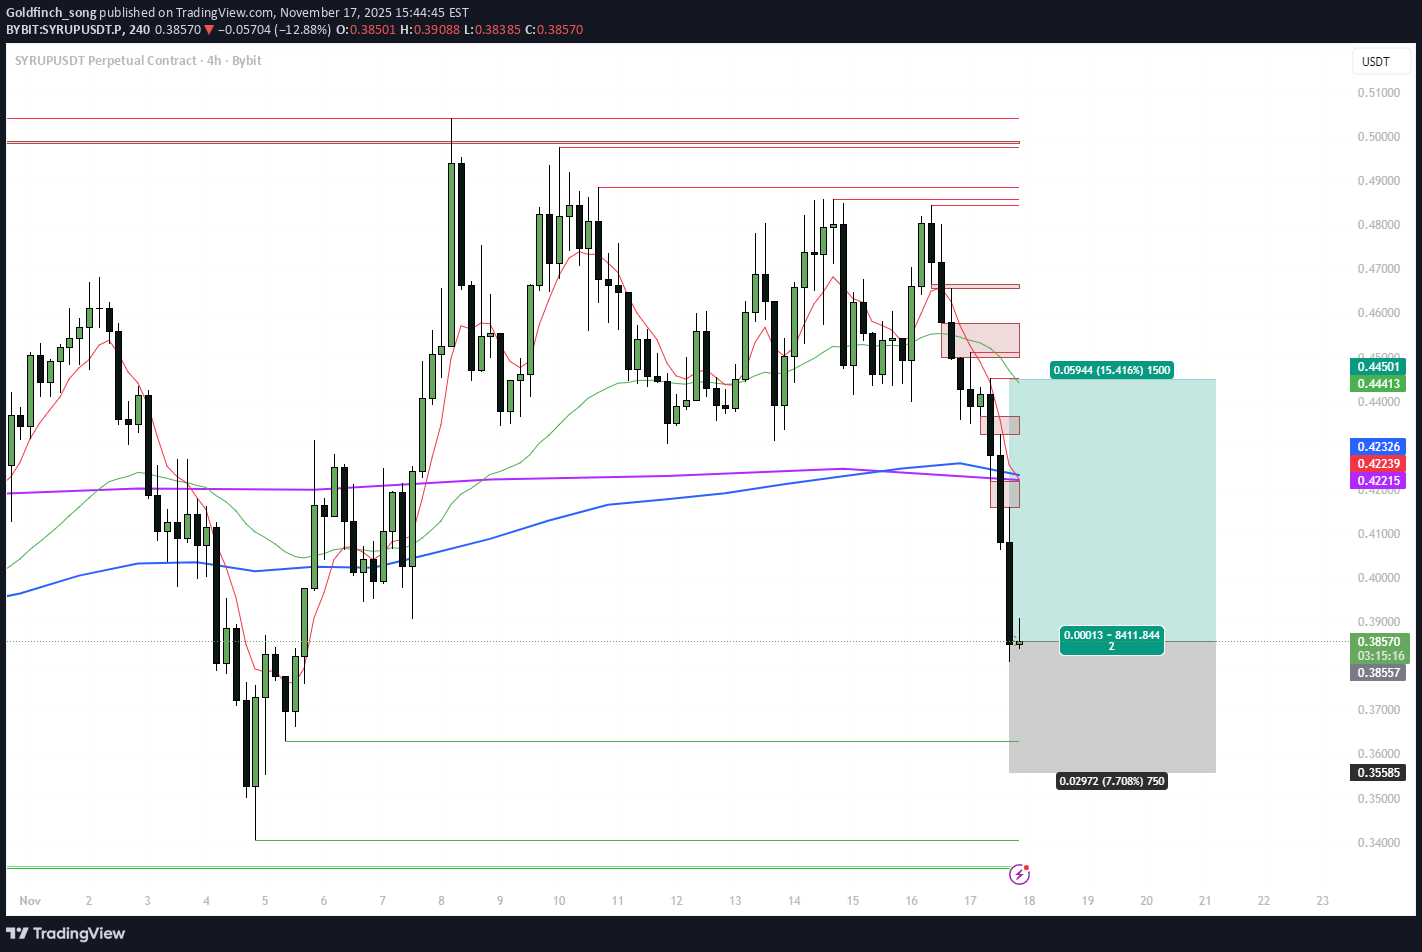
SYRUP (Maple Finance) printed a strong flush on the 4H chart and is now trading in my first demand / deviation zone after breaking down from the 0.42–0.45 range. Fundamentals remain constructive: – AUM > $5B in Q3, up ~66% QoQ. – Q3 revenue around $4M with an October ATH of ~$2.16M. – 25% of protocol revenue is allocated to SYRUP buybacks and staker rewards (MIP-018/019), directly linking the token to cash flows. So we have a fundamentally supported DeFi credit token going through a short-term deleveraging move. On the 4H chart: – Price is trading below both 4H and 1D EMAs, with Dev% showing clear oversold conditions vs the mean. – The last leg down came with a vertical selling cluster into the lower ATR band. – Above price, the key liquidity zones are 0.422–0.423 (broken support + EMA area) and 0.44–0.445 (supply cluster / range high). I treat this as a potential mean-reversion setup rather than a fresh downtrend start. Trade plan (swing 1–5 days) – Long area: 0.395–0.405, with optional partial add on a spike toward 0.38. – Main target: 0.422–0.423 — retest of broken support and the 4H EMA region. – Extended target: 0.44–0.445 — upper supply zone and range high. – Invalidaton: 4H closes below 0.355. Stop goes under this level; if it breaks and holds, the setup is done and I wait for a new base lower (0.334–0.31). This gives an approximate R:R of ~1:2 toward the main target and higher if the extended target is hit. Alternative scenario If DeFi risk keeps unwinding and 0.355 fails to hold, I expect price to explore the 0.334–0.31 area, where a new accumulation zone may form. In that case this long idea is invalid and I’ll re-map the structure before looking for the next entry. Not financial advice — just my 4H EMA deviation swing framework combined with current fundamentals on Maple Finance.

behdark
پیشبینی صعودی SYRUP: منطقه ورود کمریسک و اهداف سود در نمودار ۱۲ ساعته
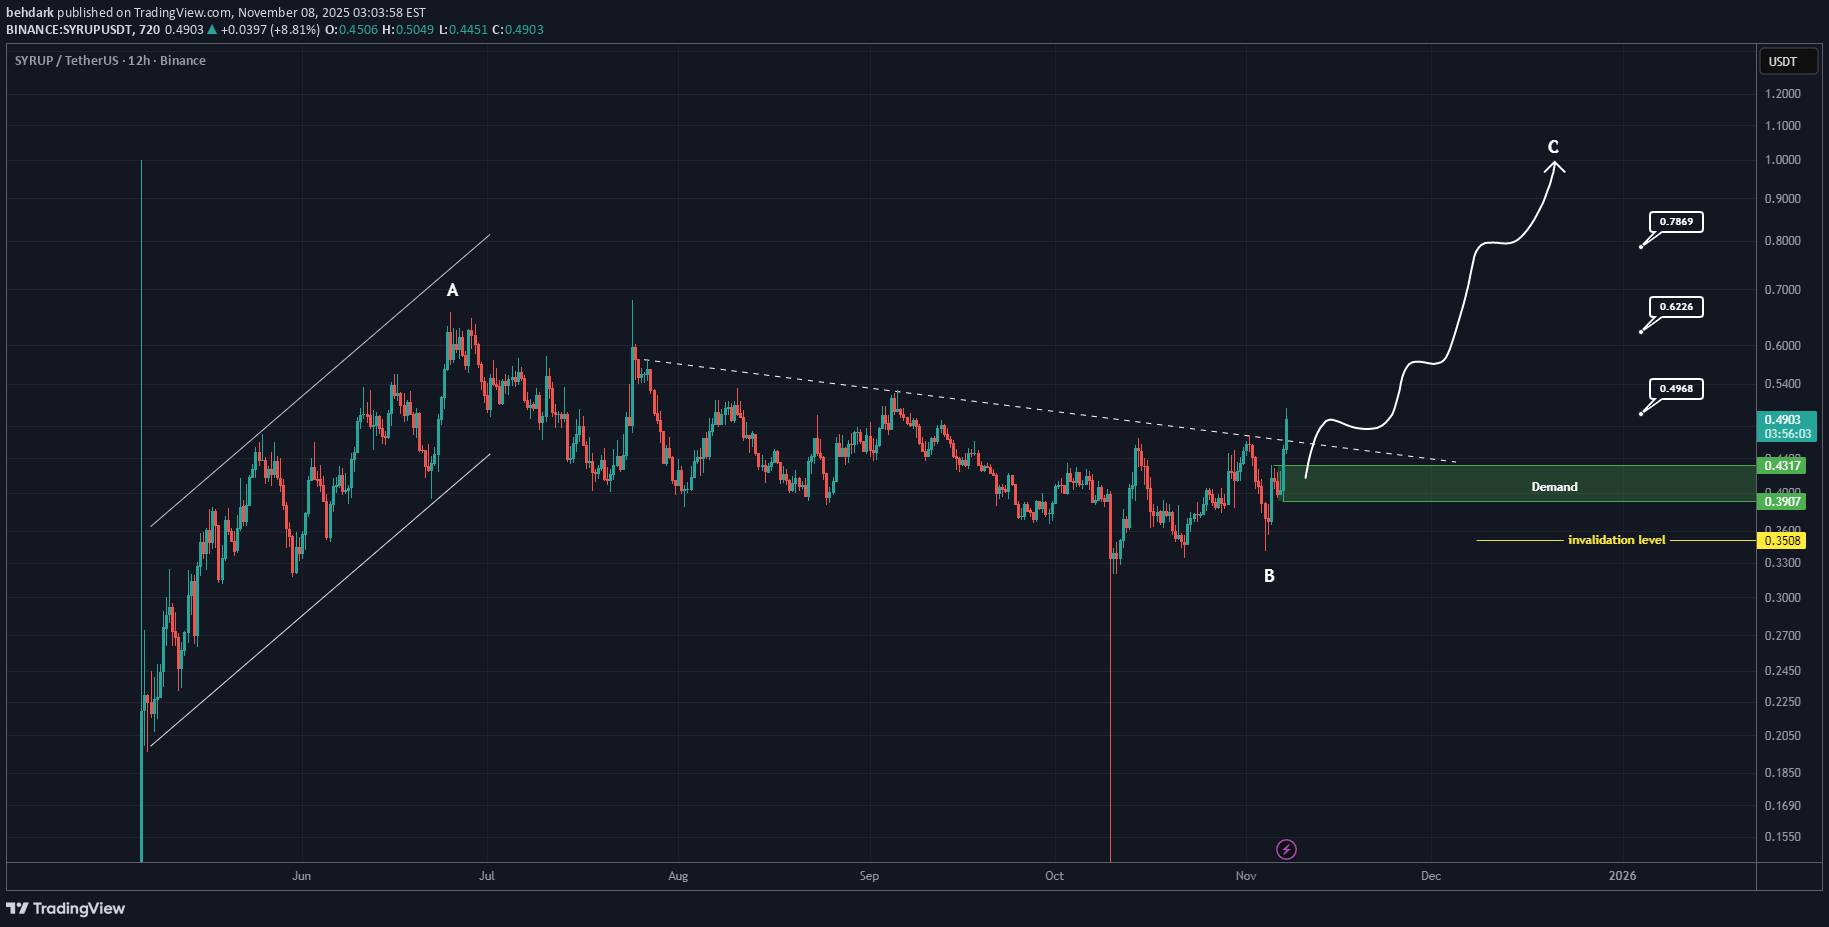
It seems we have a bullish ABC pattern on the chart, and we are currently in wave C. There is a support zone on the chart highlighted in green. If the price returns to this area, it will be considered a low-risk entry. The targets are marked on the chart. A daily candle closing below the invalidation level will invalidate this analysis. For risk management, please don't forget stop loss and capital management When we reach the first target, save some profit and then change the stop to entry Comment if you have any questions Thank You

CryptoNuclear
نقطه عطف SYRUP/USDT: آیا گاوها بالاخره پیروز میشوند یا دام فریب در کمین است؟
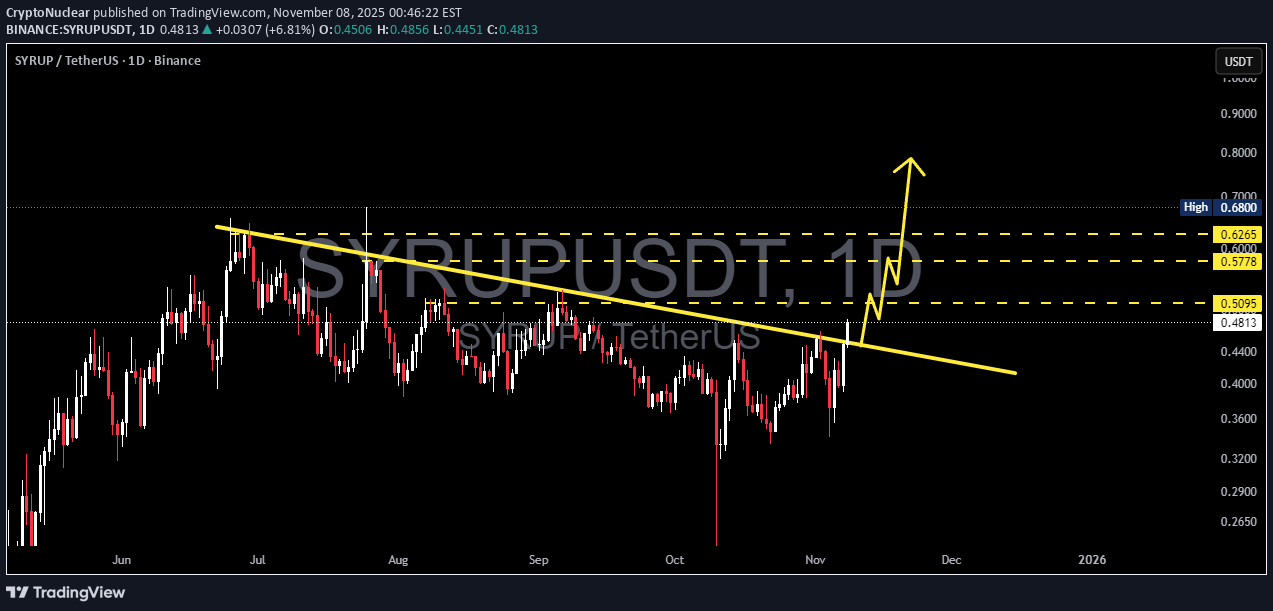
The SYRUP/USDT pair is now at a critical zone — after months of being trapped below the main descending trendline (yellow) since June, price is once again testing a key resistance area around 0.48–0.51 USDT. Buyer momentum is starting to build, but the market has not yet given a confirmed breakout signal. The latest candle shows a strong attempt to break above the trendline, but the big question remains: ➡️ Is this the start of a major trend reversal? or ➡️ Just a classic rejection before another leg down? --- 🔼 Bullish Scenario — “The Breakout We’ve Been Waiting For!” If price closes daily above 0.5095 and holds that level (successful retest), then the potential for a reversal becomes stronger. Buyer strength could push the price toward: 🎯 Target 1: 0.5778 🎯 Target 2: 0.6265 🎯 Target 3: 0.6800 (previous swing high) A confirmed breakout would mark the end of the lower-high structure and open the door to a mid-term uptrend rally. Additional confirmation: rising volume & solid bullish candle bodies without long upper wicks. --- 🔽 Bearish Scenario — “False Breakout Trap?” If price fails to break above 0.5095 or gets strongly rejected at the trendline (forming a bearish engulfing / rejection candle), the likelihood of a false breakout becomes high. In this case, sellers may regain control and drive price lower toward: ⚠️ Support 1: 0.44 ⚠️ Support 2: 0.36 ⚠️ Support 3: 0.29 Failed breakouts are often followed by quick dumps, as trapped longs (bull traps) rush to exit positions. Beware of long wicks near resistance zones! --- 🧩 Structure & Pattern The current setup forms a Descending Trendline Breakout Pattern, where the market is attempting to break through a long-term downward pressure line that has held for months. This structure typically signals either: Trend Reversal → if the breakout is confirmed. Downtrend Continuation → if rejection occurs. In short: A major momentum shift is building — direction awaits confirmation. --- ⚖️ Quick Summary > “The market stands at a major crossroads. A confirmed breakout could trigger a trend reversal — but failure here might signal another bearish continuation. Stay disciplined, wait for confirmation, and manage risk wisely.” #SYRUPUSDT #CryptoAnalysis #BreakoutAlert #TechnicalAnalysis #TrendReversal #CryptoTrading #PriceAction #ChartPattern #BullishScenario #BearishScenario #CryptoTrader #AltcoinWatch
Richtv_official
فرصت خرید طلایی SYRUP: منتظر بازگشت قیمت به سطح ۰.۳۷ باشید!
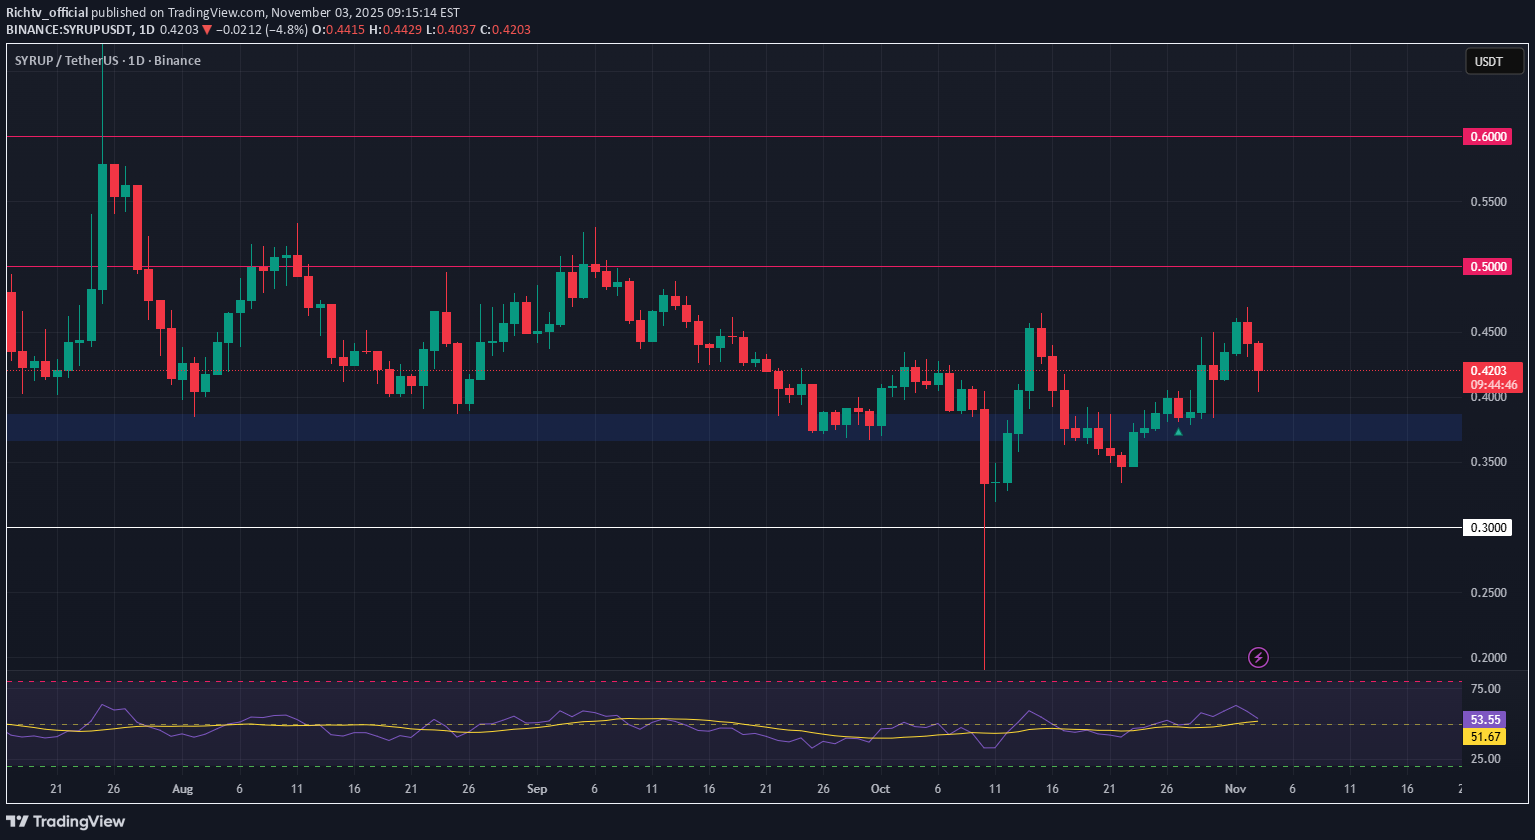
After a strong 24% surge since our last analysis, SYRUP is starting to show signs of a potential retracement. This could be a healthy move, offering a chance to reset before a possible continuation higher on the higher time frames. We’re now closely monitoring the $0.37 support zone, a level that aligns with previous consolidation and demand. If price pulls back and holds this zone, we may see a bullish reversal setup forming—a potential entry point for a spot long trade. Confirmation from candlestick structure or volume would strengthen the case. 📈 Trade Plan: Entry Zone: $0.37 Take Profit Targets: $0.50, $0.60 Stop Loss: $0.30
Alpha-GoldFX
سیرپ (SYRUPUSDT): آماده انفجار ۹۰ درصدی؟ الگوی گوه نزولی راز صعود بزرگ!
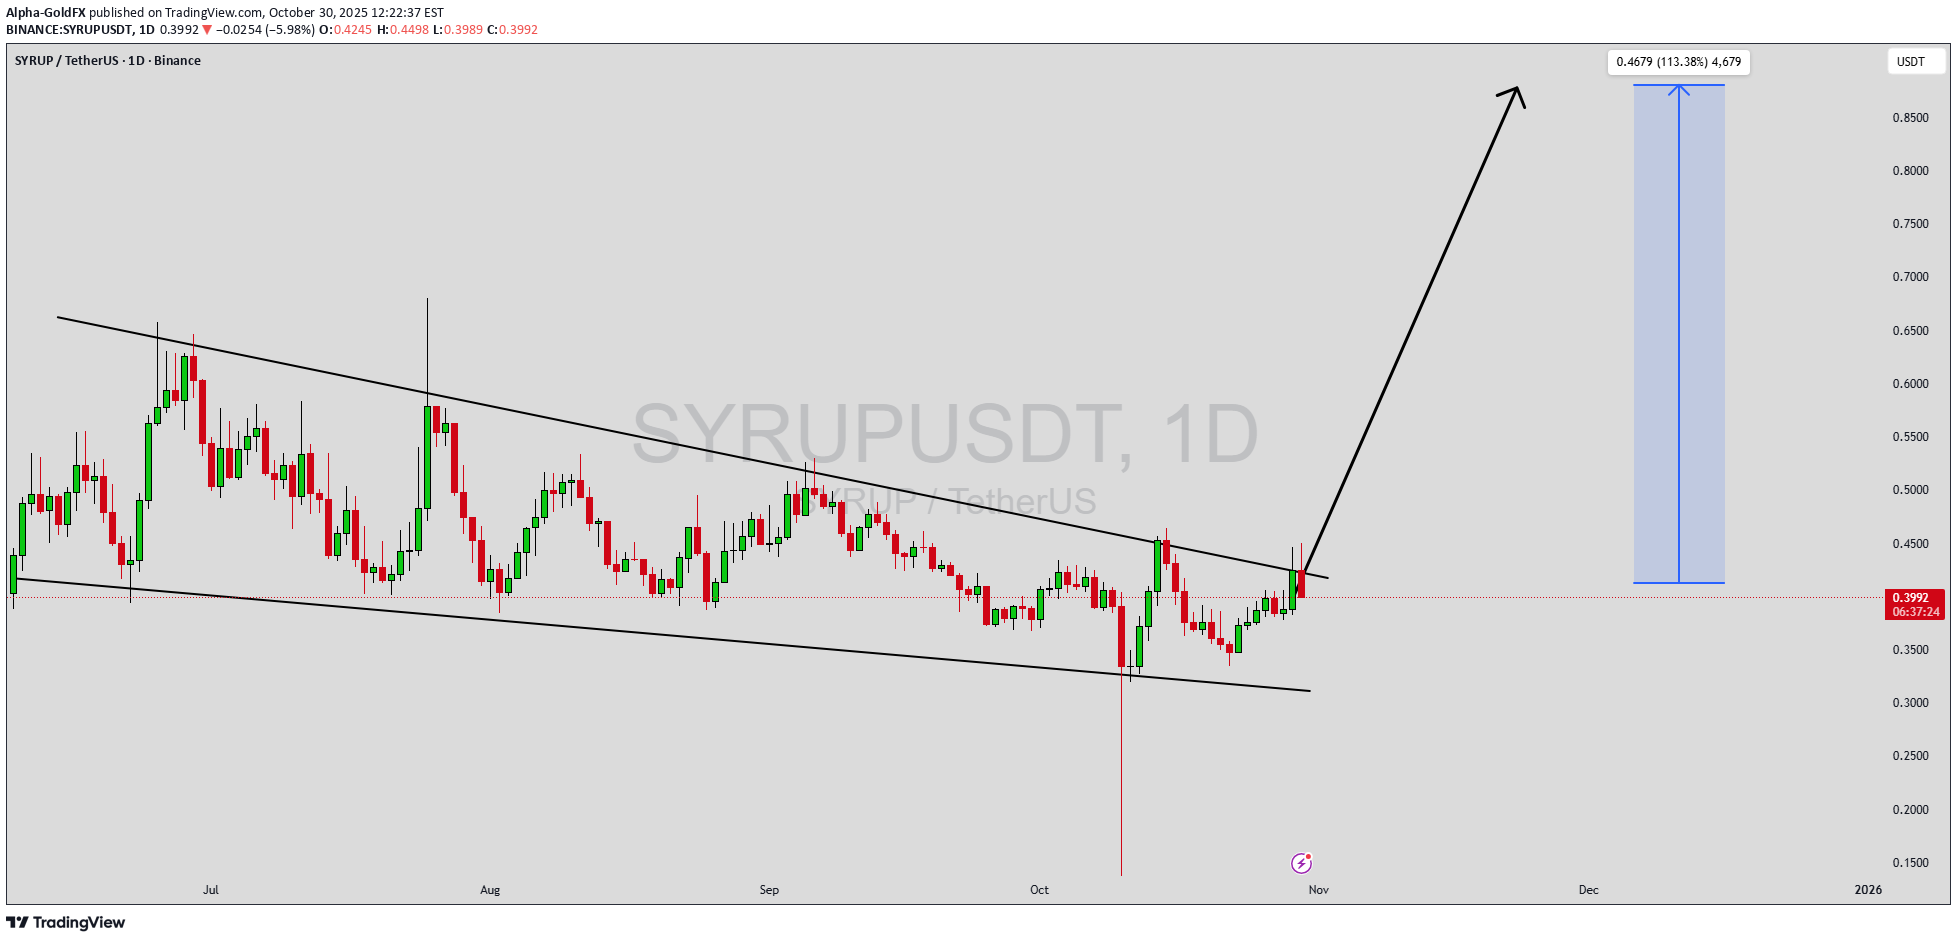
SYRUPUSDT is currently showing a falling wedge pattern, a strong bullish formation that typically signals the end of a downtrend and the potential beginning of an upward breakout. The price has been tightening within the wedge, suggesting that selling pressure is weakening while buyers are gradually accumulating positions. The volume remains good, confirming that interest in this pair is steadily building. Once SYRUPUSDT breaks above the wedge resistance, a potential 90% to 100%+ gain could be on the horizon as momentum shifts in favor of the bulls. This setup reflects a common accumulation phase where investors quietly enter before a strong bullish rally. The narrowing of the wedge often precedes explosive price action, especially when combined with healthy trading volume. The technical outlook is promising, with multiple indicators hinting at bullish divergence and an imminent breakout that could spark renewed market attention toward SYRUPUSDT. Investors are increasingly taking interest in this project as it positions itself for a strong rebound within the broader crypto market. With improving sentiment and technical alignment, SYRUPUSDT has the potential to deliver substantial upside once confirmation of the breakout occurs. Traders will likely watch this level closely for a decisive move, as a confirmed breakout could trigger a sharp rally supported by volume and market participation. ✅ Show your support by hitting the like button and ✅ Leaving a comment below! (What is You opinion about this Coin) Your feedback and engagement keep me inspired to share more insightful market analysis with you!
Richtv_official
فرصت طلایی خرید SYRUP: ورود از ناحیه حمایتی کلیدی با اهداف سود چشمگیر!
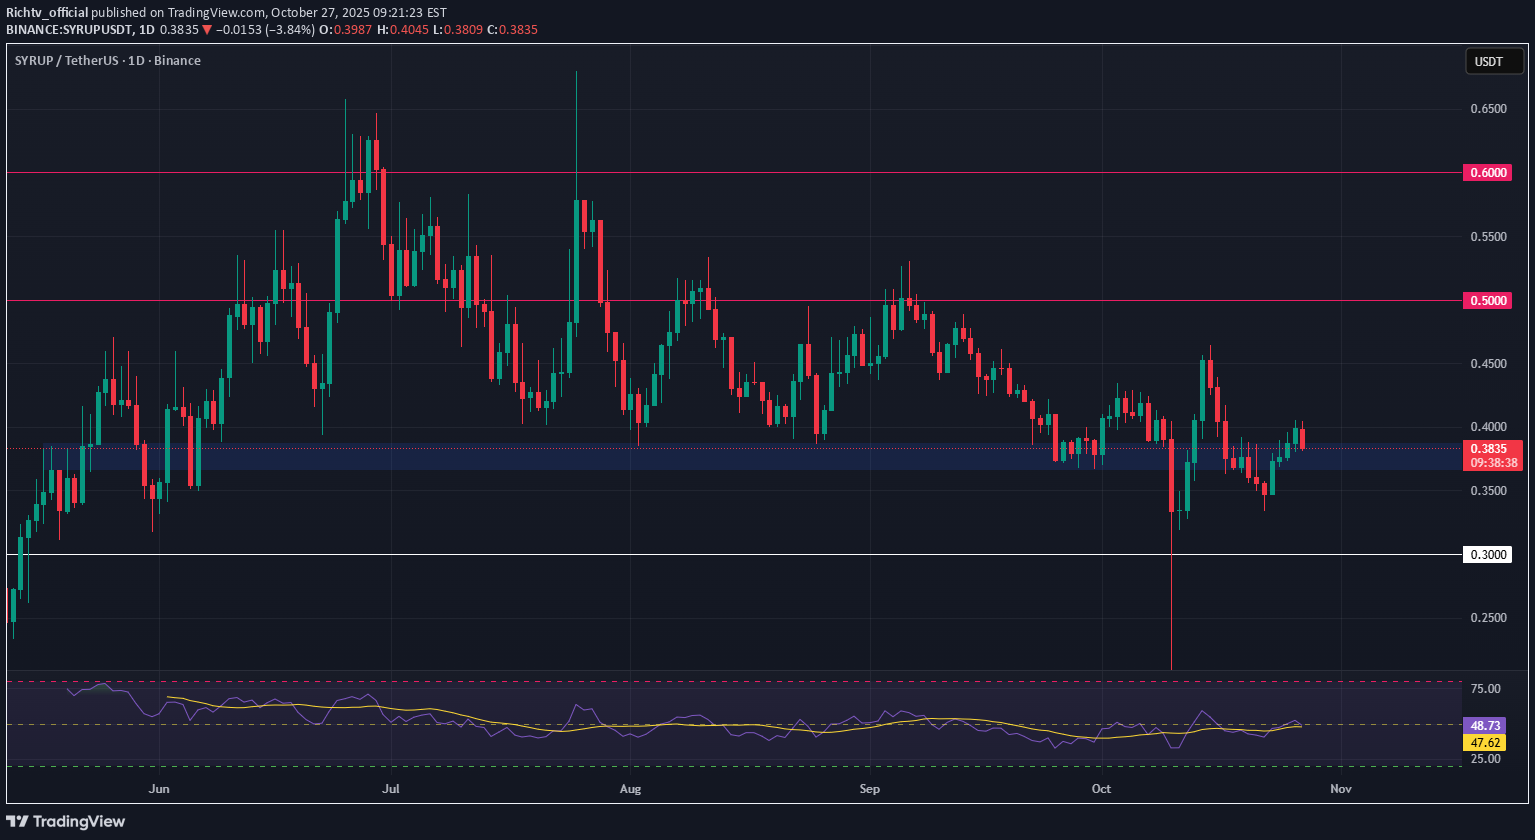
SYRUP is currently trading at a major support area, offering a potential swing trade opportunity for those watching closely. Price has consolidated here before and shown bullish reactions, making it a technically sound zone to monitor for entries. 💡 Trade Plan: Entry Zone: $0.3670 – $0.3870 Targets: $0.50 / $0.60 Stop Loss: $0.30

Bithereum_io
آیا SYRUP در راه صعود است؟ کانال نزولی شکسته میشود و این اهداف منتظرند!

#SYRUP is moving inside a descending channel on the daily chart. In case of a breakout above the channel resistance, the potential targets are: 🎯 $0.4894 🎯 $0.5373 🎯 $0.5851 🎯 $0.6533 🎯 $0.7402 ⚠️ Always remember to use a tight stop-loss and maintain proper risk management.

rasooldavarpanah
تحلیل SYRUPUSDT: فرصت خرید در کف قیمت و استراتژی میانمدت معاملهگران بزرگ!

Analysis of Syrop: Considering the overall market conditions, Syrop has performed very well and shown a strong recovery. This indicates that lower prices have been attractive for many investors — including whales — and liquidity has been flowing in. We’ve placed our entry trigger in a proper zone to have higher confidence in taking risk. Personally, I’ll keep buying on dips and adding gradually for a mid-term outlook. ⚠️ Always take risk and capital management seriously, and make sure to keep enough liquidity for future opportunities. Respect ✌️
CryptoWithJames
تحلیل تکنیکال SYRUP: پتانسیل رشد 75 درصدی با شکست الگوی گُوِه نزولی!

#SYRUP UPDATE SYRUP Technical Setup Pattern: Bullish falling wedge pattern Current Price: $0.4235 Target Price: $0.725 Target % Gain: 75.59% SYRUP is breaking out of a falling wedge pattern on the 1D timeframe. Current price is $0.4235 with a target near $0.725, suggesting around 75% potential upside. The breakout indicates renewed bullish momentum, signaling a possible continuation toward higher levels. Time Frame: 1D Risk Management Tip: Always use proper risk management.
Disclaimer
Any content and materials included in Sahmeto's website and official communication channels are a compilation of personal opinions and analyses and are not binding. They do not constitute any recommendation for buying, selling, entering or exiting the stock market and cryptocurrency market. Also, all news and analyses included in the website and channels are merely republished information from official and unofficial domestic and foreign sources, and it is obvious that users of the said content are responsible for following up and ensuring the authenticity and accuracy of the materials. Therefore, while disclaiming responsibility, it is declared that the responsibility for any decision-making, action, and potential profit and loss in the capital market and cryptocurrency market lies with the trader.