
SUPER
SuperFarm
| تریدر | نوع سیگنال | حد سود/ضرر | زمان انتشار | مشاهده پیام |
|---|---|---|---|---|
 Alpha-GoldFXRank: 31959 | خرید | حد سود: تعیین نشده حد ضرر: تعیین نشده | 11/27/2025 |
Price Chart of SuperFarm
سود 3 Months :
سیگنالهای SuperFarm
Filter
Sort messages by
Trader Type
Time Frame
Alpha-GoldFX
الگوی مثلث نزولی در SUPERUSDT: آماده جهش بزرگ ۲۰۰ درصدی؟
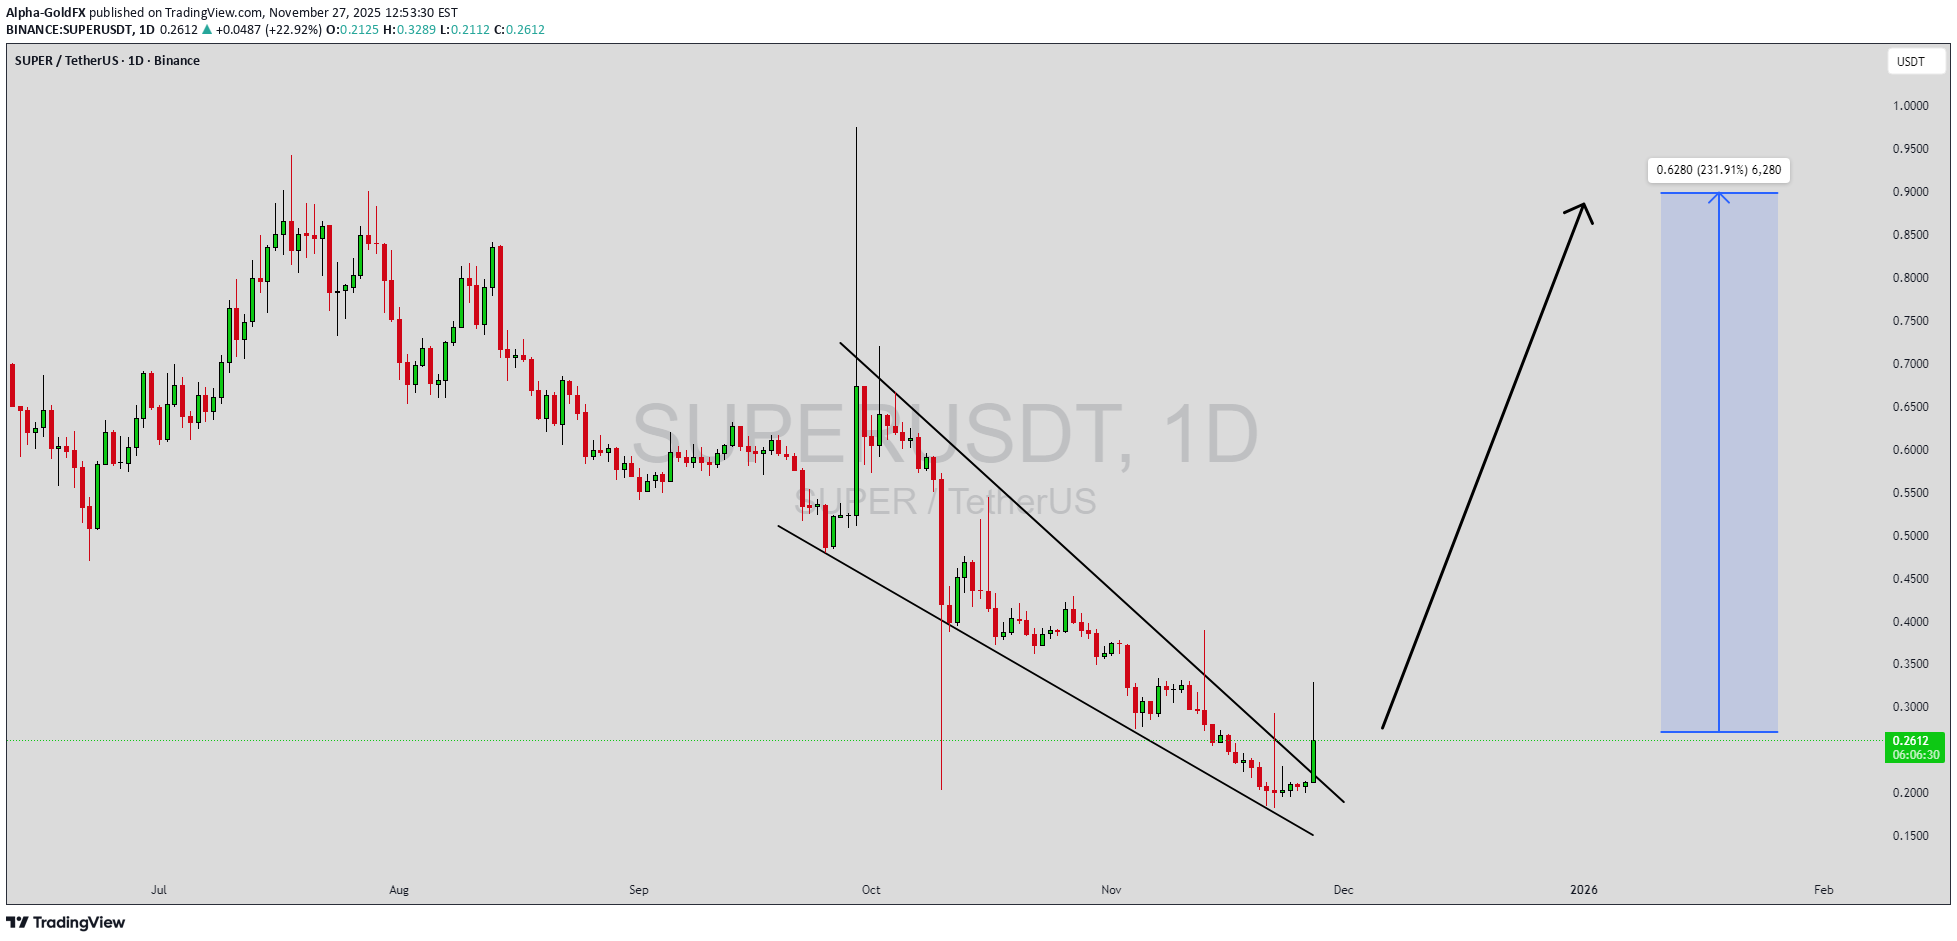
SUPERUSDT is forming a clear falling wedge pattern, a classic bullish reversal signal that often indicates an upcoming breakout. The price has been consolidating within a narrowing range, suggesting that selling pressure is weakening while buyers are beginning to regain control. With consistent volume confirming accumulation at lower levels, the setup hints at a potential bullish breakout soon. The projected move could lead to an impressive gain of around 190% to 200% once the price breaks above the wedge resistance. This falling wedge pattern is typically seen at the end of downtrends or corrective phases, and it represents a potential shift in market sentiment from bearish to bullish. Traders closely watching SUPERUSDT are noting the strengthening momentum as it nears a breakout zone. The good trading volume adds confidence to this pattern, showing that market participants are positioning early in anticipation of a reversal. Investors’ growing interest in SUPERUSDT reflects rising confidence in the project’s long-term fundamentals and current technical strength. If the breakout confirms with sustained volume, this could mark the start of a fresh bullish leg. Traders might find this a valuable setup for medium-term gains, especially as the wedge pattern completes and buying momentum accelerates. ✅ Show your support by hitting the like button and ✅ Leaving a comment below! (What is your opinion about this Coin?) Your feedback and engagement keep me inspired to share more insightful market analysis with you!

sladkamala123
پیشبینی قیمت ارز دیجیتال SUP: آیا صعود به 0.97 دلار ممکن است یا سقوط به زیر 0.16؟
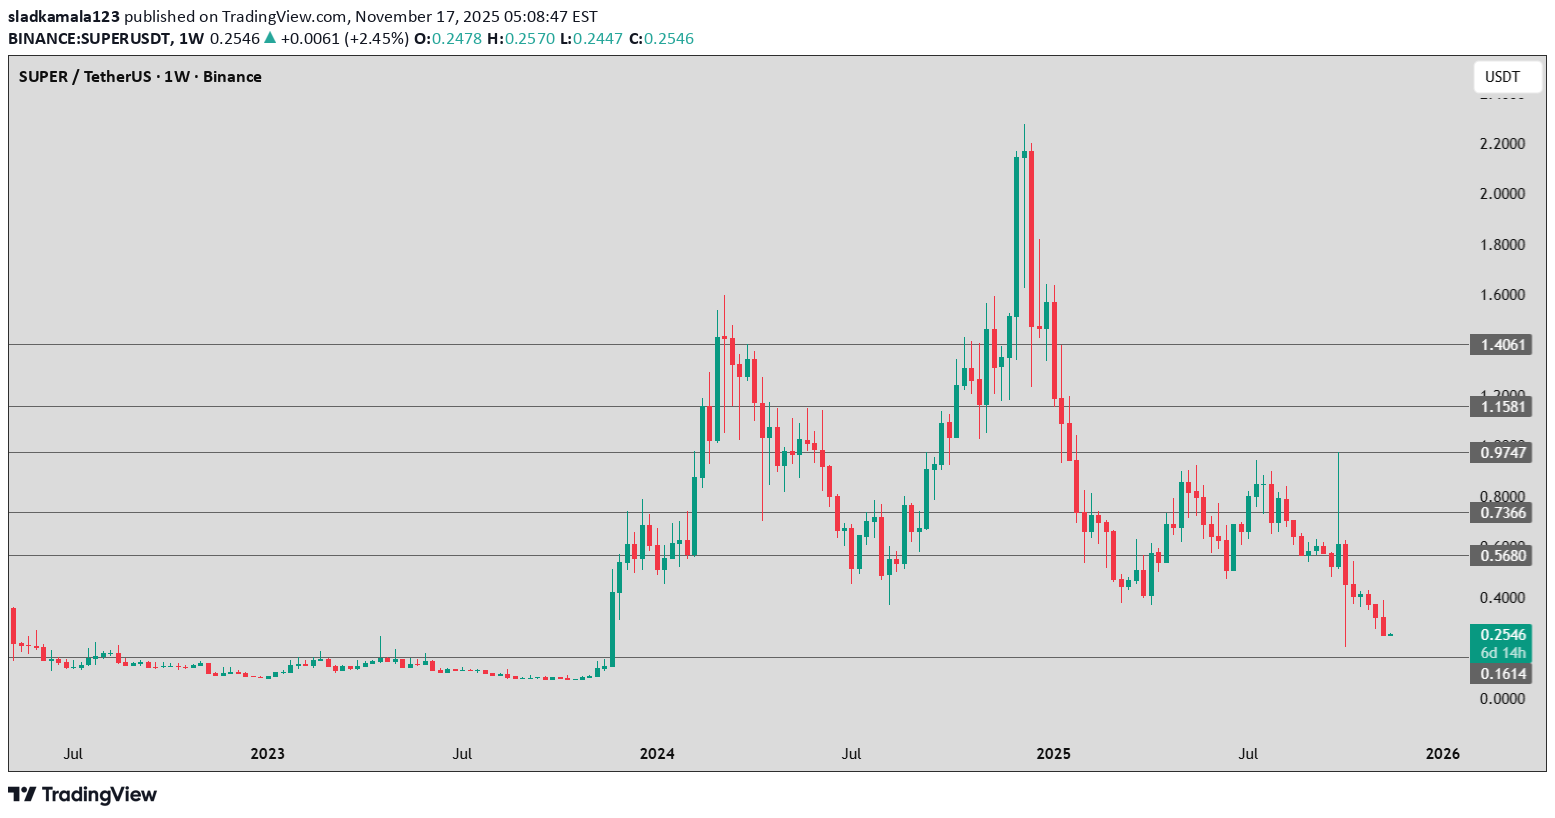
Bullish Scenario (medium–low probability) If the price bounces from 0.25 or 0.16: Target 1 → 0.568 USDT Target 2 → 0.736 USDT Target 3 → 0.974 USDT To confirm a trend reversal, the weekly close should be above 0.568. Bearish Scenario (medium–high probability) If the price falls below 0.1614, the next support zone is around: 0.10 – 0.12 USDT This would signal a continuation of the multi-month downtrend.

AndrewsMarket-Mastery
پایان انتظار؟ سیگنال انفجاری سوپر (SUPER) در الگوی گوه نزولی!

SUPER/USDT is showing a strong structural setup that’s catching attention in the market. The price action appears to be forming a falling wedge, which is typically a bullish reversal pattern. Given the recent pick-up in volume and the squeeze of price inside the narrowing range, the setup suggests that we could be on the precipice of a breakout. If the breakout occurs with conviction, the potential upside is meaningful given the current base and historical levels of this asset. From a fundamental standpoint, SUPER (the native token of SuperVerse) is positioned within the high-interest realms of Web3 gaming, NFTs, and metaverse infrastructure. It has a circulating supply in the ballpark of ~637 million tokens, placing it in a size range where upside can still be significant if adoption ramps. Its ecosystem narrative—gamefi, NFT marketplace, user friendly Web3 onboarding—maps into the high-traffic crypto search keywords right now. Strong volume and renewed investor interest suggest that the project may be waking up after a period of consolidation. On the technical side, a clean breakout above the wedge’s upper trendline, ideally followed by a retest of that breakout level, would increase the odds of a sustained move. Given the token’s narrative and structural setup, the reward-to-risk looks interesting. Traders should monitor key resistance zones, volume confirmation, and market breadth to validate the move. If volume validates the breakout, targets could be multiples of current levels depending on the breakout momentum.

AlienOvichO
تحلیل هفتگی SUPERUSD: سقوط احتمالی به زیر ۱۰ سنت؛ آیا کف قیمت کجاست؟
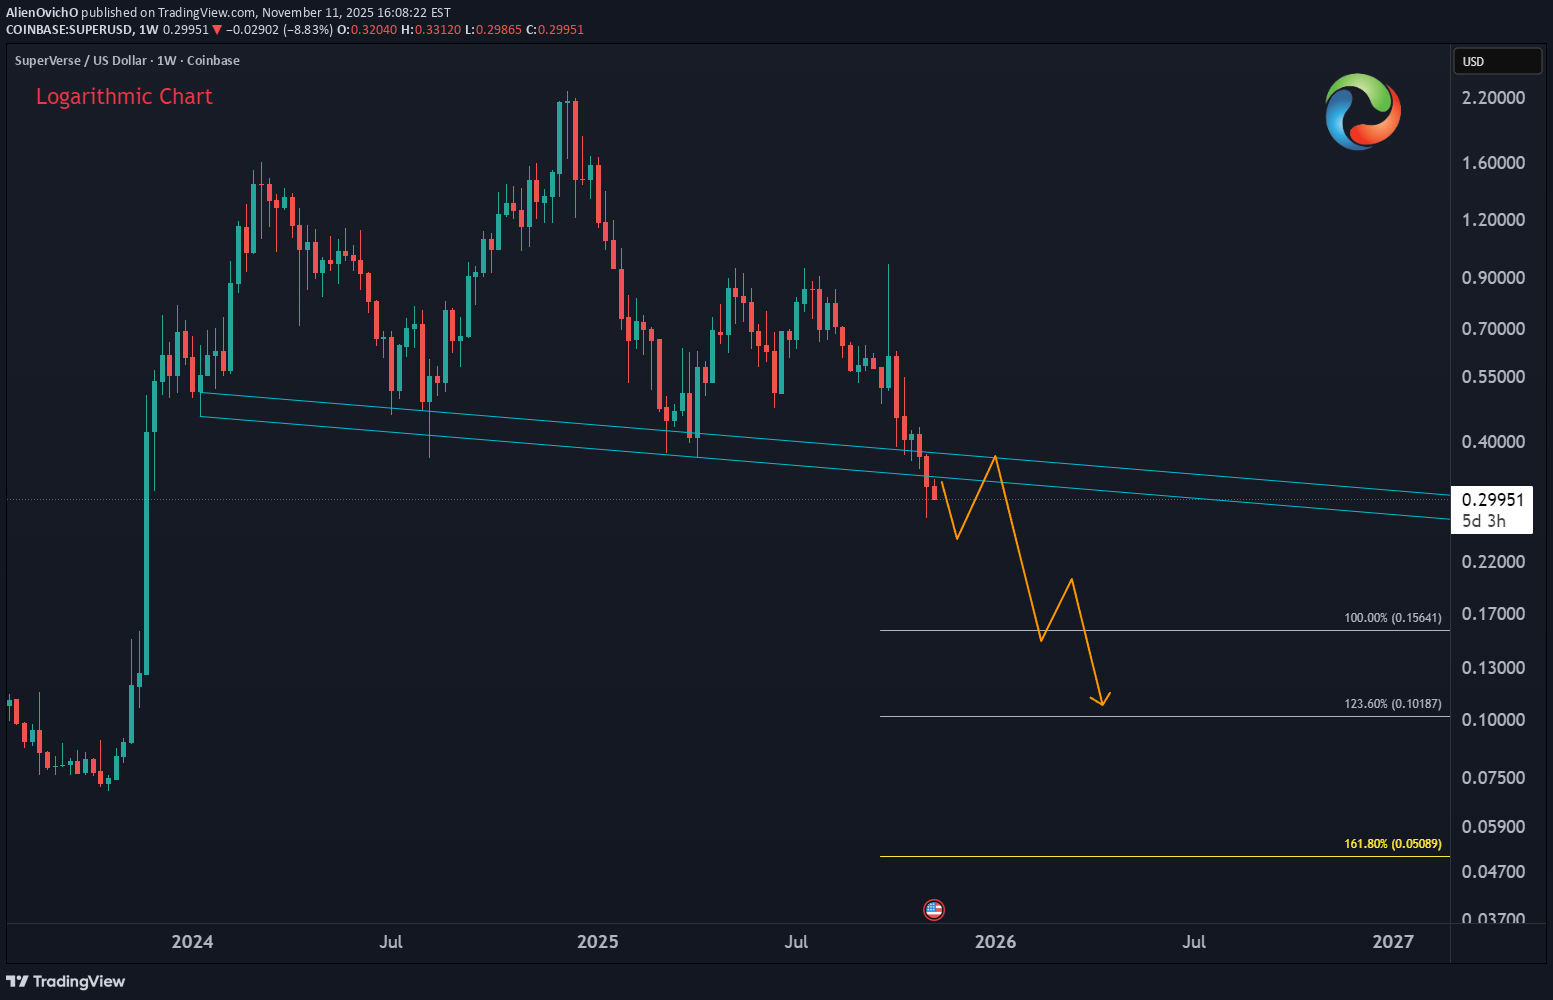
📉 SUPERUSD continues to trade in a bearish sequence from the December 2024 peak, with further downside expected toward the $0.15–$0.10 zone in the coming months. Price has already broken below the neckline of a head & shoulders structure, which projects an even lower target below $0.10.

Kapitalist01
تحلیل سریع بازار: سود 2% و حد ضرر 0.30% (یادداشت شخصی سرمایهگذاری)
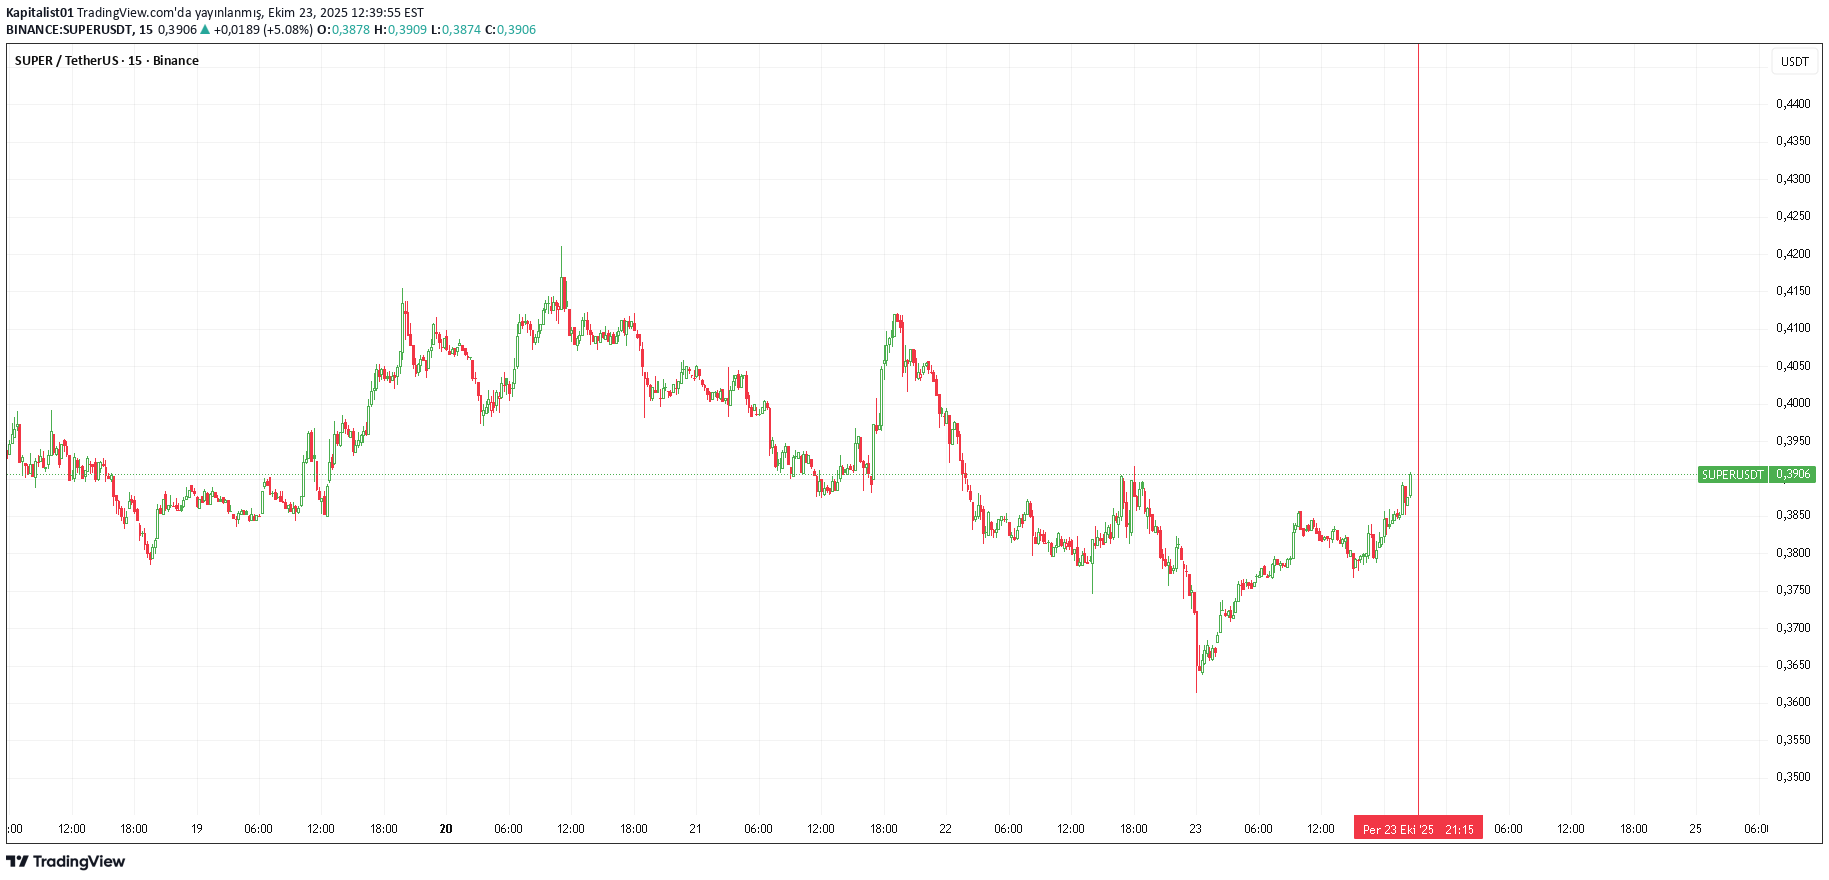
with 0.30 percent stop margin over 2 percent note to self It is not investment advice. note to self

KooshiCryptoGem
پیشبینی بازگشت قیمت به منطقه سبز با روش گن: تحلیل موجها (نظر شخصی)
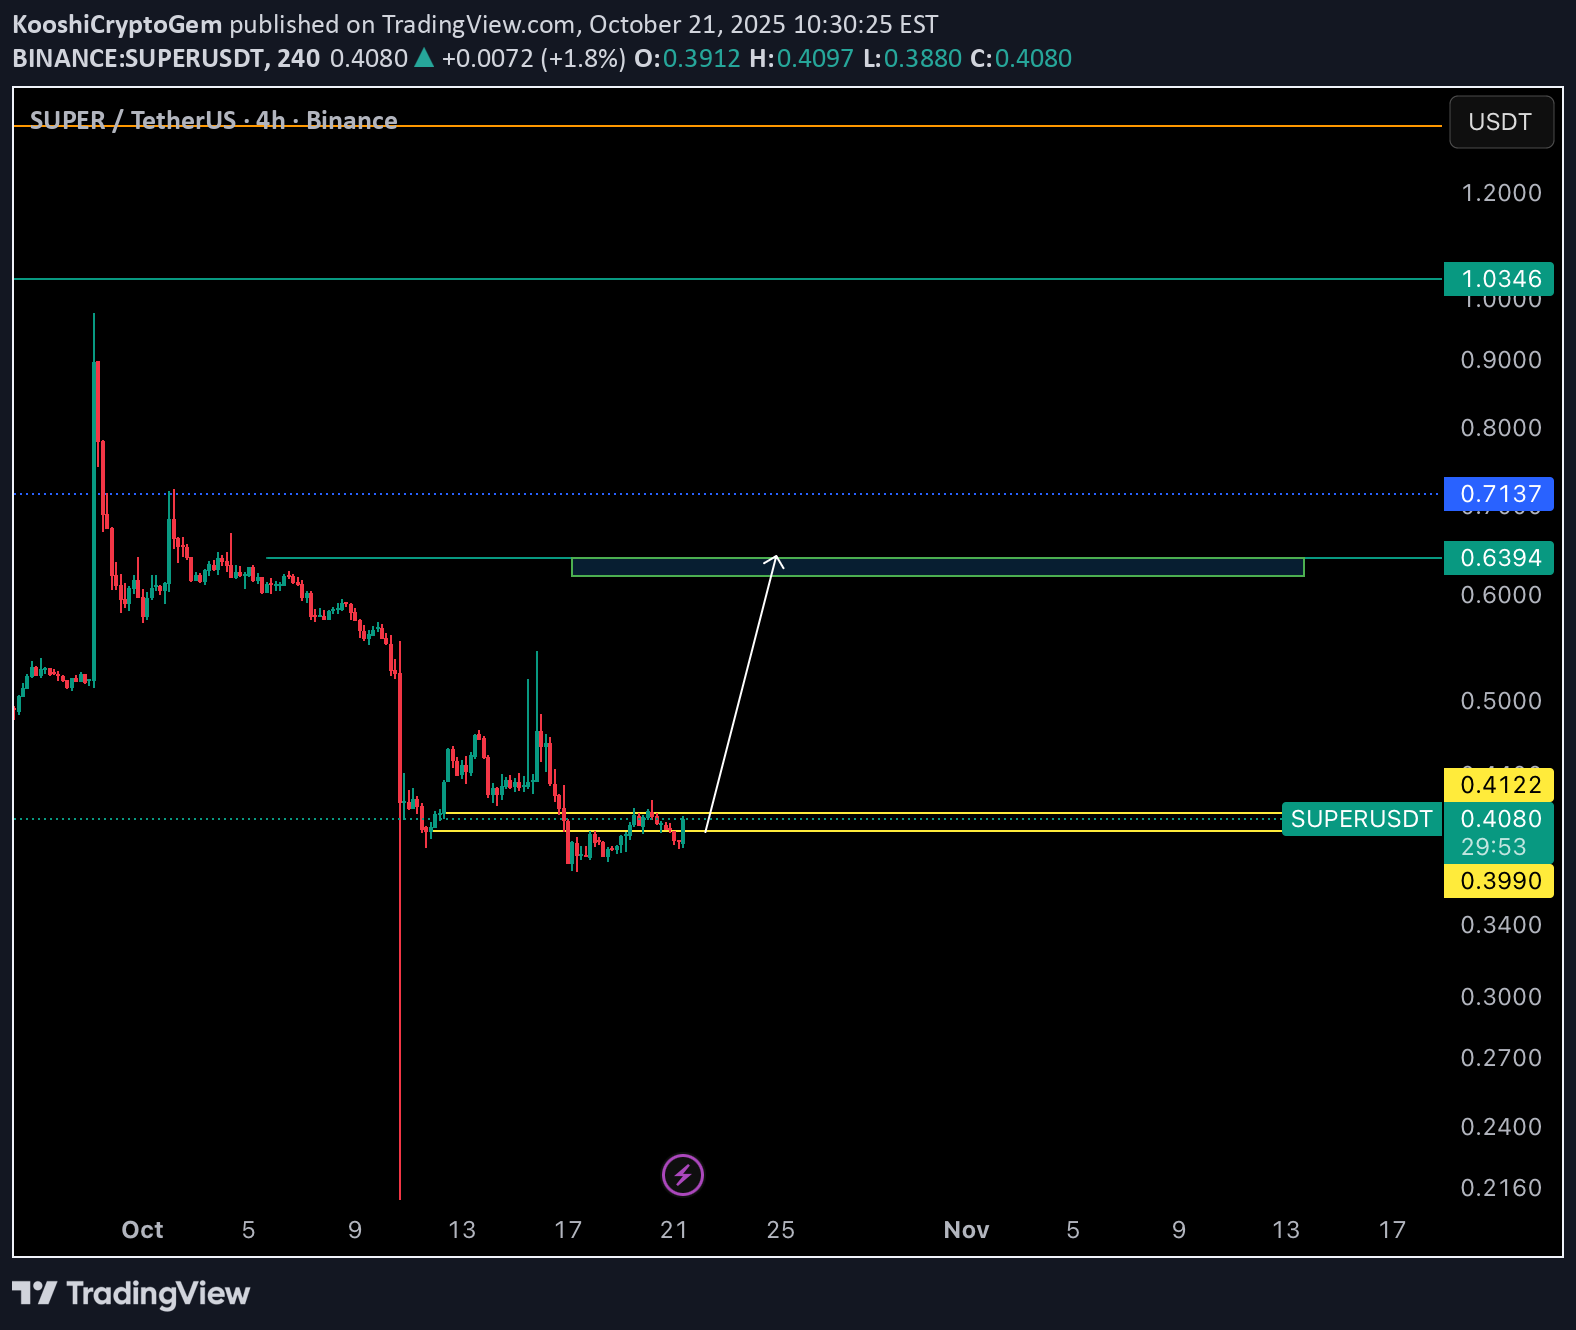
According to the analysis of the waves and the help of the Gann method, it can be expected that the price will return to the green zone again. This is my personal opinion. Please don't use it as your trading criteria. Good luck

Mentor_Michael03
شوک بزرگ در SUPER/USD: آیا کف قیمتی تشکیل شده و صعود قدرتمند در راه است؟

Hello traders and investors, here’s my detailed outlook on SUPER/USD — and this setup is starting to look really interesting. After a continuous downside wave, price has now reached a major support zone around 0.48–0.49, an area that previously triggered a strong bullish rally. The candles are showing early signs of exhaustion from sellers, suggesting we might be witnessing the final phase of distribution before accumulation kicks in again. Looking closely, there’s a clear pattern of lower highs and equal lows, which often traps late sellers before a strong reversal. If price makes one more sweep down into 0.47–0.45, that could be the liquidity grab the market needs before turning up. Once we get a clean breakout above 0.55, that’s where the real confirmation comes in — indicating a potential trend reversal and a start of a fresh bullish leg. In that case, I’ll be targeting 0.60 first, and then possibly 0.69, which aligns perfectly with the previous resistance and dynamic envelope levels. As long as price holds above 0.47, the bullish outlook remains valid. A breakdown below that would invalidate the setup, but for now, the structure looks poised for a strong bounce. So, my plan is simple — watch how price reacts at this zone, stay patient, and let the market show its hand. Smart money usually moves quietly before the breakout, and I think we’re in that quiet stage right now. Technical View: Support zone: 0.47–0.45 (accumulation base) Immediate resistance: 0.55 (confirmation level) Next targets: 0.60 and 0.69 Bias: Short-term neutral → mid-term bullish Summary: SUPER/USD looks ready for a strong technical rebound. I expect some sideways movement before a breakout, but once bulls take over, the upside momentum could accelerate fast.
Kapitalist01
تحلیل سریع نمودار: نکته مهم سرمایهگذاری کوتاهمدت (19:07)

short term It is not investment advice... 19:07 candle with stop Margin around three percent, note to self.

Mindbloome-Trading
Superverse Is About to Make Someone Rich… and Wreck Others

Superverse is sitting on a razor’s edge. -If we can close above $0.4681, momentum opens the door to $1.19… and possibly the $1.80 range. -But if price can’t hold $0.4681, then a drive down to $0.25 comes into play. What makes this setup interesting is how compressed the risk/reward window is ;one close decides whether we see a 3–4x move higher… or a brutal halving. Most traders will only react after the move. The real edge comes from knowing what to look for before it happens. 👉 I’m curious; if you had to choose, would you rather position for the upside breakout… or wait for the flush into $0.25?

minno91
SUPER – Heavy Trend with Strong Market Cap Support

SUPER is trending heavily today, showing strong momentum and buyer interest. With a market cap just under 500M, it steps into the range where bigger investors and institutions begin to take notice, suggesting that this is more than just a typical pump-and-dump scenario. This trend looks promising for a sustained move higher, so keeping an eye on price action and volume will be key to riding this momentum successfully. Trade with discipline, manage your risk, and let’s see where the price goes! Good luck and happy trading! 🚀
Disclaimer
Any content and materials included in Sahmeto's website and official communication channels are a compilation of personal opinions and analyses and are not binding. They do not constitute any recommendation for buying, selling, entering or exiting the stock market and cryptocurrency market. Also, all news and analyses included in the website and channels are merely republished information from official and unofficial domestic and foreign sources, and it is obvious that users of the said content are responsible for following up and ensuring the authenticity and accuracy of the materials. Therefore, while disclaiming responsibility, it is declared that the responsibility for any decision-making, action, and potential profit and loss in the capital market and cryptocurrency market lies with the trader.