
STG
Stargate Finance
| تریدر | نوع سیگنال | حد سود/ضرر | زمان انتشار | مشاهده پیام |
|---|---|---|---|---|
No results found. | ||||
Price Chart of Stargate Finance
سود 3 Months :
سیگنالهای Stargate Finance
Filter
Sort messages by
Trader Type
Time Frame

Alpha-GoldFX
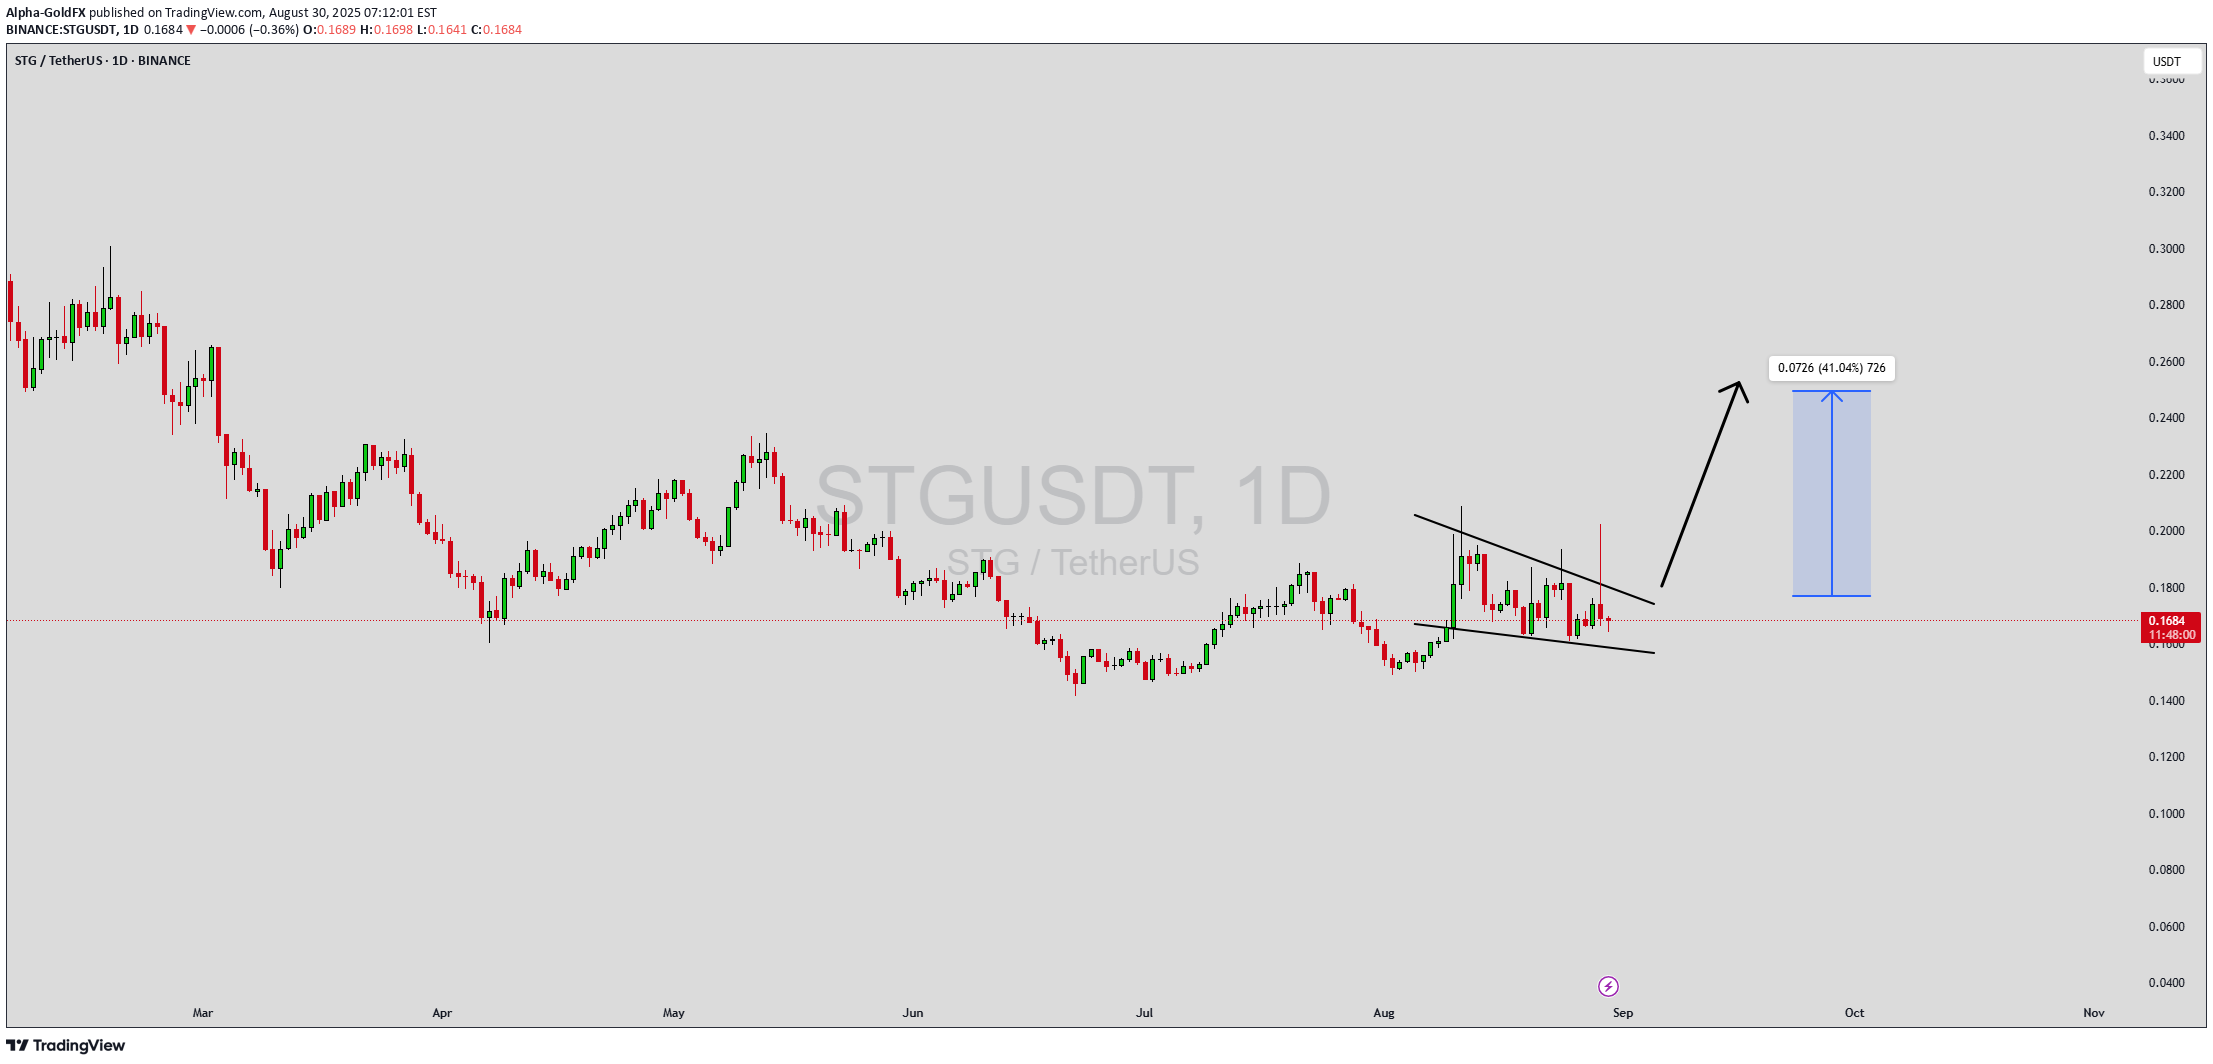
SIGNUSDT Forming Falling Wedge
SIGNUSDT is currently forming a falling wedge pattern, which is considered one of the strongest bullish reversal setups in technical analysis. This structure suggests that sellers are losing strength while buyers are quietly stepping in, preparing for an upside breakout. With strong support levels holding well, the chart points toward an upcoming move that could generate gains in the range of 30% to 40%+. Trading volume has remained steady, reflecting consistent interest from market participants. If volume increases alongside a breakout, it would add significant confirmation to the bullish outlook. This could pave the way for a strong rally, making SIGNUSDT an attractive opportunity for both short-term traders and long-term investors. Market sentiment is showing improvement as investors increasingly recognize the potential of this project. The technical setup, combined with growing community attention, signals that SIGNUSDT could soon be poised for a breakout-driven rally that aligns well with current bullish momentum in the crypto space. ✅ Show your support by hitting the like button and ✅ Leaving a comment below! (What is You opinion about this Coin) Your feedback and engagement keep me inspired to share more insightful market analysis with you!

Bithereum_io
STGUSDT 1D
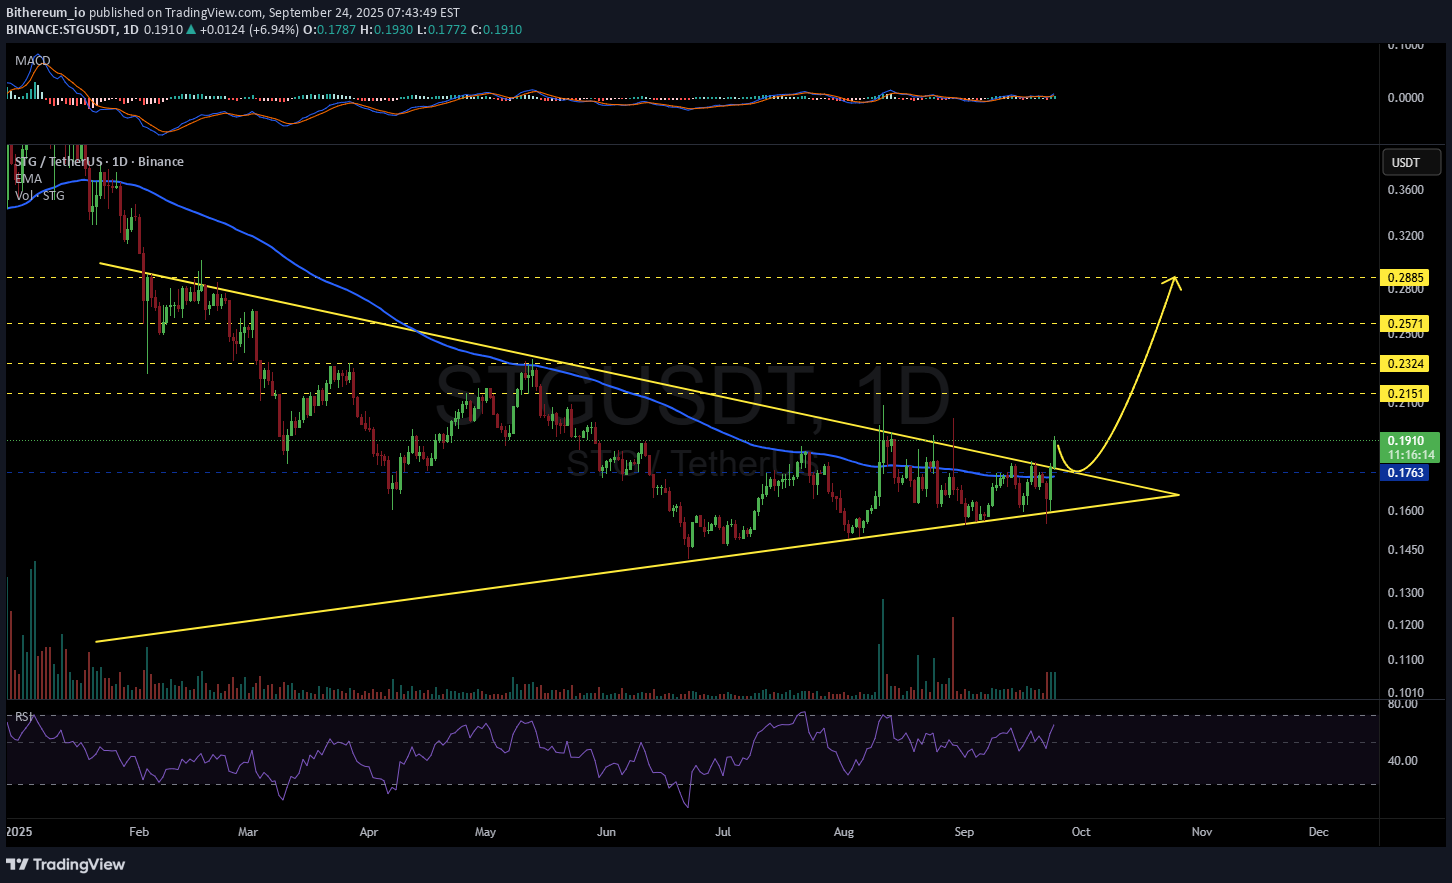
#STG has broken above the symmetrical triangle resistance on the daily chart. A retest of the triangle and the daily EMA100 is possible before the next leg up. In case of a successful bounce, the potential targets are: 🎯 $0.2151 🎯 $0.2324 🎯 $0.2571 🎯 $0.2885 ⚠️ Always remember to use a tight stop-loss and follow proper risk management.

CryptoWithJames
STGUSDT UPDATE
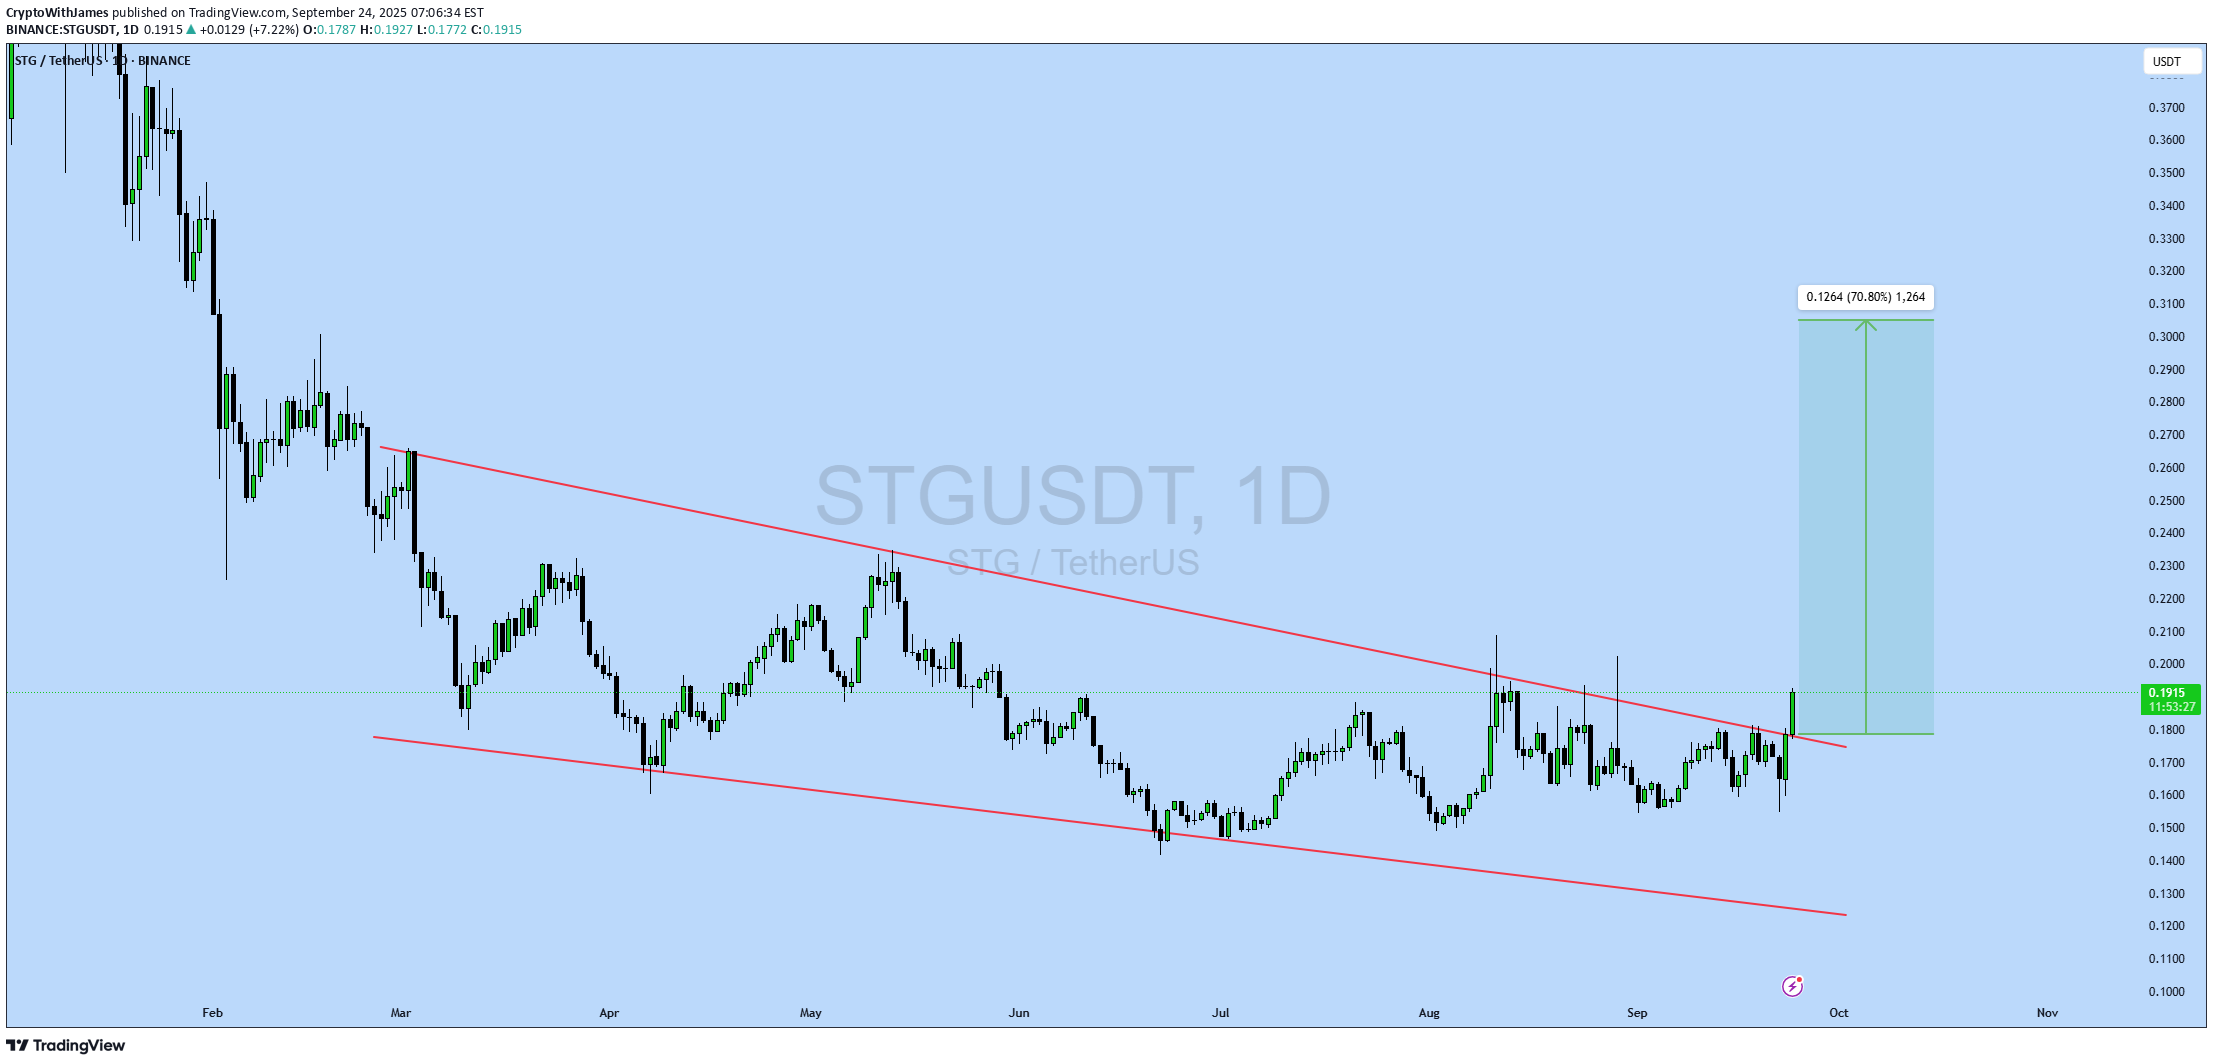
#STG UPDATE STG Technical Setup Pattern: Bullish falling wedge breakout Current Price: $0.1916 Target Price: $0.318 Target % Gain: 70.80% STG has confirmed a breakout from a falling wedge on the 1D timeframe, signaling strong bullish momentum with upside potential toward $0.318. Always use proper risk management when trading.
Alpha-GoldFX
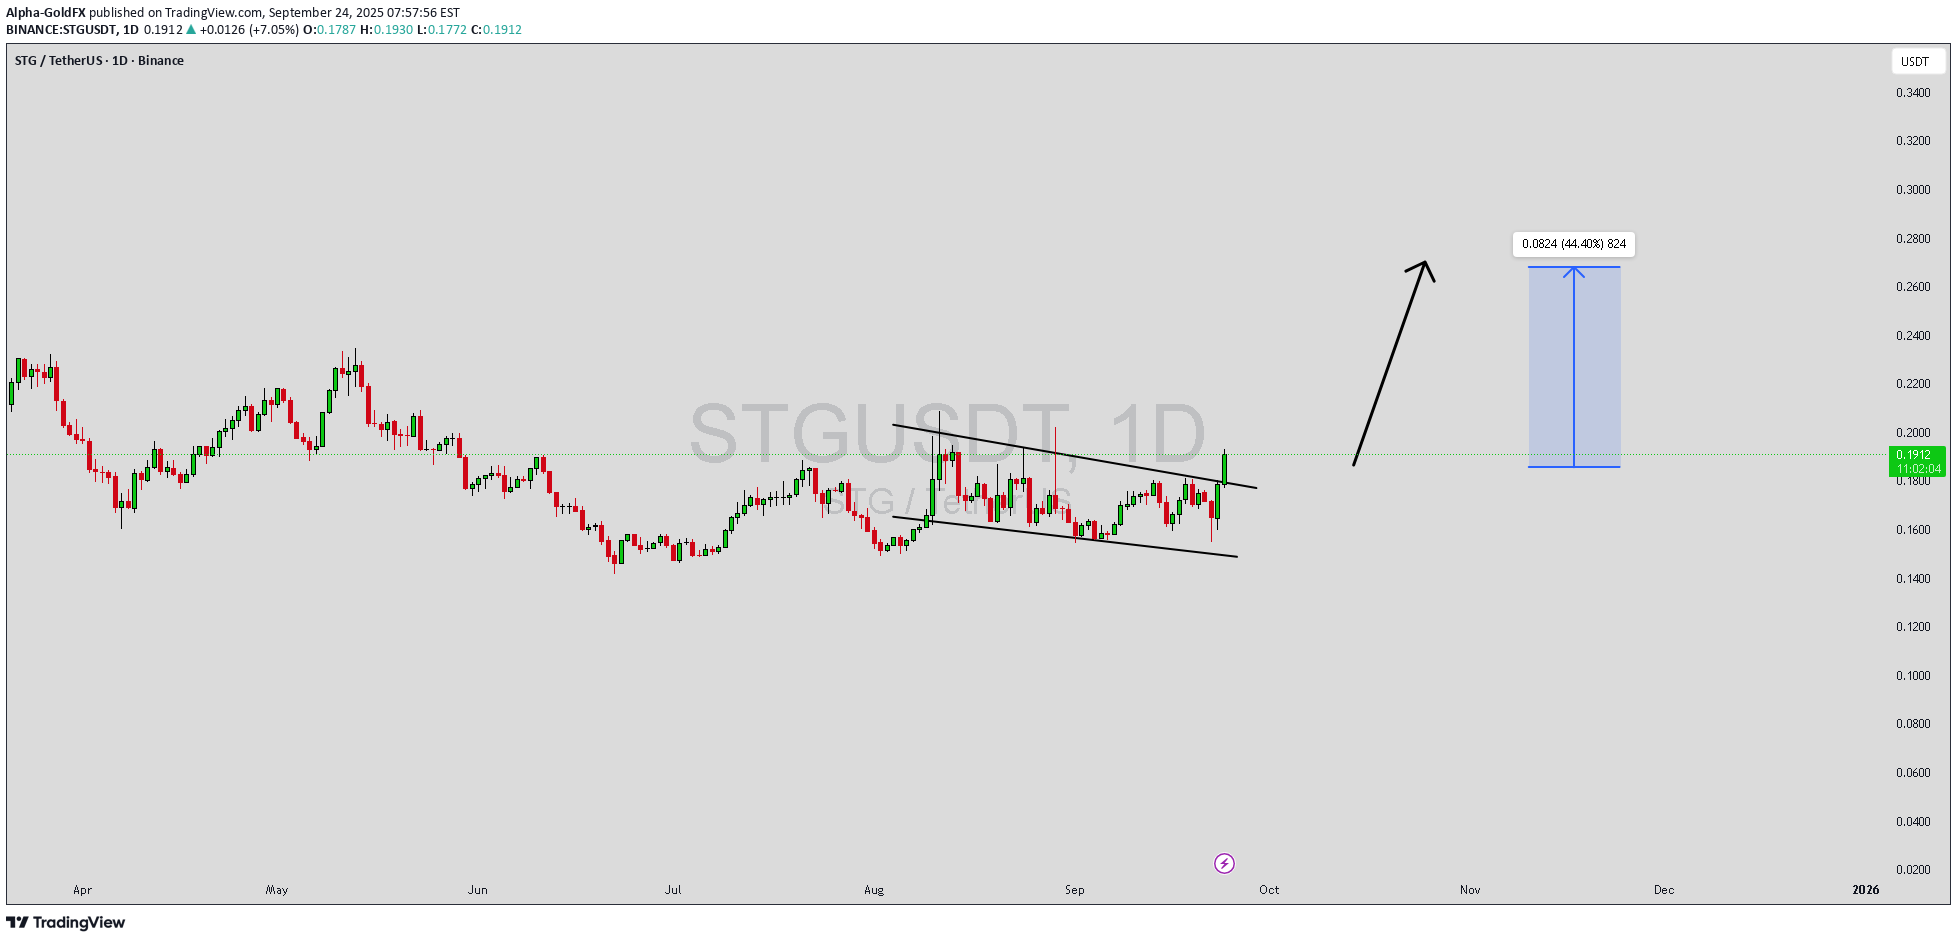
STGUSDT Forming Symmetrical Triangle
STGUSDT is currently consolidating within a Symmetrical Triangle pattern, a formation that often signals a potential breakout. This type of structure generally represents a period of indecision in the market where buyers and sellers are in balance, but as the range narrows, a strong move is usually triggered. With volume showing signs of strength, the probability of an upward breakout increases, opening the door for a solid bullish continuation. Traders are eyeing a potential 30% to 40% gain from the current levels if the breakout confirms to the upside. The contracting price action inside the triangle suggests that market participants are building positions, and once the breakout occurs, volatility is expected to rise. Such setups are considered reliable when paired with good volume, making STGUSDT a coin of interest at the moment. Investor confidence is also growing as more attention shifts toward this project, adding further support to the bullish outlook. The increasing participation shows that traders are preparing for possible momentum that could push STGUSDT into a new price zone. Holding above key support levels will be crucial to maintaining this bullish structure. ✅ Show your support by hitting the like button and ✅ Leaving a comment below! (What is You opinion about this Coin) Your feedback and engagement keep me inspired to share more insightful market analysis with you!

asilturk
STG Şaşırtabilir Her An

Stargate Finance (STG) is positioned as Omnichain, which operates in the field of decentralized finance (defi), as a very chain liquidity transfer protocol. STG allows local (native) asset transfers between different blok chains and promises “instant guaranteed finality” in transactions. The market value of $ 185 mmilyon is 1 billion maximum of 1 billion units STG Coin, Unified Liquidity Pools: Users can access a single liquidity pool, installed on the LayerZero infrastructure; In this way, very chain (omnichain) makes communication and asset transfer possible ... Although Stargate does not offer an open roadmap (Roadmap), suggestions are shared and voted and implemented in the community forum. Blockchain Integrations: Ethereum, Avalanche, Polygon, BNB Chain, Arbitrum, Optimism, Fantom supports a large number of chains. As the advantages of really trouble-free and fast cross-Chain liquidity transfer: It offers high security, decentralization and speed balance by analyzing the problem of “Bridging Trilemma” problem, various income opportunities: LP providers earn process fees, Extra STG Extra STG Extra STG. In addition to the risk of the market, STG is open to price fluctuations. Intensive Competition: Competing with many other cross-chain and defi projects can reduce the advantages. High supply and inflation risk: Annual supply inflation may be high; This can put pressure on the price (according to Coincodex data, STG's annual supply inflation is around 223 %) Price performance is weak: STG has lost a significant value from the summit of all times ... Technically, we can say that it is crawling in the bottoms and places, but for two days, a good volume and momentum dominated the medium and long valley levels can be made for the levels .... I do not specify the target price, but we can say that it has broken its part (Duke). I wish you plenty of gains

deepumeena996
My corrent Long position STG
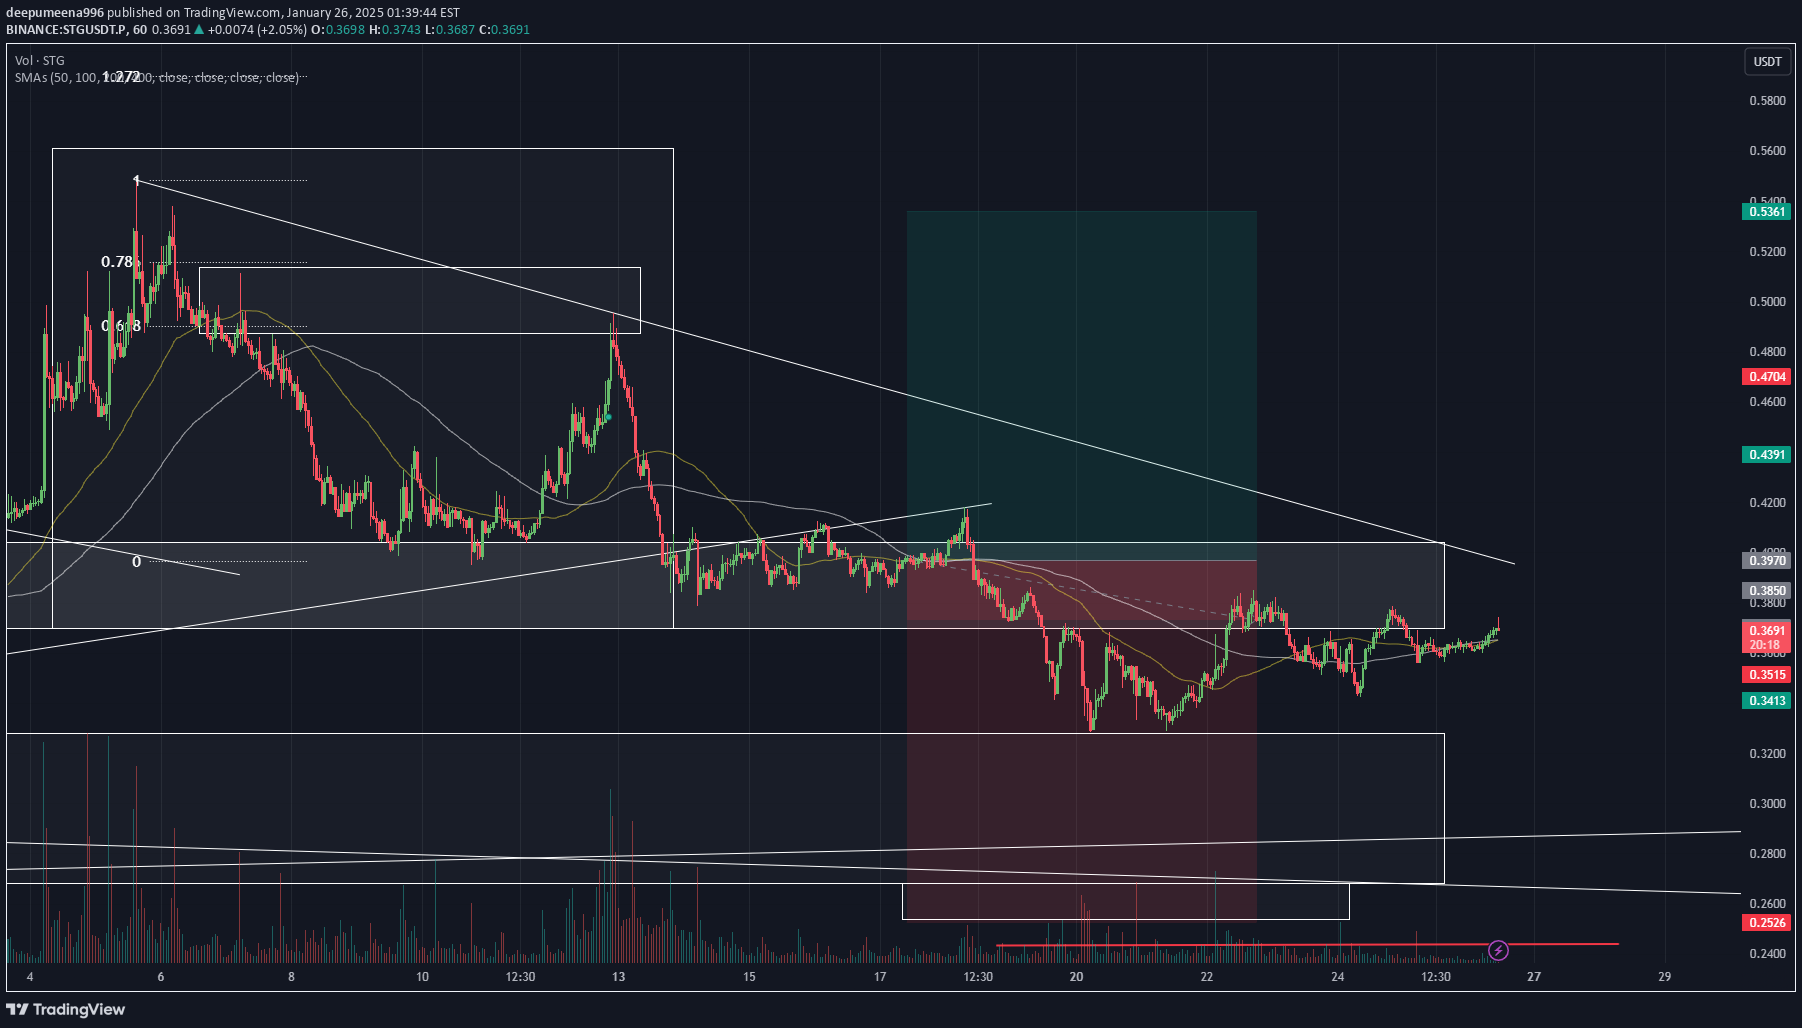
let see what happen its look good if its go down ill be add more

Abdihalim1
STG/USDT Bearish Outlook: Downtrend Confirmed - Watch Key Levels
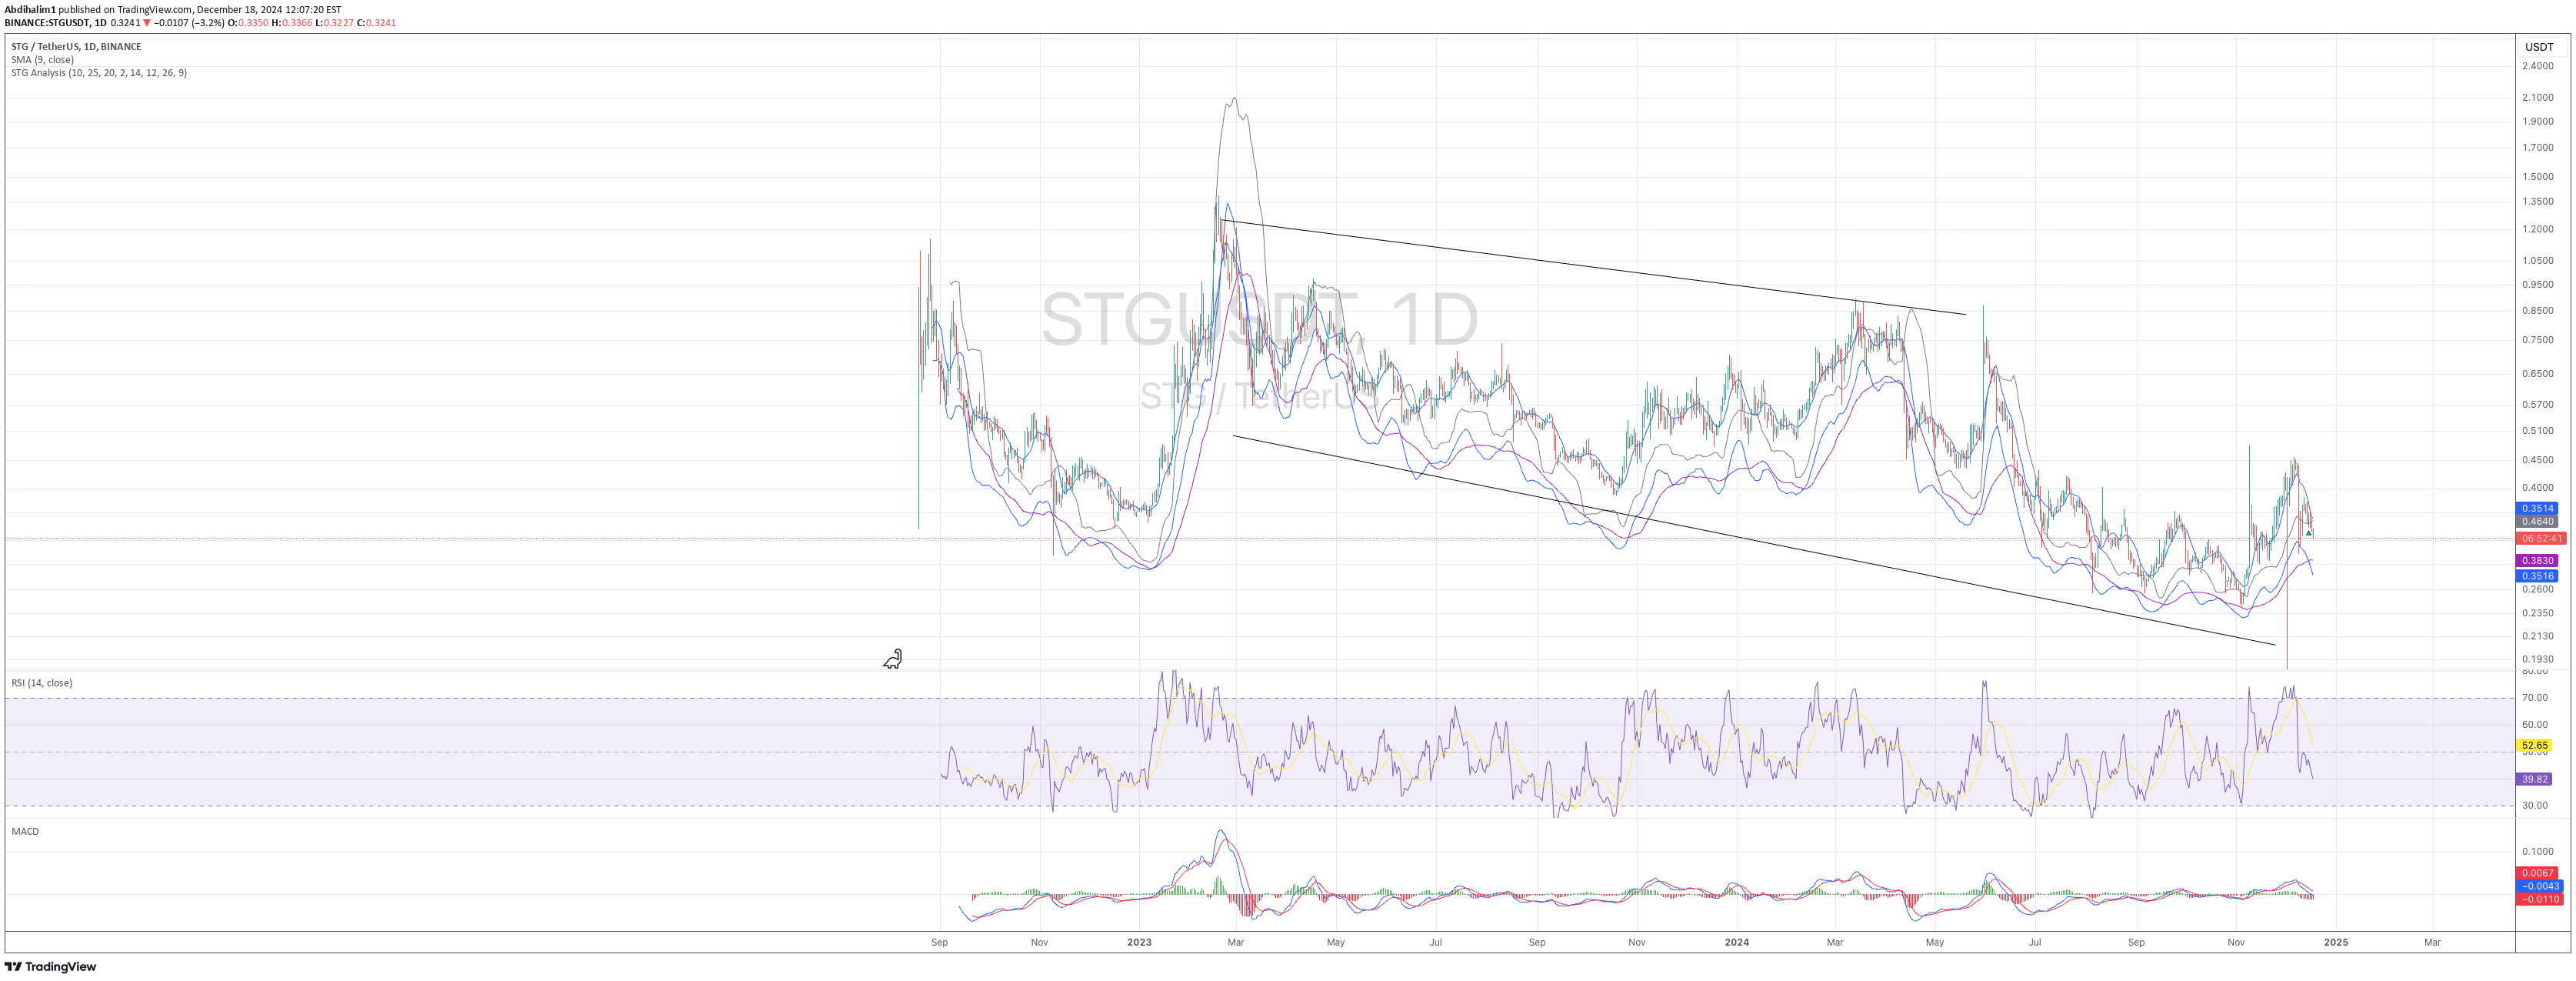
📉 STG/USDT is showing a strong bearish trend across multiple timeframes. Following a pullback, the price is under pressure, indicating potential for further downside. This analysis highlights key support/resistance levels, trend directions, and potential trading scenarios. Timeframe Analysis: 5min: 🐻 Price below 20 SMA, RSI < 50, Bearish MACD. Short-term selloff. 30min: 🐻 Price below 20 SMA, RSI < 50, Bearish MACD. Bearish continuation. 1H: 🐻 Price below 20 SMA, RSI < 50, Bearish MACD. Bearish continuation, possible consolidation. Daily: 🐻 Price below 20 SMA, RSI < 50, Bearish MACD. Clear downtrend, potential for further downside. Key Levels: Support: $0.30 (psychological), $0.28, $0.25 Resistance: $0.33, $0.36 Indicators: 20 SMA: Price below on all TFs = Bearish. RSI: < 50 across all TFs, indicating bearish momentum. MACD: Bearish crossovers below zero line across all TFs. Potential Scenarios: Bearish Continuation: Price likely to test lower supports at $0.28 & $0.25. Double Bottom Potential: 4H chart shows potential formation for double bottom, watch for confirmation and neckline breakout. Consolidation: A period of sideways trading may also be seen. Trading Strategy: SELL/HOLD: Recommended to sell or hold positions with stop losses. Short Positions: Consider shorts on rallies to $0.33, stop-loss above. Take Profit: Target $0.28 initially, then $0.25. Stop Loss: For shorts, consider a stop loss above $0.33. Move existing stop losses down to $0.32 or $0.31. Avoid Buying: Downtrend is strong, avoid buying. Risk Management: Monitor for oversold conditions, which doesn't guarantee a reversal. Be cautious of shifts in market sentiment. Keep an eye on overall crypto market correlation. #STG #STGUSDT #Crypto #Trading #TechnicalAnalysis #Bearish #Altcoin #TradingView
Abdihalim1
STGUSD Technical Analysis: Bulls taking charge?
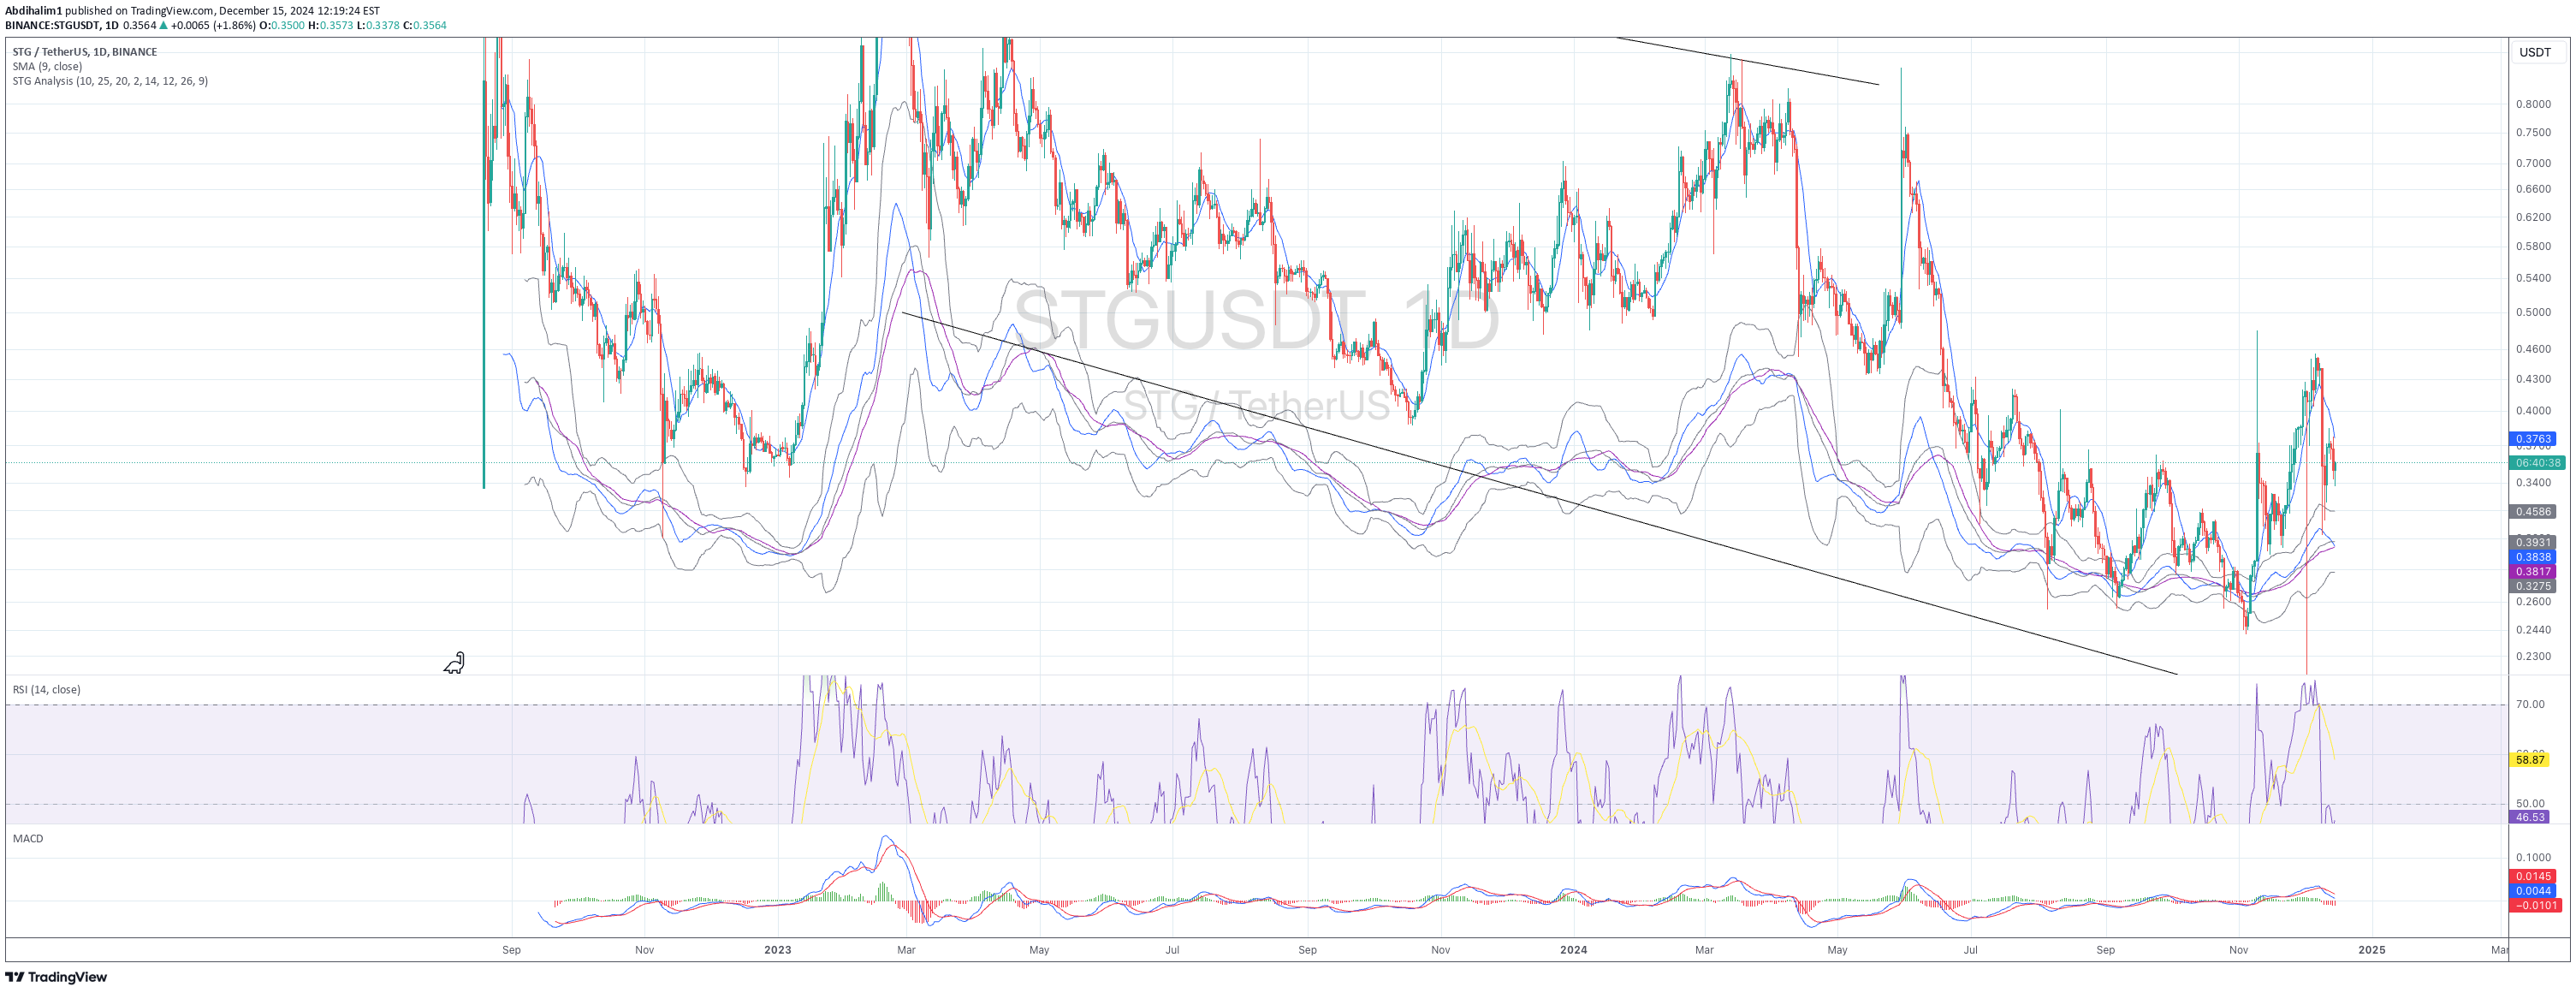
STGUSDT is showing promising signs of a potential trend reversal, with several technical indicators aligning in favor of the bulls. Evidence for a Bullish Reversal: Strong Support: The recent bounce from the $0.33 support level demonstrates strong buying interest at this key level. Resistance Breakout: The price has convincingly broken above the resistance zone of $0.37 - $0.38, signaling a potential shift in momentum. MACD Confirmation: The MACD has crossed above the zero line and confirmed a bullish crossover, further supporting the bullish scenario. Healthy Volume: The volume during the recent upward price action has been relatively healthy, indicating genuine buying conviction. Potential Upside Targets: Short-term Target: The descending trendline, currently around $0.40, represents the first major obstacle for the bulls. A break above this trendline could open the door for further gains. Medium-term Target: If the bullish momentum continues, the next target could be the previous high around $0.43. Risk Management: Stop-loss: Traders can consider placing a stop-loss order below the recent swing low around $0.35 to protect against a potential reversal. Trailing Stop: As the price moves higher, consider using a trailing stop-loss to lock in profits and manage risk. Conclusion: STGUSDT appears to be entering a bullish phase, with several technical indicators supporting this outlook. While some risks remain, the potential rewards for the bulls seem to outweigh the risks at this point.

EtoYa777
STG Possible Scenario
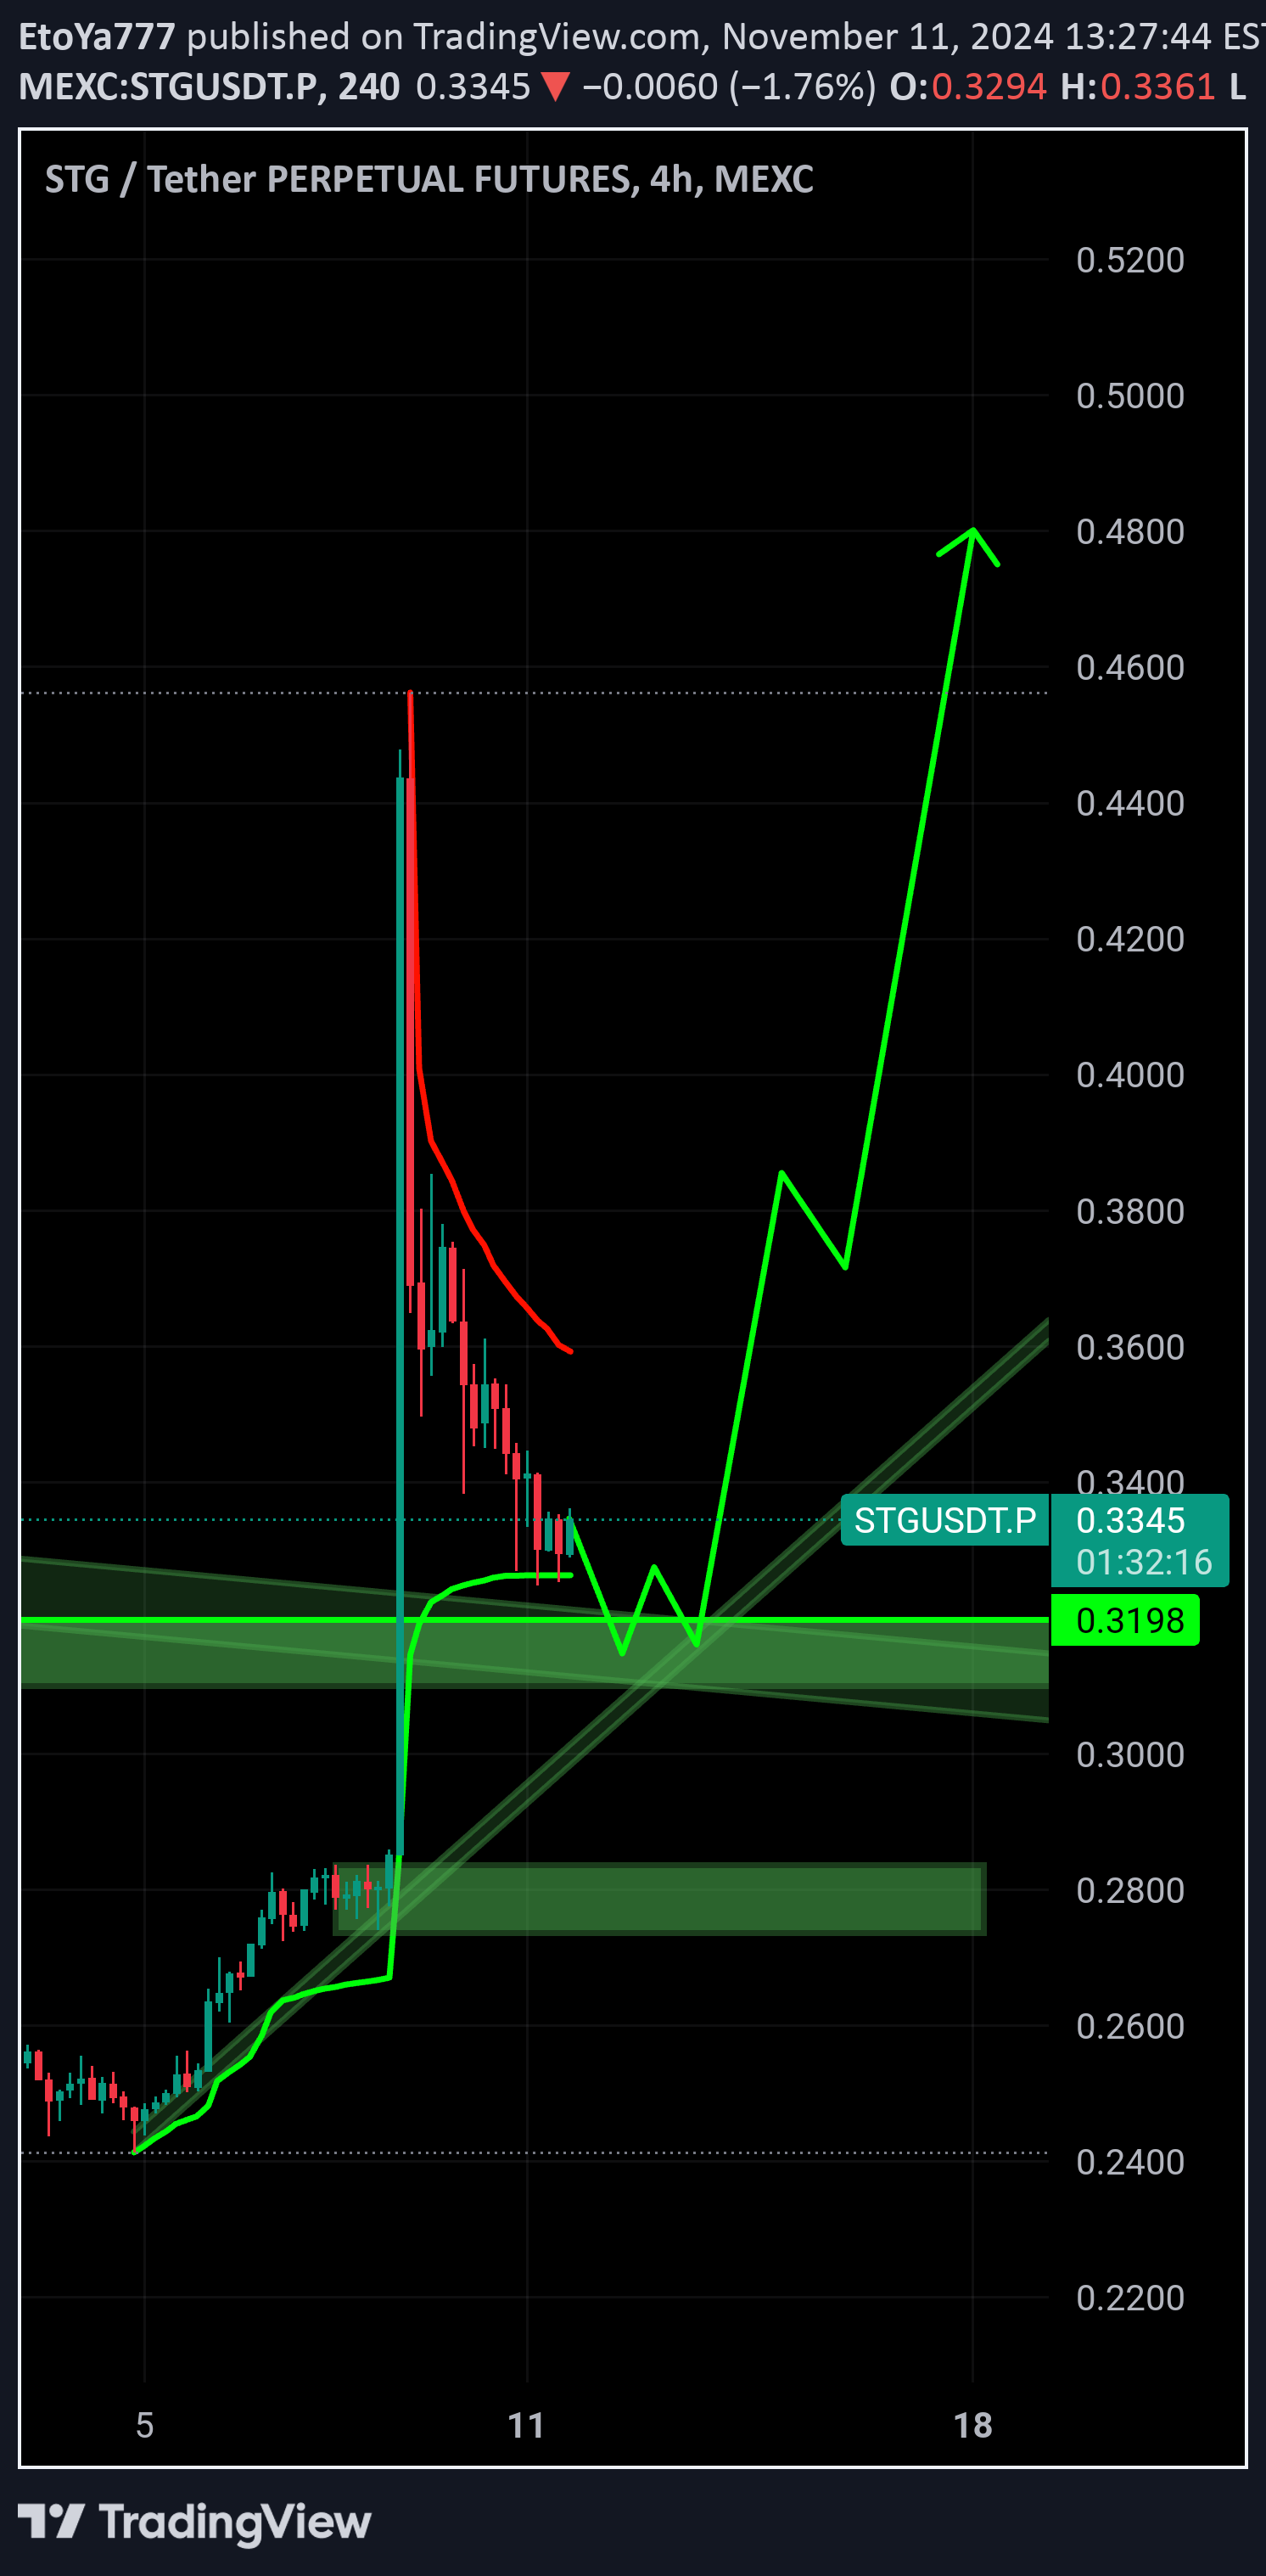
STG Possible Scenario Breakout of main trendline Retest of big Breakout Breakout of MA

DeaLmooRT
STGUSDT Hareket başladı.
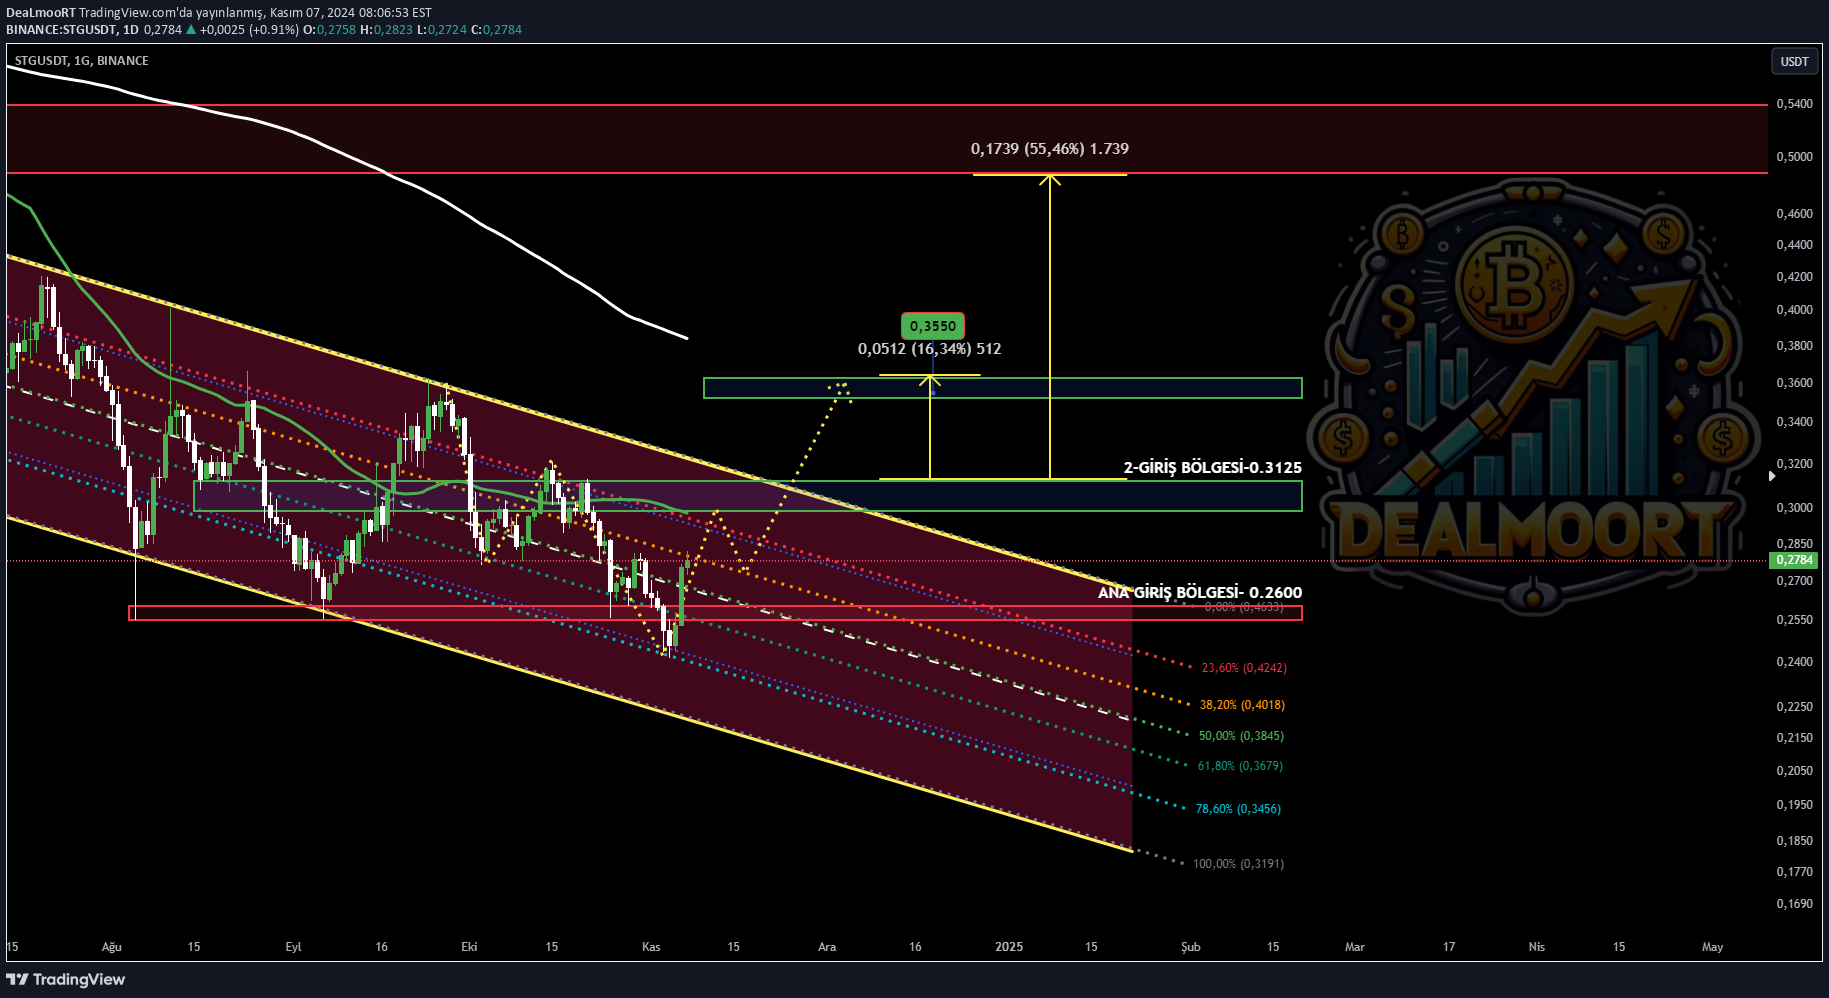
Hello friends, after a long break, we are together again. Today's guest is #STGUSDT. This friend of ours continues to move within a wedge structure and seems to have reacted and started an attack in our TRAIN FIBO 786-618 Region, but it needs to close above the 0.3100-0.32150 Region to start the rise. TARGETS Look Good. I HAVE FOLLOWED AND WILL BE WAITING. I am adding it to give you, our valuable investors, an IDEA.
Disclaimer
Any content and materials included in Sahmeto's website and official communication channels are a compilation of personal opinions and analyses and are not binding. They do not constitute any recommendation for buying, selling, entering or exiting the stock market and cryptocurrency market. Also, all news and analyses included in the website and channels are merely republished information from official and unofficial domestic and foreign sources, and it is obvious that users of the said content are responsible for following up and ensuring the authenticity and accuracy of the materials. Therefore, while disclaiming responsibility, it is declared that the responsibility for any decision-making, action, and potential profit and loss in the capital market and cryptocurrency market lies with the trader.