
Abdihalim1
@t_Abdihalim1

What symbols does the trader recommend buying?
Purchase History
پیام های تریدر
Filter
Abdihalim1
ETHEREUM ELLIOTT WAVE: BULLISH MEGAPHONE BREAKOUT TO $10K?
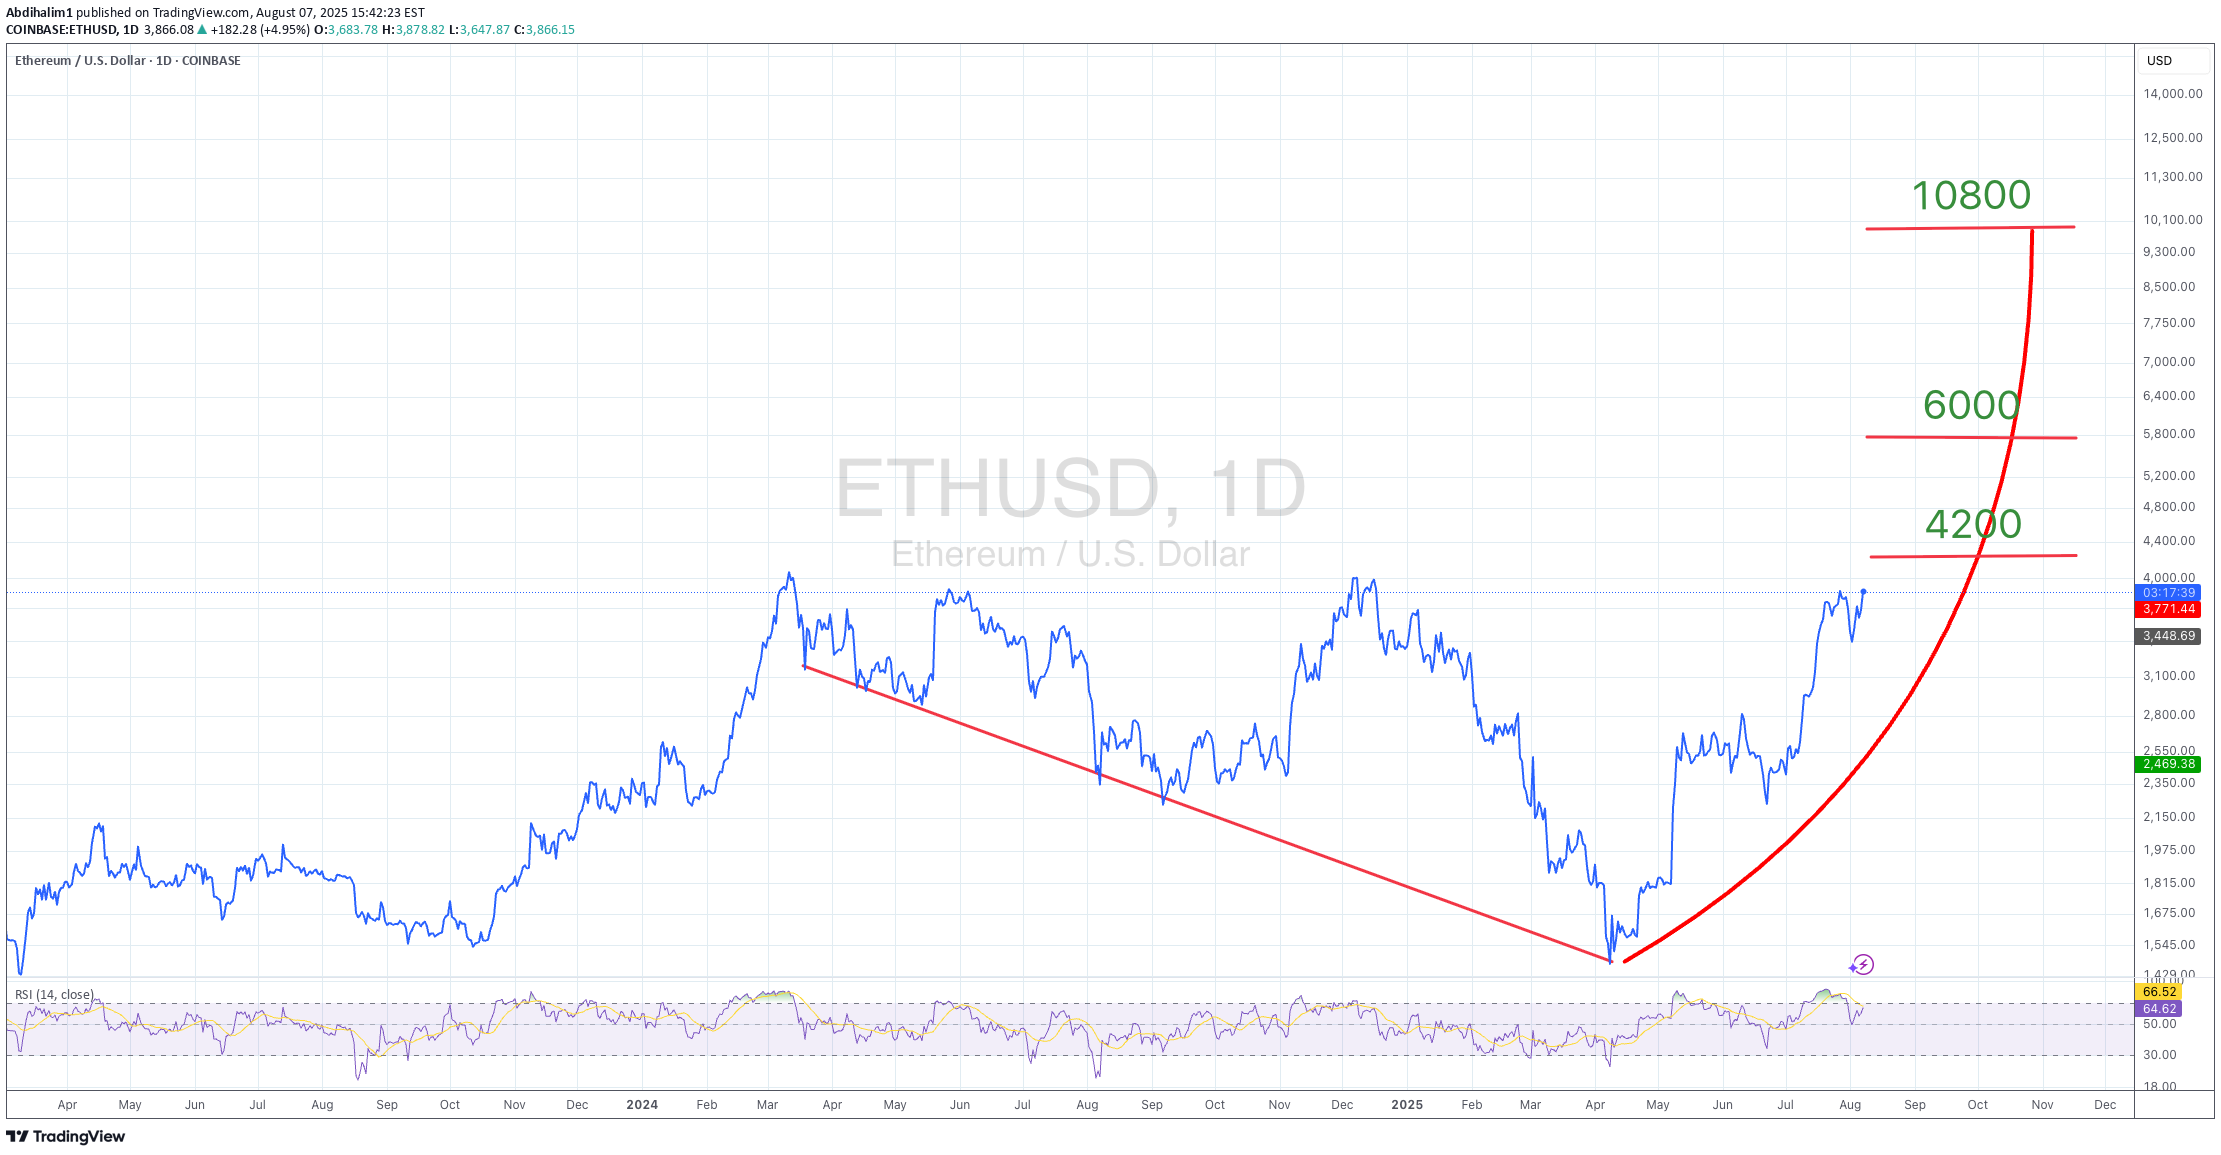
ETHUSD Analysis | Daily Timeframe Current Price: $3,866 Bias: BULLISH 🟢 CONFIRMED Pattern: Elliott Wave 5 + Bullish Megaphone Status: 🔥 MOMENTUM BUILDING 🔥 THE SETUP - BULLISH CONFIRMATION Elliott Wave Count: ✅ Wave 1: Completed at $4,100 (March 2024) ✅ Wave 2: Corrected to $1,600 (August 2024) 🔄 Wave 3: IN PROGRESS → Target $6,000-$6,200 ⏳ Wave 4: Expected pullback to $2,800-$3,200 🎯 Wave 5: ULTIMATE TARGET $10,000+ Bullish Megaphone Pattern: Expanding triangle since June 2022 low Key breakout level: $4,100-$4,200 (APPROACHING) Pattern height: $2,50 Measuring objective: $6,600 🎯 UPDATED PRICE TARGETS T1: $4,700 (+21.6% gain) - 95% probability T2: $5,290 (+36.8% gain) - 95% probability T3: $6,245 (+61.5% gain) - 83.5% probability 🥈 SECONDARY TARGETS T4: $7,200 (+86.2% gain) - 68% probability T5: $8,745 (+126.2% gain) - 53% probability 🏆 MOONSHOT TARGET T6: $10,000+ (+158.7% gain) - 16.8% probability ⚠️ UPDATED RISK MANAGEMENT 🛡️ SUPPORT LEVELS (Bull Market Invalidation) S1: $3,737 (-3.3% from current) - 1st warning S2: $3,648 (-5.6% from current) - 2nd warning S3: $3,546 (-8.3% from current) - 3rd warning S4: $3,356 (-13.2% from current) - MAJOR SUPPORT 🔴 STOP LOSS OPTIONS Conservative: Below $3,356 (-13.2% risk) Aggressive: Below $3,546 (-8.3% risk) Tight: Below $3,737 (-3.3% risk) 🔥 UPDATED ENTRY STRATEGY 🟢 CURRENT ENTRY (RECOMMENDED) Entry: $3,866 (current levels) Stop: $3,356 Risk: -13.2% R:R to T3: 1:4.7 (Excellent!) 🟡 BREAKOUT ENTRY Entry: Above $4,200 (confirmation) Stop: $3,737 Risk: -11.0% R:R to T3: 1:4.4 🔵 PULLBACK ENTRY (If Available ) Entry: $3,450-$3,555 range Stop: $3,356 Risk: -2.7% R:R to T3: 1:18+ (Exceptional!) 🧠 ELLIOTT WAVE PSYCHOLOGY - ACCELERATION PHASE Current Phase: Early Wave 3 🚀 Status: Momentum building toward breakout Psychology: Growing recognition Volume: Should expand on breakout Participation: Institutional interest increasing What's Happening NOW: 📈 Price approaching key resistance 📊 Volume building 🌊 Wave 3 characteristics emerging 💰 Smart money accumulating 🎪 MEGAPHONE PATTERN - BREAKOUT IMMINENT Current Status: 📐 Price at 94% of breakout level 🔊 Volatility expanding as expected ⚡ Breakout catalyst building 🎯 $6,600 target on deck Breakout Levels: Resistance: $4,100-$4,200 (6.1-8.6% away) Volume: Need 2x average on breakout Target: $6,600 minimum (+70.7% gain) 🎲 UPDATED $10K PROBABILITY ANALYSIS 📊 SCENARIO BREAKDOWN (From $3,866) 🟢 Optimistic (40% probability) Gain Required: +158.7% Timeframe: 6-18 months Catalyst: Parabolic Wave 5 + Major news 🟡 Moderate (25% probability) Gain Required: +158.7% Timeframe: 1-2 years Catalyst: Institutional adoption wave 🔴 Conservative (15% probability) Gain Required: +158.7% Timeframe: 2-3 years Catalyst: Extended crypto bull market 📈 WEIGHTED AVERAGE: 24% 🎯 RISK-ADJUSTED: 16.8% 🔍 IMMEDIATE CATALYSTS TO WATCH 🟢 BULLISH MOMENTUM DRIVERS ✅ Price approaching breakout zone ✅ Elliott Wave 3 acceleration ✅ Institutional accumulation ✅ DeFi TVL growth ✅ Layer 2 adoption ⚠️ NEAR-TERM RISKS 🔴 Rejection at $4,100-$4,200 🔴 Bitcoin correlation breakdown 🔴 Macro headwinds 🔴 Profit-taking pressure 📅 UPDATED TIMELINE EXPECTATIONS 📍 Next 2-4 weeks: Test $4,100-$4,200 breakout 📍 Q4 2025: Rally to $6,000-$6,200 (if breakout) 📍 Q1 2026: Potential Wave 4 correction 📍 Q2-Q4 2026: Wave 5 extension → $10,000+ potential 💡 UPDATED TRADING PLAN 🎯 POSITION SIZING (From $3,866) Core Position: 60% at current levels (PRIORITY) Breakout Add: 25% above $4,200 Pullback Add: 15% on any dip to $3,450-$3,555 💰 PROFIT TAKING STRATEGY 20% at $4,700 (lock in +21.6%) 25% at $5,290 (secure +36.8%) 25% at $6,245 (major target +61.5%) 30% HODL for $10K+ (moonshot +158.7%) ⏰ TIME MANAGEMENT Immediate: Watch for $4,200 breakout Short-term: Reassess if below $3,737 Long-term: Major review if below $3,356 🚨 URGENT UPDATE SUMMARY 🔥 WHAT CHANGED: Price up +5.2% to $3,866 (bullish confirmation) Now only 6.1% from key breakout at $4,100 Risk/reward ratios improved significantly Momentum building toward critical resistance ⚡ IMMEDIATE ACTION: BUY SIGNAL ACTIVE at current levels Stop loss: $3,356 (-13.2% risk) First target: $4,700 (+21.6% gain) R:R = 1:4.7 (Excellent setup!) 🎯 KEY LEVEL TO WATCH: $4,100-$4,200 = Make or break zone Break above = Explosive move to $6,600+ Rejection = Pullback to $3,450-$3,555 🔮 BOTTOM LINE - UPDATED The Setup: Even stronger! Price action confirming Elliott Wave count with momentum building toward the critical $4,100-$4,200 breakout zone. The Opportunity: Now at $3,866, we're positioned perfectly for the next leg up. Risk/reward of 1:4.7 to major target is exceptional. The Risk: Manageable at -13.2% to major support at $3,356. The Play: BUY NOW - This is the sweet spot before the breakout. Scale in aggressively at current levels. 📊 UPDATED CHART FOCUS 🎯 CURRENT PRICE: $3,866 (+5.2% momentum) 📈 IMMEDIATE TARGET: $4,200 breakout (+8.6%) 🚀 HIGH PROBABILITY: $6,245 (+61.5%) 🌙 MOONSHOT: $10,000+ (+158.7%) 🛡️ STOP LOSS: $3,356 (-13.2%) ⚡ PATTERN: Bullish Megaphone + Elliott Wave 3 🚨 TRADE ALERT: BUY SIGNAL ACTIVE 🚨 Entry: $3,866 (NOW) Stop: $3,356 Target 1: $4,700 Target 2: $6,245 Moonshot: $10,000+ ⚠️ DISCLAIMER: This analysis is for educational purposes only. Cryptocurrency trading involves substantial risk. Always do your own research and never risk more than you can afford to lose.ACTIVATED: 4470
Abdihalim1
$Atom is crashing to $2.

Buyers, be prepared to purchase the coin below $2.2. Good luck, holders. I’m not sure what’s happening with this coin, but its holders are in for a tough time.
Abdihalim1
$Bounce Token to $4

If you’re interested in this coin, I strongly advise you to wait until it drops below $5. This coin is dropping rapidly.
Abdihalim1
$PLU Potential Gem

Price Structure & Key Targets: Current consolidation near historical support levels Key resistance levels identified at $2.60, $4.30, and $7.00 Low market cap suggests potential for increased volatility Technical Considerations: RSI showing oversold conditions below 30 Low trading volume may amplify price movements Historical price data suggests strong reactions from current levels Risk Factors: Significant technical damage from recent downtrend Limited liquidity could affect entry/exit execution High volatility expected in either direction Trade Setup: Primary resistance: $2.60 Secondary target: $4.30 Extended target: $7.00 Suggested stop loss: $1.00
Abdihalim1
ALGO/USD Bullish Reversal Setup

ALGO/USD is showing signs of a potential bullish reversal after recently touching the lower Bollinger Band on the 4H timeframe. The price has started to rebound, and a move toward the 38-cent resistance level is likely if bullish momentum continues. Technical Signals: Bollinger Band Rebound: The price has crossed back above the lower Bollinger Band, indicating potential support and a reversal. RSI Neutral Zone: RSI is currently at 40, which leaves room for upward momentum without being overbought. Short-Term Trend: The price shows signs of consolidation and recovery, aiming for the middle Bollinger Band as the next target before testing 38 cents. Target Levels: Immediate Resistance: $0.35 (middle Bollinger Band) Primary Target: $0.38 Stop-Loss Suggestion: Set a stop-loss near $0.32 to minimize downside risk.trade is on, reached 0.38. primary target is reached
Abdihalim1
Bitcoin's Path: $70K Correction Imminent

Alright, let's use the historical data on that BTC/USD weekly chart as a foundation for my forecast. After seeing the way Bitcoin has moved in the past, I want to use that data to make some educated guesses on what might happen next. Key Points from Our Historical Analysis Here are the key points I'm using for my forecast: Large Bull Cycles: Bitcoin has shown the ability to make huge moves upwards, with gains reaching 500% or more. I will be mindful of this upside potential as a key point of my plan. Significant Corrections: Every major bull run has always been followed by a major correction, often with drawdowns of 50%, or even 80%. I understand that these corrections are not random, they are part of the natural price action of BTC. Recent Move: The recent move to 100k was a major sign of bullish activity. My Bitcoin Forecast: Based on these historical patterns and my understanding of market dynamics, here's my outlook for the next major move for Bitcoin: Anticipated Correction: Given the recent strong move, and the fact that we are entering the $100k psychological price point, I anticipate a significant pullback from current levels. I want to see a test of the $80k range, and possibly even the $60k range. Estimated Drawdown: Based on prior drawdowns, I expect to see a retracement of at least 30%-50% from the recent high (100k), which can bring the price down to a range between $50,000 and $70,000. Next Bullish Upside: After this retracement, I anticipate another bull phase. The percentage gained on these next phases may be less than the previous, but there is still potential for a massive move. I will be looking for confirmation of a reversal in trend before I jump back into a trade. Potential Upside Target: If this retracement does not go below the 60k mark, and then moves upwards, I would then start to target $150,000 as a mid term target. My Strategy for the Coming Months: Patience: I will be patient, and I will not chase the price upwards. I will wait for the market to confirm a clear trend before placing any new trades. Risk Management: I will be using a stop loss at all times, to manage my risk during these periods of high volatility. Confirmation: I will wait for the technical indicators and price action to confirm any upside moves. Important Notes: Not Exact Science: This is a forecast and not an exact science. No one can predict the future. This is simply an estimate using technical analysis to show the most probable outcome. External Factors: Other factors not shown in the chart, such as news events and market sentiment may have an impact to prices.
Abdihalim1
Ethereum is going to 2000 then new ATH

Alright, let's talk about what I see coming for Ethereum. I’ve been deep-diving into these charts, especially that weekly one where I’ve highlighted the past moves and percentages. I'm using these patterns as a guide to try and anticipate where Ethereum is heading next. I'm going to set aside any kind of trading advice, and focus on what I see the market doing next. Key Observations From Past Cycles Looking at Ethereum's history, I’m seeing a pretty clear cycle of large price swings: Massive Rallies: Ethereum has a history of powerful bull runs, where the price can surge by hundreds, or even thousands of percent. I need to be aware of these to understand the potential of the coin. Substantial Corrections: These rallies are always followed by substantial corrections, which range from about 30%, to upwards of 80%. This is important to see as any retracement can be devastating to a trader. My Prediction For The Next Move: Based on those historical patterns, here’s what I see as the most probable outcome for Ethereum's next move: Anticipated Retracement: I’m expecting a retracement, or a pullback following the recent gains. Ethereum tends to make large retracements after a period of growth, and I am anticipating this will happen again soon. I want to see the price find a solid level of support, as this will be important to the next move up. Based on historical price action, I expect the next support levels to be somewhere around $2000 to $2500. The Next Upside Move: After that pullback, I anticipate a strong upside move. The magnitude of this move is unclear, but the data on the chart shows we could be looking at a move upwards of 100%, and maybe even more. I want to be watching that very carefully when it happens.ETH ON IT IS WAY TO ATH
Abdihalim1
My Analysis and Plan for XYO/USD

Alright, let's dive into what I’m seeing on this XYO/USD daily chart. I've had a look, and here’s my perspective on this coin. Technical Analysis: Significant Pump and Dump: The most obvious thing on the chart is the large pump and dump that happened in November and early December. I am seeing that the price went up very quickly, and then went down very quickly too. This leaves a lot of traders unsure about what to do. Recent Rejection: Since the big dump, the price has consistently been rejected from the $0.023 area. Every time the price tries to move up, it can't seem to break through that level, which indicates there is a lot of selling pressure at that price level. Support Zone at $0.018: The price is showing a potential support level in the area of $0.018, which gives me a potential for a lower risk entry point if that support continues to hold. RSI Near Neutral: I'm seeing the RSI is near 50, which shows no real bullish or bearish momentum. This means a move can happen either way. My Action Plan: Based on what I’m seeing on the chart, here's my plan: Entry: Primary Buy Zone: I am going to be watching the $0.018 area closely for a potential entry. If the price bounces from this area, and I see strong bullish candles, I will likely place my entry order around $0.018 Alternative Zone: I will also be watching for a strong move through the $0.023 area. I will consider placing a trade after a successful move through this level. Stop-Loss: Tight Stop: My stop-loss will be placed below $0.017. I don’t want to risk a larger loss if the price fails to find support at the $0.018 zone. Take-Profit Targets: Short-Term Target: My initial profit target is around the $0.023 level. I will evaluate the price action to see if it will move higher. Mid-Term Target: My mid term target is going to be around $0.038 - $0.04. This is a key area of resistance in the chart, so it makes sense to target that area. My Overall Strategy: I'm currently observing the $0.018 support level for a potential entry, I will want to see a clear bounce off this zone to confirm the trend. I will be setting a stop-loss below $0.017 for risk management. I will also look to enter a position after a move through the $0.023 resistance with clear bullish momentum. I am setting a short-term profit target at $0.023 and a mid-term target at $0.038-0.04. That’s my plan – focusing on the key price action and being adaptable depending on what the market is doing.exactly as i predicted, xyo pumped and touched .023 cent
Abdihalim1
My Plan for CVC/USD: A Bullish Outlook with Strategic Entry

Alright, let me lay out my plan for CVC/USD. I've been watching this chart closely, and I firmly believe we’re going to see a significant upward move in the coming months. My goal is to position myself to capitalize on this opportunity while managing risk effectively. My Bullish Thesis: I'm convinced that CVC/USD is poised for a major breakout. I'm targeting a move to 40 cents within the next three months, maybe longer. I am bullish, and that conviction is based on what I’m seeing on the charts. I see a coin that has been accumulating over time, that has tested the resistance to the upside and is now moving down to test the support again. These factors tell me that it is ready to make a larger move up. Technical Analysis Support: The charts show a clear period of consolidation, with the price moving sideways for a prolonged period of time. This suggests there's a big move coming, and that’s what I'm watching for. The price action also shows that the recent attempt to break out to the upside was not sustainable, but it provides me with confidence for a similar move to the upside in the future, and a move back down to the support zone is a healthy move for future growth. It also shows me that $0.40 - $0.42 is a key resistance area where I should consider taking profits. Entry Strategy: I'm focusing on the lower end of the price range for my buys. My target buy zone is below 14 cents. That's where I will be placing my buy orders, to load up for a big move. This is where I am most comfortable buying, as it provides a good balance of risk and potential reward. Risk Management: I'm a big believer in risk management, and that is not lost in this trade. Therefore, I'm setting a stop-loss below the $0.08 level. While I’m confident in a move upwards, it's a non-negotiable rule that I follow when trading to avoid large losses. I must have a stop loss to allow me to sleep easy at night. Take-Profit Targets: I'm planning to lock in gains above 30 cents. This is my initial profit area that will provide good reward given my limited risk. Then, I'm targeting the 40 cent - 42 cent range, as that is a level where I expect the price to find some resistance. I will be watching this level closely to confirm if it should be broken to make the decision of holding for higher targets. My Overall Strategy: I am going to load up on CVC/USD below the 14 cent range. I will be setting a stop-loss below 8 cents to avoid large losses. I’m going to be watching for a move up past the 30 cent mark to take profits, and I’m going to watch the action around the 40-42 cent mark, before potentially setting new targets for further growth. My analysis tells me this is going to be a big move and a big opportunity, and that is why I am loading up on CVC/USD in the lower ranges. I am patient and prepared to hold to achieve my goals, while also protecting my capital.ENTRY POINT IS REACHED, GOOD LUCK.
Abdihalim1
My Action Plan: AVA/USD - Entry at 85 Cents

Alright, let's get straight to the point. My focus is now on buying AVA/USD around the 85-cent level. This is the ideal entry I'm targeting. Entry: Primary Buy Zone: My preferred entry is right at the 85-cent level. Based on the chart and the prior action, I see this as the optimal area for a long position, and where I will be placing my buy orders. Stop-Loss: Tight Stop: I'm placing my stop-loss at $0.75. This is below the $0.8 level which was the base of my previous stop loss, which will provide some breathing room. I want to avoid a large loss if the price decides to move against me. Take-Profit Targets: First Target: My initial profit target is $1.50. Second Target: Following that, I will be aiming for $3.00. Long-Term: If $3.00 is broken, then I'll be targeting higher prices. In Summary: My plan is simple: I'm setting my buy order for AVA/USD at 85 cents. My stop-loss is set at $0.75. I'm targeting take profits at $1.50 then $3.00, with a plan to go higher on a sustained move. That's my entry, stop, and profit plan – locked and loaded.TRADE IS ON
Disclaimer
Any content and materials included in Sahmeto's website and official communication channels are a compilation of personal opinions and analyses and are not binding. They do not constitute any recommendation for buying, selling, entering or exiting the stock market and cryptocurrency market. Also, all news and analyses included in the website and channels are merely republished information from official and unofficial domestic and foreign sources, and it is obvious that users of the said content are responsible for following up and ensuring the authenticity and accuracy of the materials. Therefore, while disclaiming responsibility, it is declared that the responsibility for any decision-making, action, and potential profit and loss in the capital market and cryptocurrency market lies with the trader.