
DeaLmooRT
@t_DeaLmooRT

What symbols does the trader recommend buying?
Purchase History
پیام های تریدر
Filter
DeaLmooRT
$Bitcoin Destek Bulmayı Başardı !
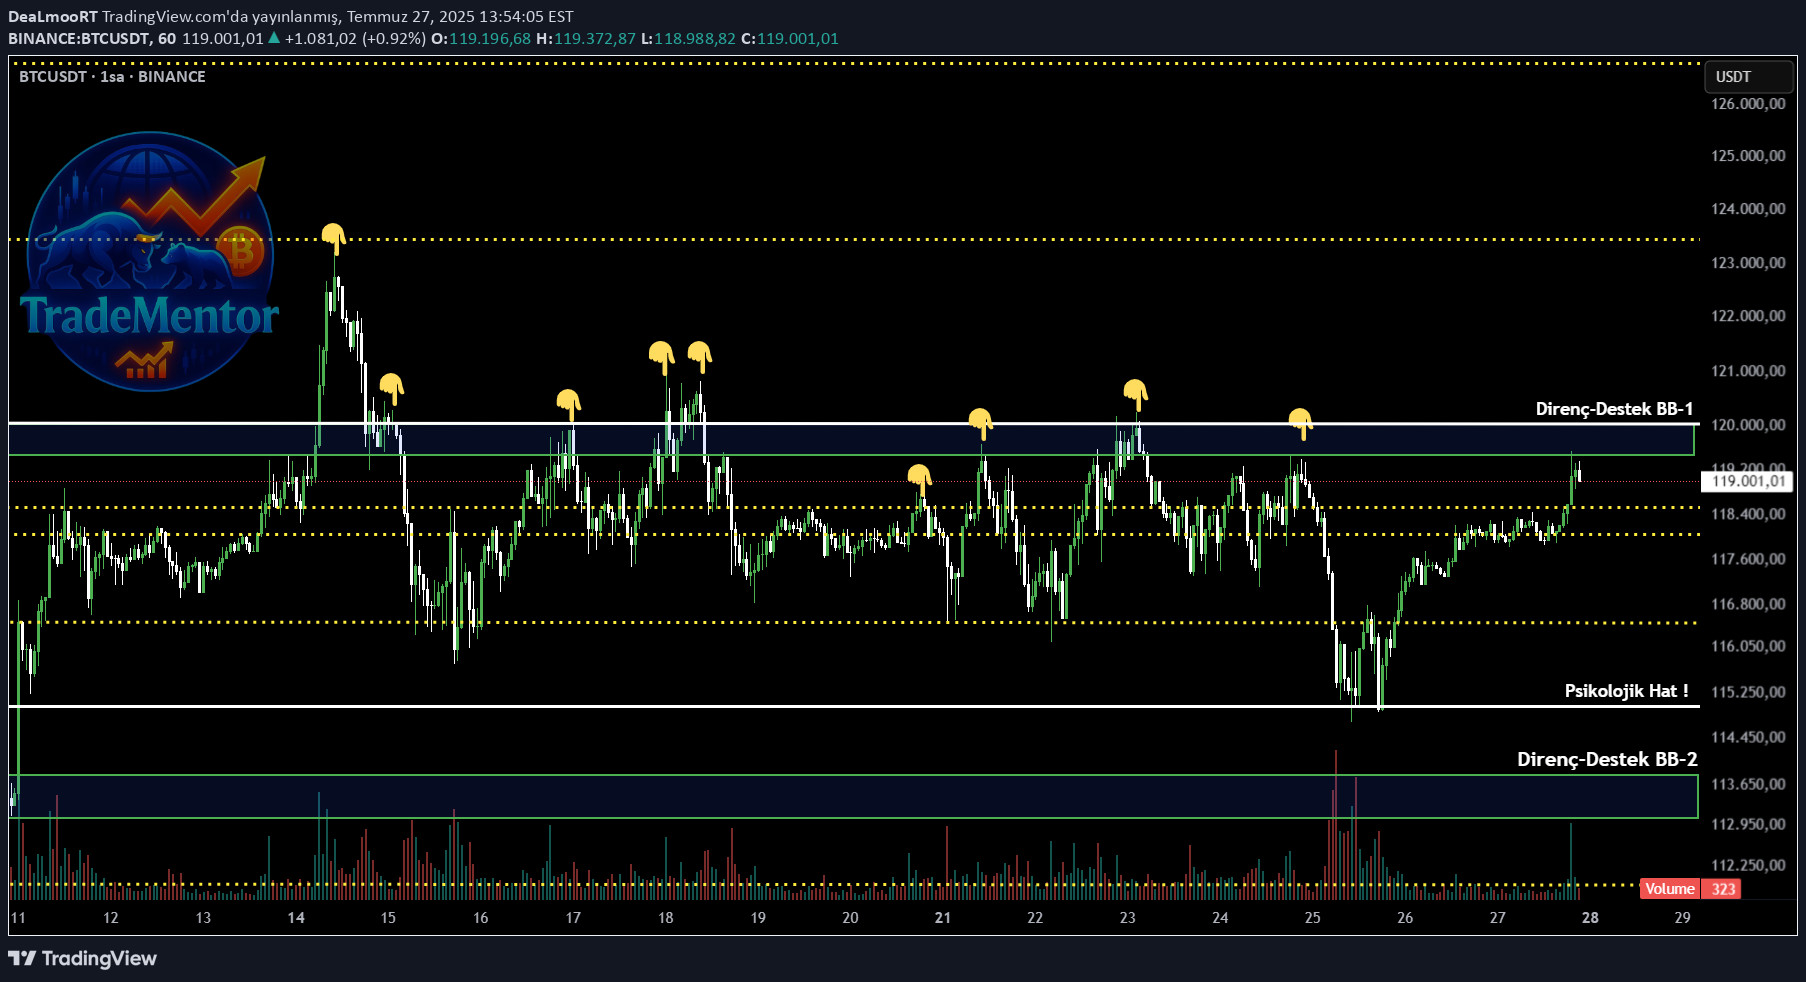
Mutlu, pleasant weekends friends; #Pitcoin for 4 hours of follow -up, the structure continues and now gets the first reaction and retreat as if it is up to 120,500 levels to get up to the level of 4 hours to get up. 15 minutes and 1 S Our technical analysis in the short period of time gave results, according to this short analysis, we were involved in short trafficking and snow rez. I have done, this is because the main resistance line is a strong printing zone, which we call 119.500-120.500 dollars in the region that needs to be considered in the region. 🚨 Continue to further!
DeaLmooRT
#Bitcoin geri çekilmeye devam ediyor !
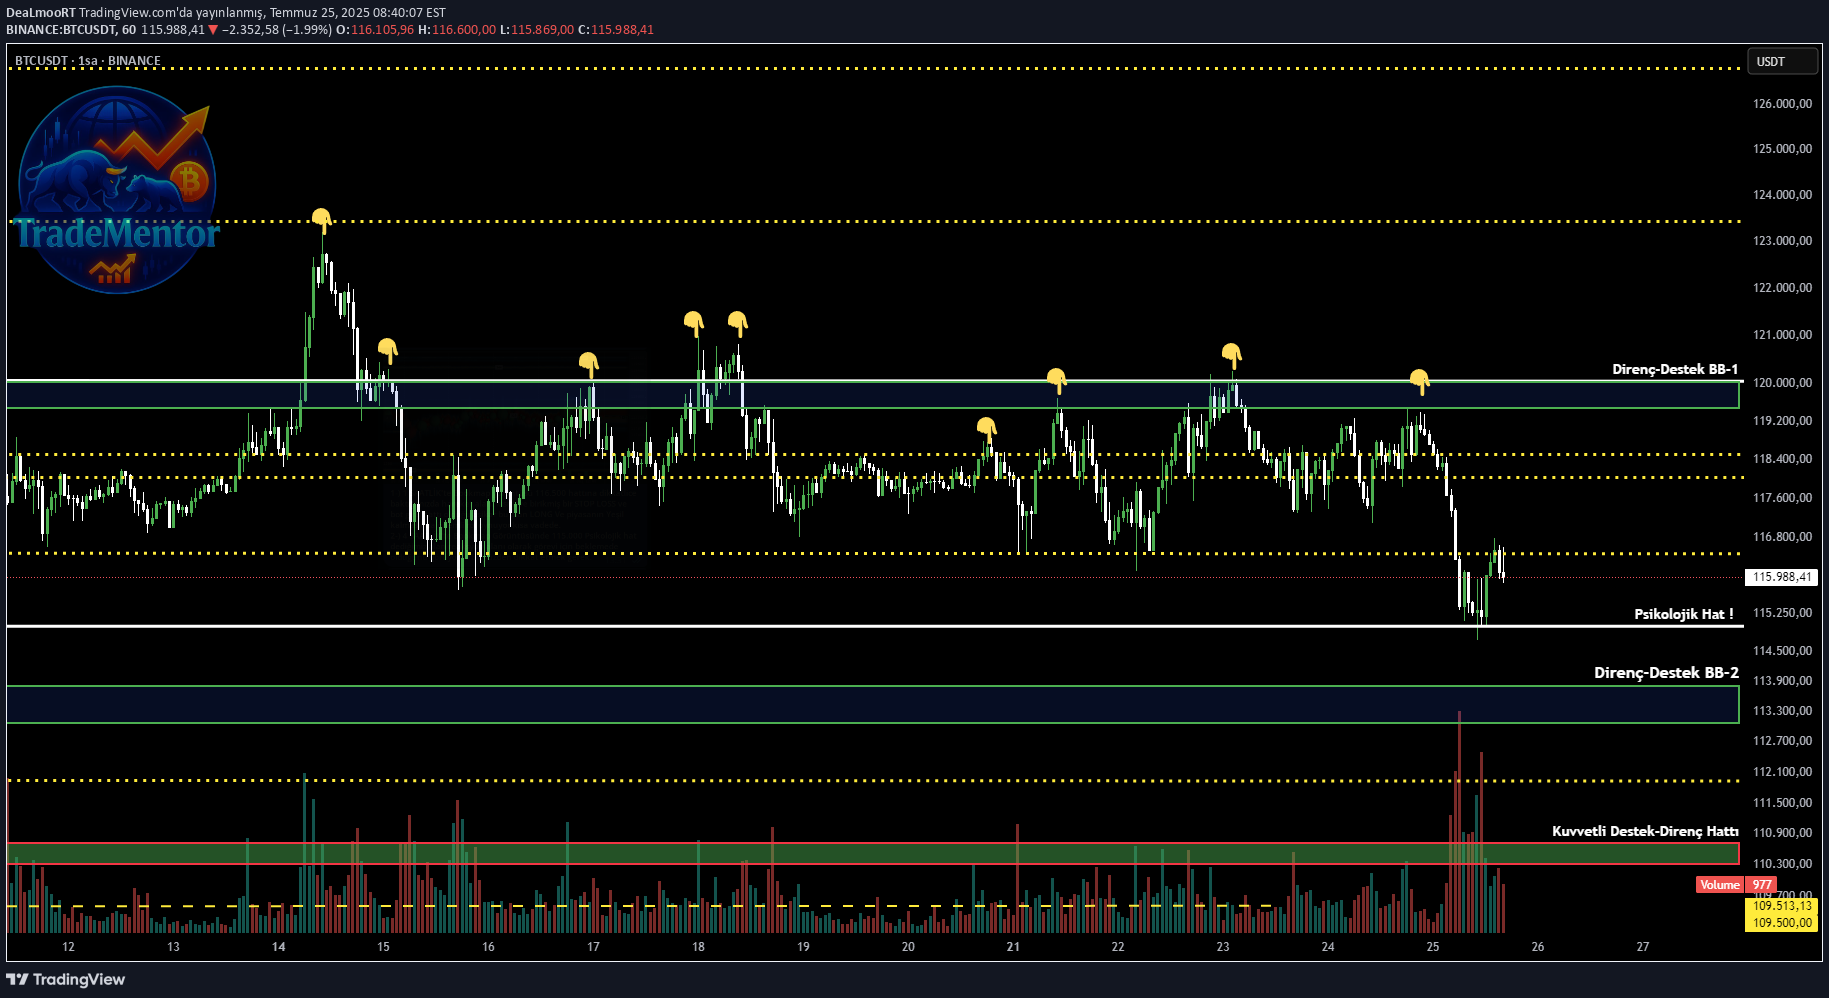
Hi friends, be blessed on Friday. I wish you all a fertile and profitable week. Today we are together again because the process works as planned. #Pitcoin continues to retreat. Since July 16, the price has been stuck in the horizontal band and offered us good trade opportunities. There have been clear opportunities for everyone who remained patient in this 10 -day time period, who took the analysis into consideration and did not break the plan. I often inform you about the important resistance and support lines in our X address and main group. Let's start our analysis with the technical table. 🔹 120,000 - 119,000 dollars of the region caused volume outlets with harsh sales and the line has a strong resistance wall in each of our analysis. The current price is around 116,500 dollars. This shows us that the market shows that it is in search of a new direction under this pressure. If it does not provide permanence over $ 116,500, 115,000 USD psychological line is tested again, followed by 114,000 - 113,000 dollars intermediate zone and ultimately 110,500 USD main support line can be activated. Here you need to pay attention to the determination of breakage and direction. These levels have frequently emphasized in our previous analysis of satin, and now it is going on one by one. While the volume -supported sales pressure to be done here is continuing, patience and planned transactions are once again important. It is important to determine the strategy with placity entry, risk management, not to FOMO, not to move with plan and breakage. 📌 Follow us for more detail and instant analysis. 🔁 Don't forget to share and support. Orum I am waiting for your thoughts in my days. 🤝 It motivates us to see your festivities. 🟡 Do not come: This content is not an investment advice. Due to the relevant regulations of the CMB, it is only technical analysis and personal interpretation.
DeaLmooRT
#ETHUSDT Yükseliş Trend'i için Hazır mı ?
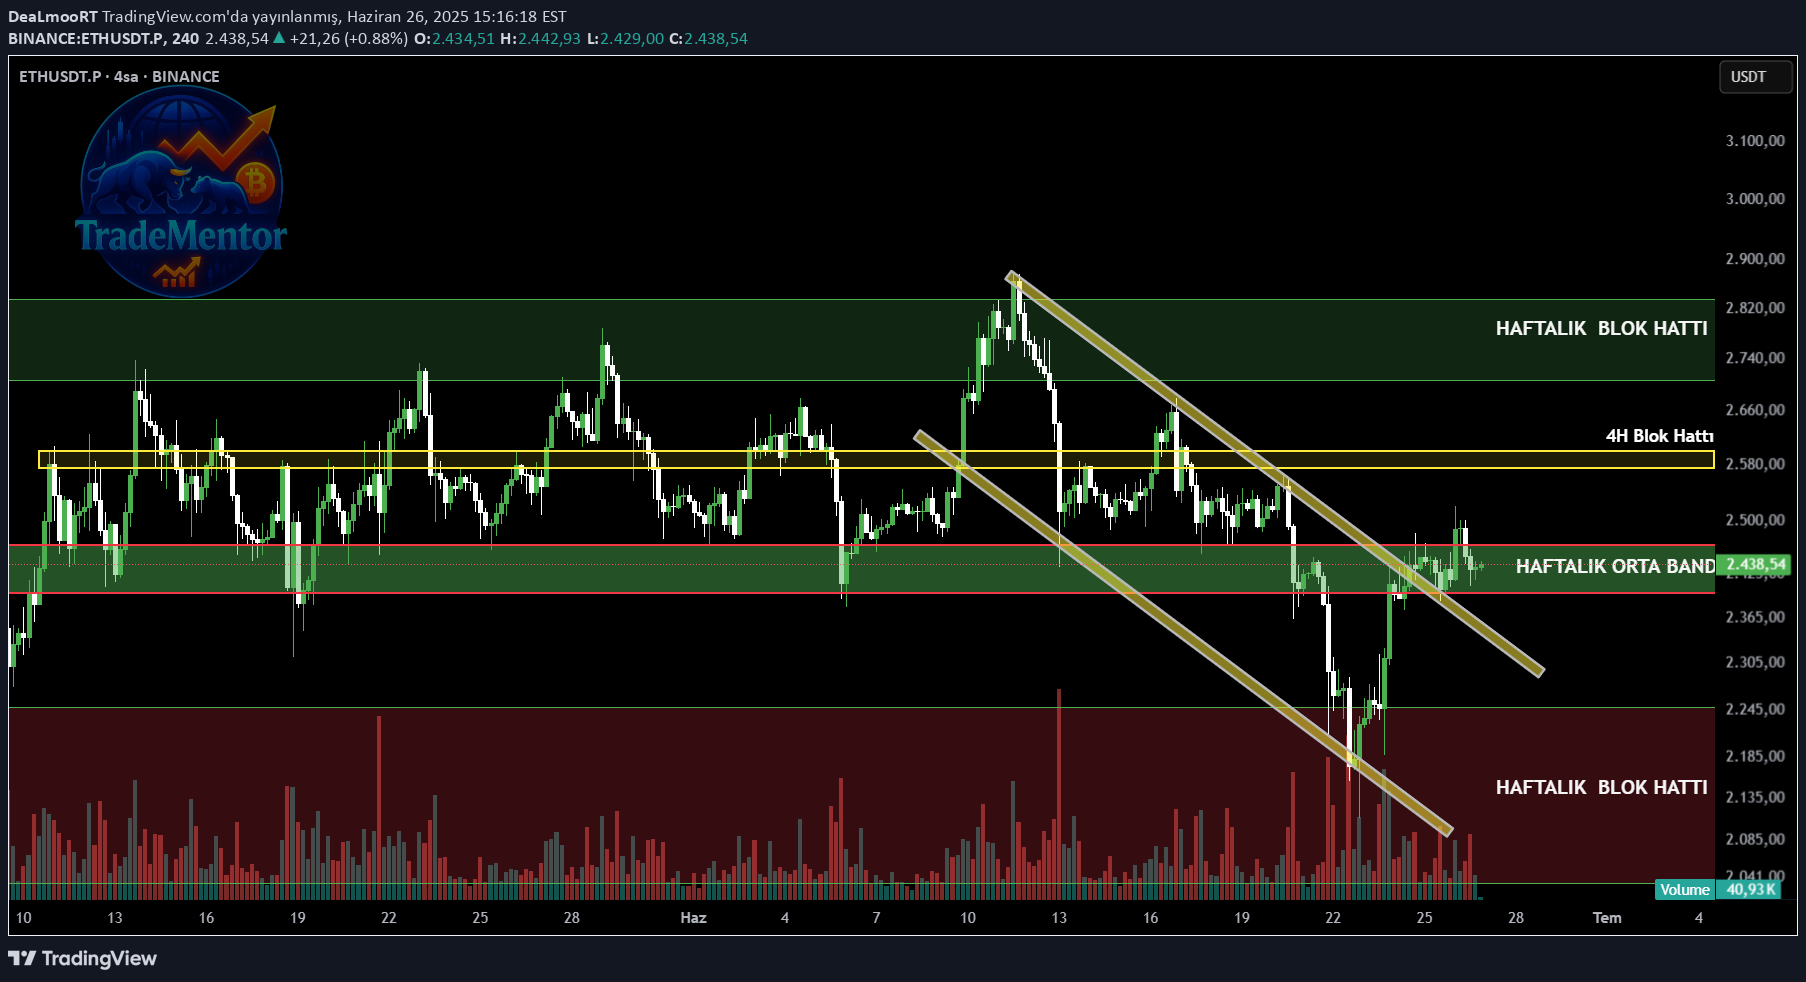
Greetings Friends #Kriptopara market in these days when uncertainties are intensified, the direction is more critical to read correctly than ever. In today's technical analysis, our focus will be #ethusdt parity. This strategic graphics, trend rotation signals and blok regional movements that we have created in the 4 -hour time period draw attention. Let's evaluate these important levels together and examine the possible scenarios from a strategic perspective. While the price continues its downward movement in this channel, it has recently shown some attempt to recover by contacting the upper band of the channel. Critical strategic regions are available .✅ Weekly middle Band (around 2.435): This region, where the price is currently competing, can work in favor of buyers in the short term if upward. However, the downward pressure may increase if sales are active again. This may also be a potential long entrance zone, but confirmation is essential. In the past, the price has been eaten repeatedly. If the price exceeds this level in a volume, the next target may be the weekly Blok line (over 2.740). The price reacted up after contacting this region. This region may be a strong purchase zone again in possible withdrawals. If we look at the idea of the scenario, 🔴 Short Scenario: If the price cannot be held in the 2,435 zone, the weekly blok line below can be tested again. Momentum and ADX Still in favor of sellers. In case of breaking this level, a stronger trend return can begin.📢 Warning: This content is not an investment advice. In accordance with the relevant regulations of the CMB, you need to evaluate your purchase-sale decisions in accordance with your risk profile.
DeaLmooRT
#SOLUSDT Teknik Analiz ile Mükemmel uyumu !
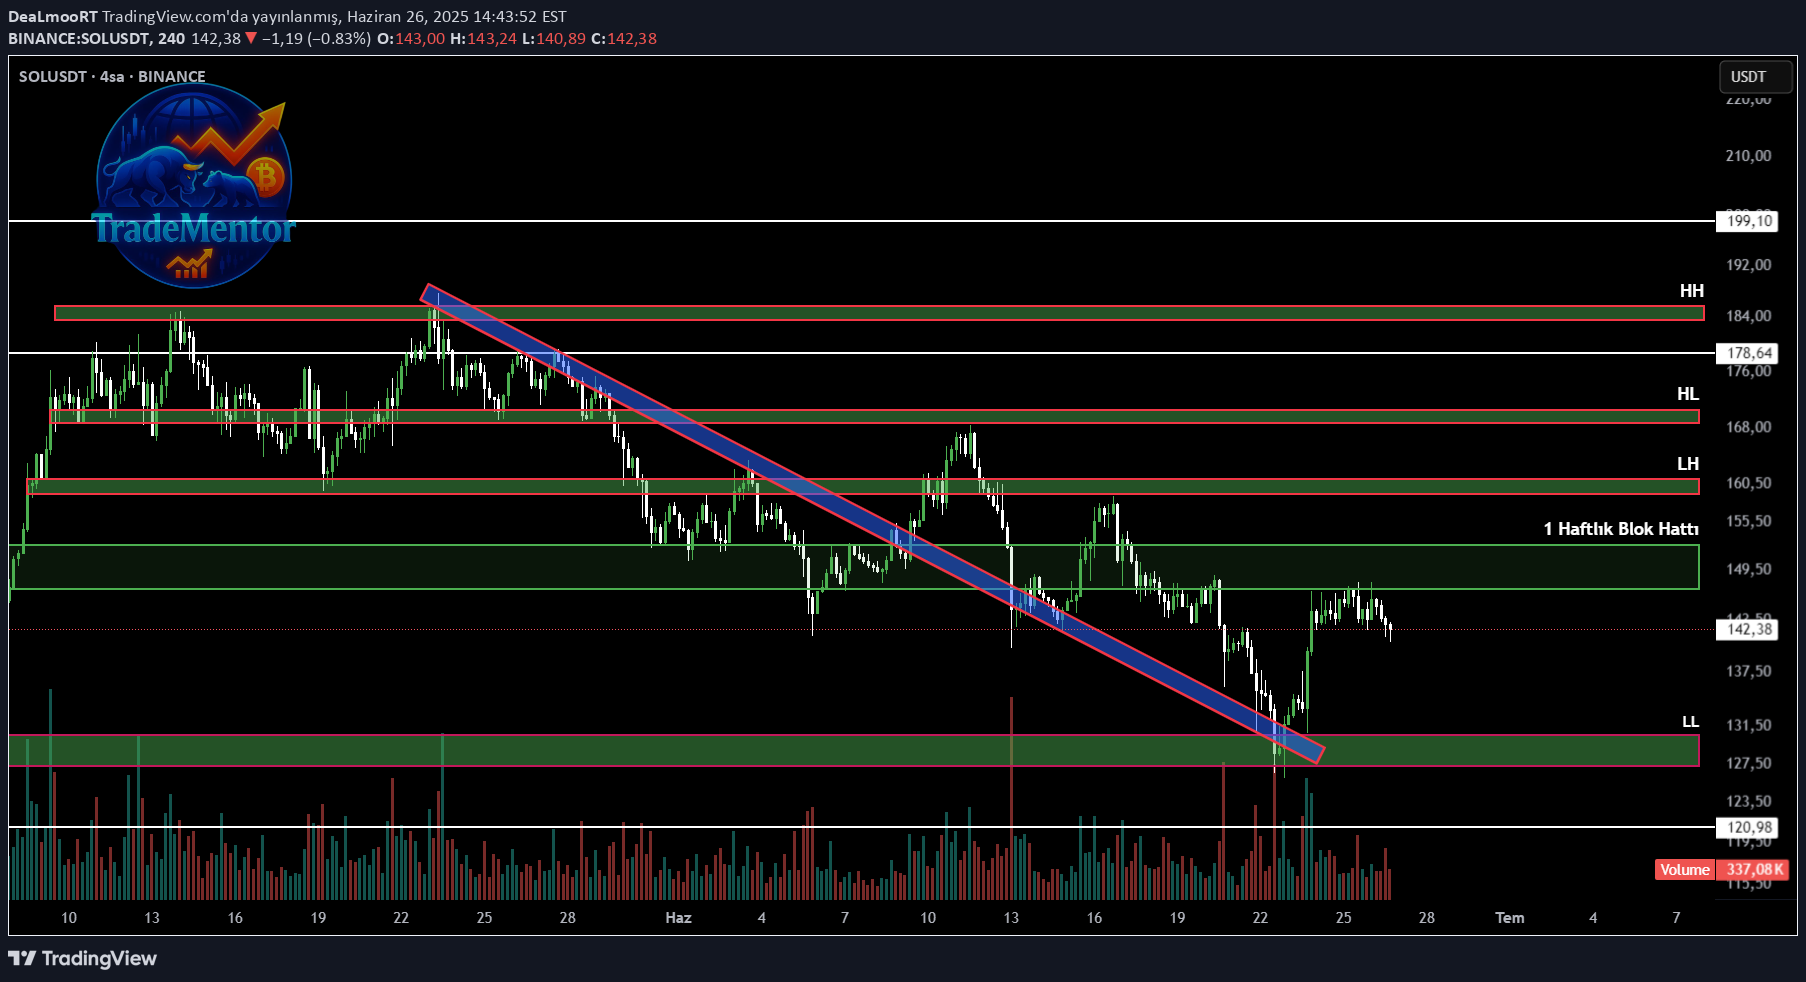
Hi friends in our today's analysis, #kriptoanaliz #solusdt 4 -hour time period from a technical perspective we consider in detail. This strategy, which is created through the graph, gives important messages especially in terms of trend tracking, resistance-description levels and price blocks. Now, let's look at this table together. If we look at the general technical look, the graph is a significant falling trend line with the blue area. This trend clearly shows that the price remains in sales edition by constantly creating lower peaks and lower bottoms (LL - LH). However, this falling channel has given a signal of changing momentum change by breaking up in the recent past. He worked as a strong supply zone. At the moment, the price has tested this level and has received downward reaction. It is difficult to expect a permanent breakage upward breakage unless this region is passed again. This place can also offer a potential Short opportunity.✅ 142.03 level: The instant price is released around this support. If this area cannot hold, the likelihood of withdrawal to the support area of 127.50, which is re -LL (LOWER LOW), is 131,50 and below. Therefore, price behavior at this level should be carefully monitored.✅ LL and HH zones: The LL (131,50) level in the graph is one of the last castles where sales may increase. If the closing comes under, the decrease scenarios up to 120,00 can be strengthened. On the other hand, HH (184,00 and above) is the main resistance zone. In order for the price to approach here, 149.50 must be passed in a clean way. RSI and momentum are also weak, so 131,50 and six can be tested. This break is the first sign of the upward trend change. The graph gives very clear messages for both short -term scalpists and medium -term position investors. Together with the signals of change of the trend, there are two -way opportunities according to the behavior of the price. Risk management and proceeding with confirmed signals are of great importance in this process.📢 Warning: This content is not an investment advice. In accordance with the relevant regulations of the CMB, you need to evaluate your purchase and sale decisions in accordance with your risk profile.
DeaLmooRT
#Bitcoin Geri çekilme sonrası Yükselişe geçti
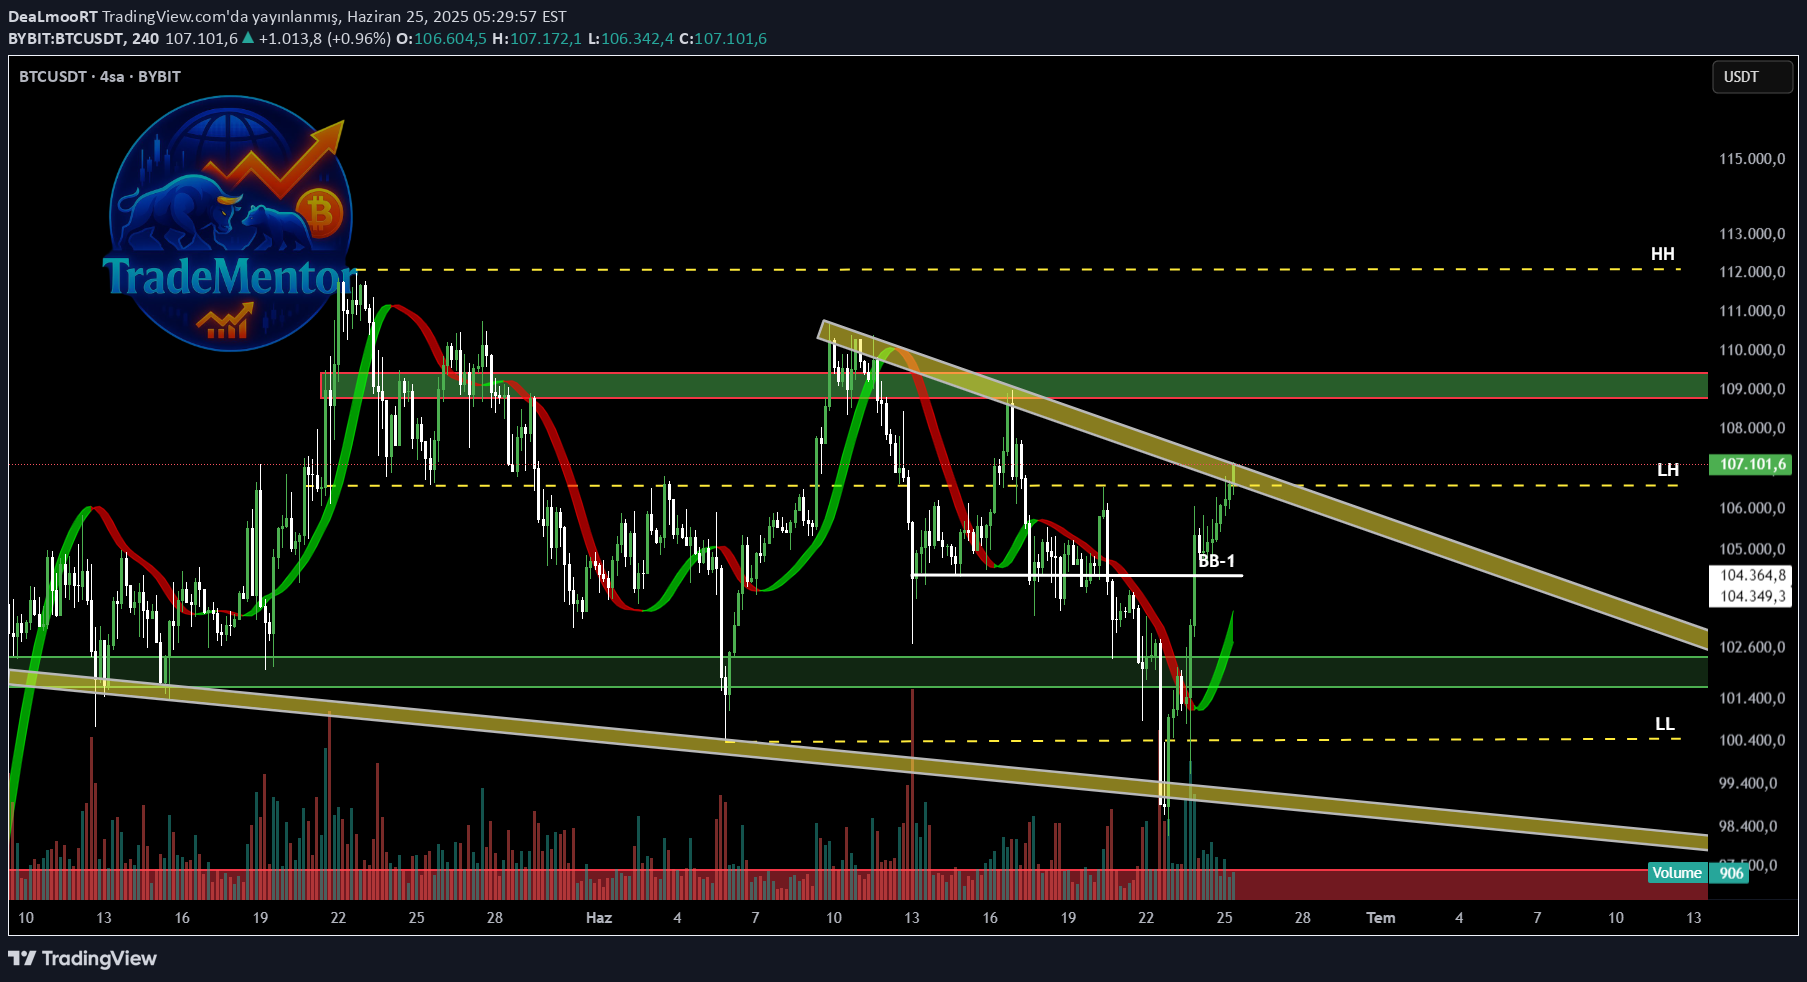
Strategic perspective with #bitcoin 'e @Tadementorr 📆 Dates are showing June 25 with you again. In our previous technical analysis on #bitcoin (#BTCUSDT), we have drawn attention to 106,500 - 109,500 band and emphasized that this region could be both a strong resistance and a potential Lower High (LH) region. The descending wedge formation formed in the continuation of the technical structure shows that the last phase of the jam has been approached, while volume analyzes give important signals about pre -breakdown mobility. This level continues to be a technically important return area. We have examined the formations by supporting them with volume analysis and trend lines. And as a result; The direction, which we predicted correctly, has become apparent with the professional strategy. As Tredementorr, our aim is not only to read graphics, but to give the investor to the investor by providing the right information at the right time. Strategy, patience and discipline do not lose the direction.⚖️ Information, comments and evaluations contained here are not within the scope of investment consultancy. This content is only for general information purposes. Each investment decision should be shaped according to the investor's own risk and return preference. The person who prepares the contents cannot be held responsible for the damages that may arise. #Crypto #altcoin #kriptopara #Formation of Formation #Alsatstratej #Trademnert
DeaLmooRT
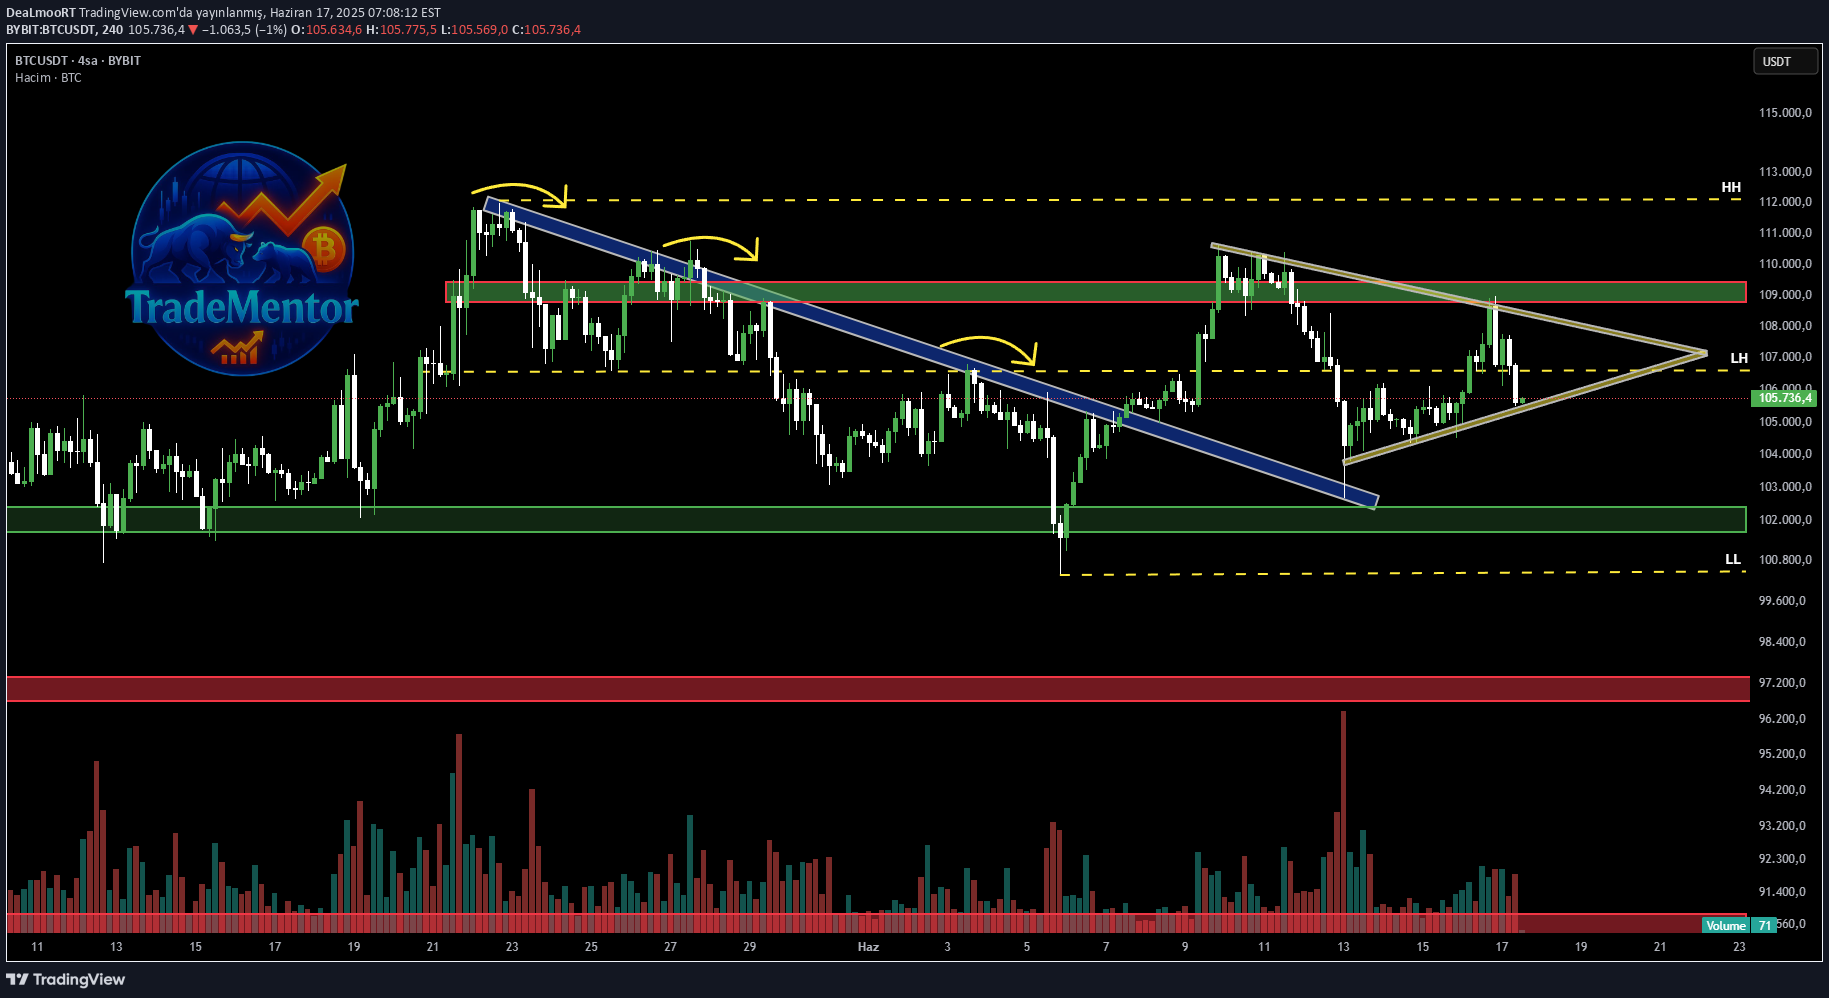
#Bitcoin Yön tayini etmeye devam ediyor !
Hi friends, I wish everyone a nice weekend, I tried to inform my esteemed investor friends with a comprehensive video and article on June 17, I hope that the friends who take into account the video and the article have understood me and the market thoroughly. Today, I wanted to pass and inform the detailed regions of 4H for you. Both in our previous analysis and in the current graph, this region stands like a “barricade ğı in which non -voluminous breakdown initiatives fail. The volume of this level is a must for the structure to return to the rise trend.102.000 - 102,500 dollars This region has recently become the main support area where the liquidity collection and returns took place. And confidence for the market is renewing this confidence should support in volumes.📉 Falling peak formation & graphic graph shows the shoulder -like local structures like yellow curves show that sales pressure continues. Every reaction rise remains weaker than the previous one. This shows the potentially weakening receiver power. 102,000 - 102,500 dollars: If the last castle is broken, the price may hang below $ 99,000, the LL - LOWER LOW zone. The 97,500 blok line, which we expect and has market expectations, is activated. And as we emphasized in our analysis dated June 8, which is more than 2 ci articles, it would be technically wrong to give up as a result of breaking 106.500. Reactions provide risk management for the future.🔒 Strategy and patience are the basis of investment.
DeaLmooRT
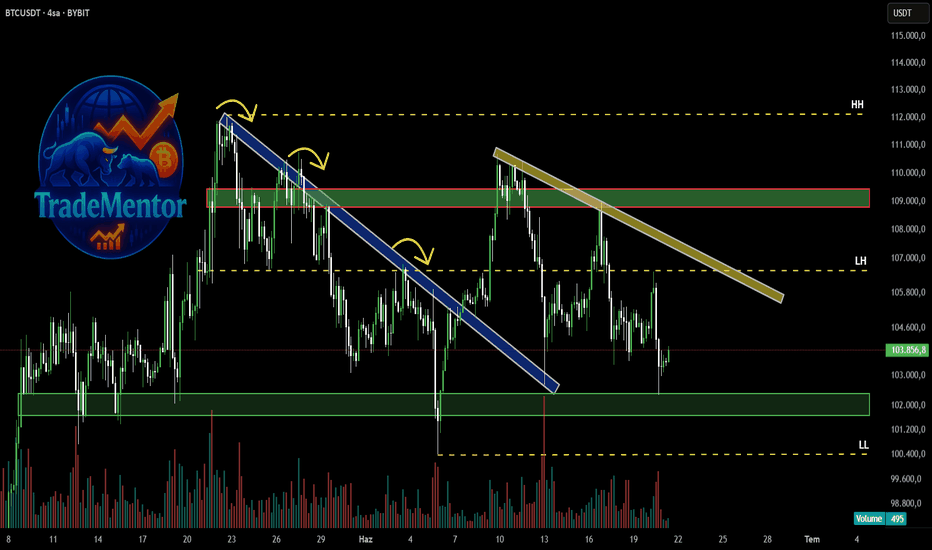
#BTCUSDT 4 H Yön belirleme aşamasında !
I wish everyone plenty of profitable days, we have entered a new week with technical analysis and market analysis again. For you, we will start with a detailed, stages and current understandable analysis; It coincides with the upper limit of the symmetrical triangle.HH (Higher High) level - 112.000 USDT: Major level that can be targeted if the formation is broken up. The structure has a falling trend channel (blue line) that has been effective in the past. With the upward breaking of this channel, the recovery process of the BTC started. However, this output was not strong enough and the price was stuck in the triangle again. Every unsuccessful hill movement shown by the arrows confirms short -term sales pressure. For this reason, the refraction direction of the formation will be decisive.4-) Volume analysis is observed in a significant volume decrease in the volume bars located in the margin. This may be the harbinger of the decision of the decision and a large price movement is close. Under the support of 104,500 USDT .📉 The downward breakdown (Bearish scenario) 105,000 closures should be carefully monitored. Technical levels are clear, volume is decreasing and everything is ready for breakage. However, what will determine the direction is in which direction this formation will be broken. However, the most important thing that should not be ignored will be to follow the support-reasons. This analysis only offers a technical perspective. You should make your investment decisions in line with your own risk management and analysis process.
DeaLmooRT
STGUSDT Hareket başladı.
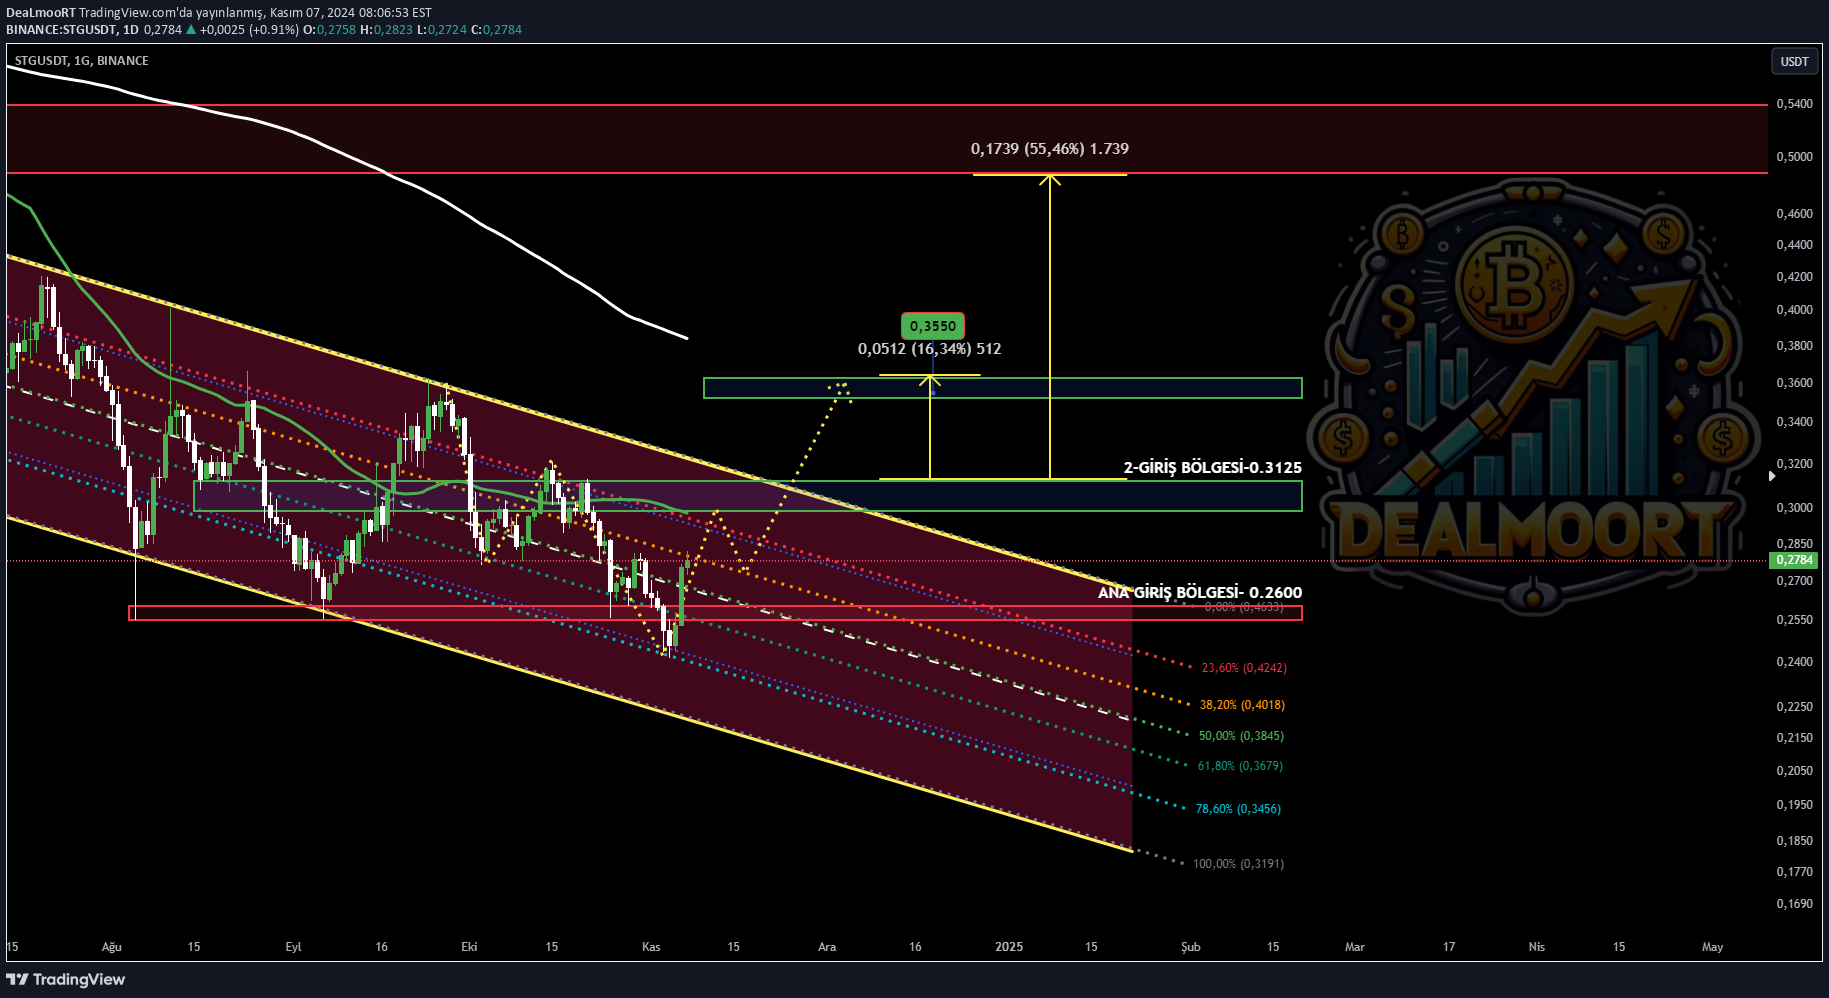
Hello friends, after a long break, we are together again. Today's guest is #STGUSDT. This friend of ours continues to move within a wedge structure and seems to have reacted and started an attack in our TRAIN FIBO 786-618 Region, but it needs to close above the 0.3100-0.32150 Region to start the rise. TARGETS Look Good. I HAVE FOLLOWED AND WILL BE WAITING. I am adding it to give you, our valuable investors, an IDEA.
DeaLmooRT
ENAUSDT Yapı güzel gözüküyor !
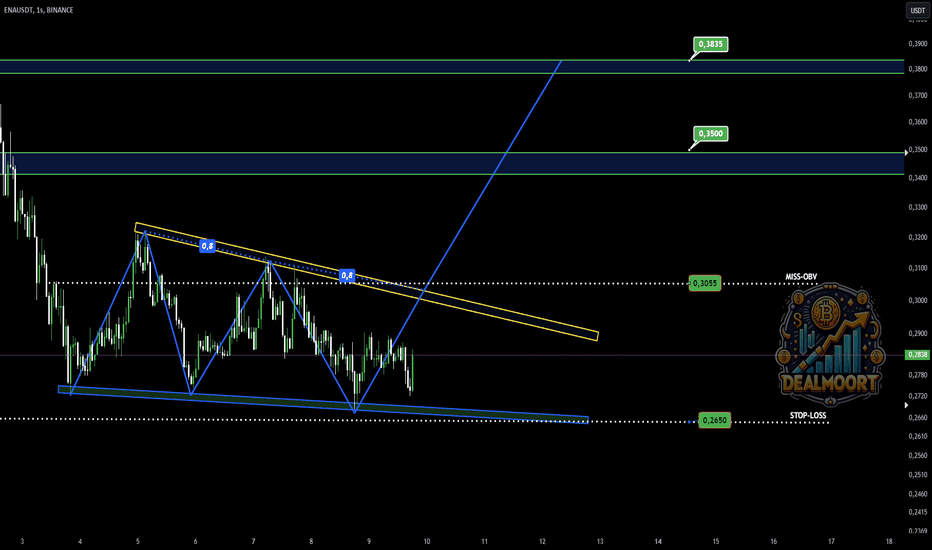
Yes friends, this time we came to you with the idea of #ENAUSDT Analysis, with the #Bitcoin pullback, new structures have started to form in most coins, #ENAUSDT stands out at the top of these structures, there is a falling wedge formation, the movement places that will occur after this formation are determined by fundamental analysis. I followed #ENAUSDT, I'm waiting. You can also comment on the idea analysis about the coin you have in mind! Your coin may be next in the idea analysis.
DeaLmooRT
#APTUSDT yükselmekte KARARLI !
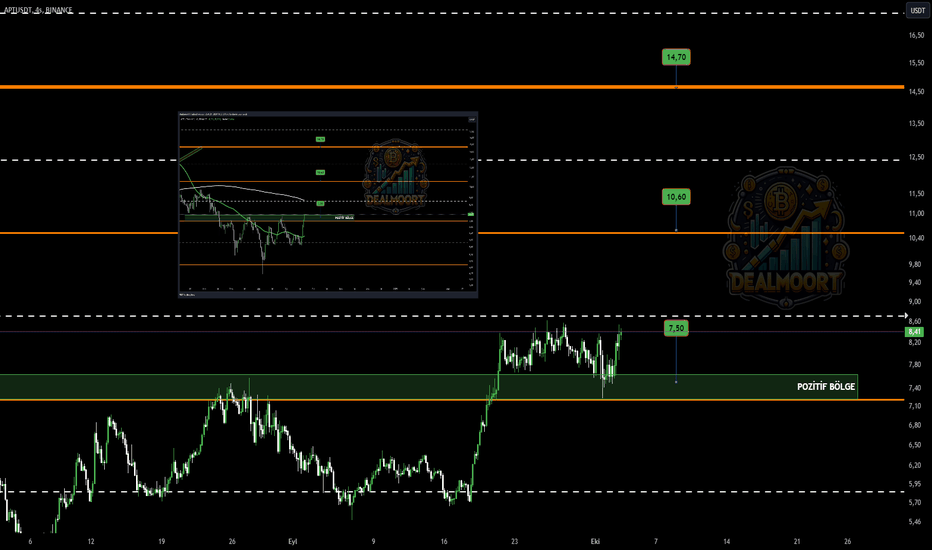
Hello friends, I shared the ANALYSIS IDEA for #APTUSDT on Twitter and Telegram. If we come to #APTOS, although it responded late to the rise of #Bitcoin, it is trying to resist the pullback and stay in the area we call positive zone, which is a good move. We can say that it will come to sequential targets as long as it stays in the 7.00-7.500 band. As in the #ARKMUSDT idea, these movements may be the harbingers of a rise in #APTUSDT. CONTINUE TO FOLLOW,
Disclaimer
Any content and materials included in Sahmeto's website and official communication channels are a compilation of personal opinions and analyses and are not binding. They do not constitute any recommendation for buying, selling, entering or exiting the stock market and cryptocurrency market. Also, all news and analyses included in the website and channels are merely republished information from official and unofficial domestic and foreign sources, and it is obvious that users of the said content are responsible for following up and ensuring the authenticity and accuracy of the materials. Therefore, while disclaiming responsibility, it is declared that the responsibility for any decision-making, action, and potential profit and loss in the capital market and cryptocurrency market lies with the trader.