
SPYX
SP500 tokenized ETF (xStock)
| تریدر | نوع سیگنال | حد سود/ضرر | زمان انتشار | مشاهده پیام |
|---|---|---|---|---|
 DatTongRank: 33 | خرید | حد سود: ۷٬۰۰۰ حد ضرر: ۶٬۷۶۵ | 10/28/2025 | |
 julia17Rank: 105 | فروش | حد سود: تعیین نشده حد ضرر: تعیین نشده | 10/30/2025 | |
 The_STARank: 122 | خرید | حد سود: تعیین نشده حد ضرر: تعیین نشده | 10/29/2025 | |
 JoeChampionRank: 181 | خرید | حد سود: تعیین نشده حد ضرر: تعیین نشده | 10/10/2025 | |
 isahebdadiRank: 789 | خرید | حد سود: ۷٬۰۰۰ حد ضرر: ۶٬۱۴۵ | 10/18/2025 |
Price Chart of SP500 tokenized ETF (xStock)
سود 3 Months :
سیگنالهای SP500 tokenized ETF (xStock)
Filter
Sort messages by
Trader Type
Time Frame

نوسانات عجیب SPX تا هالووین: آیا 6800 دوباره لمس میشود؟
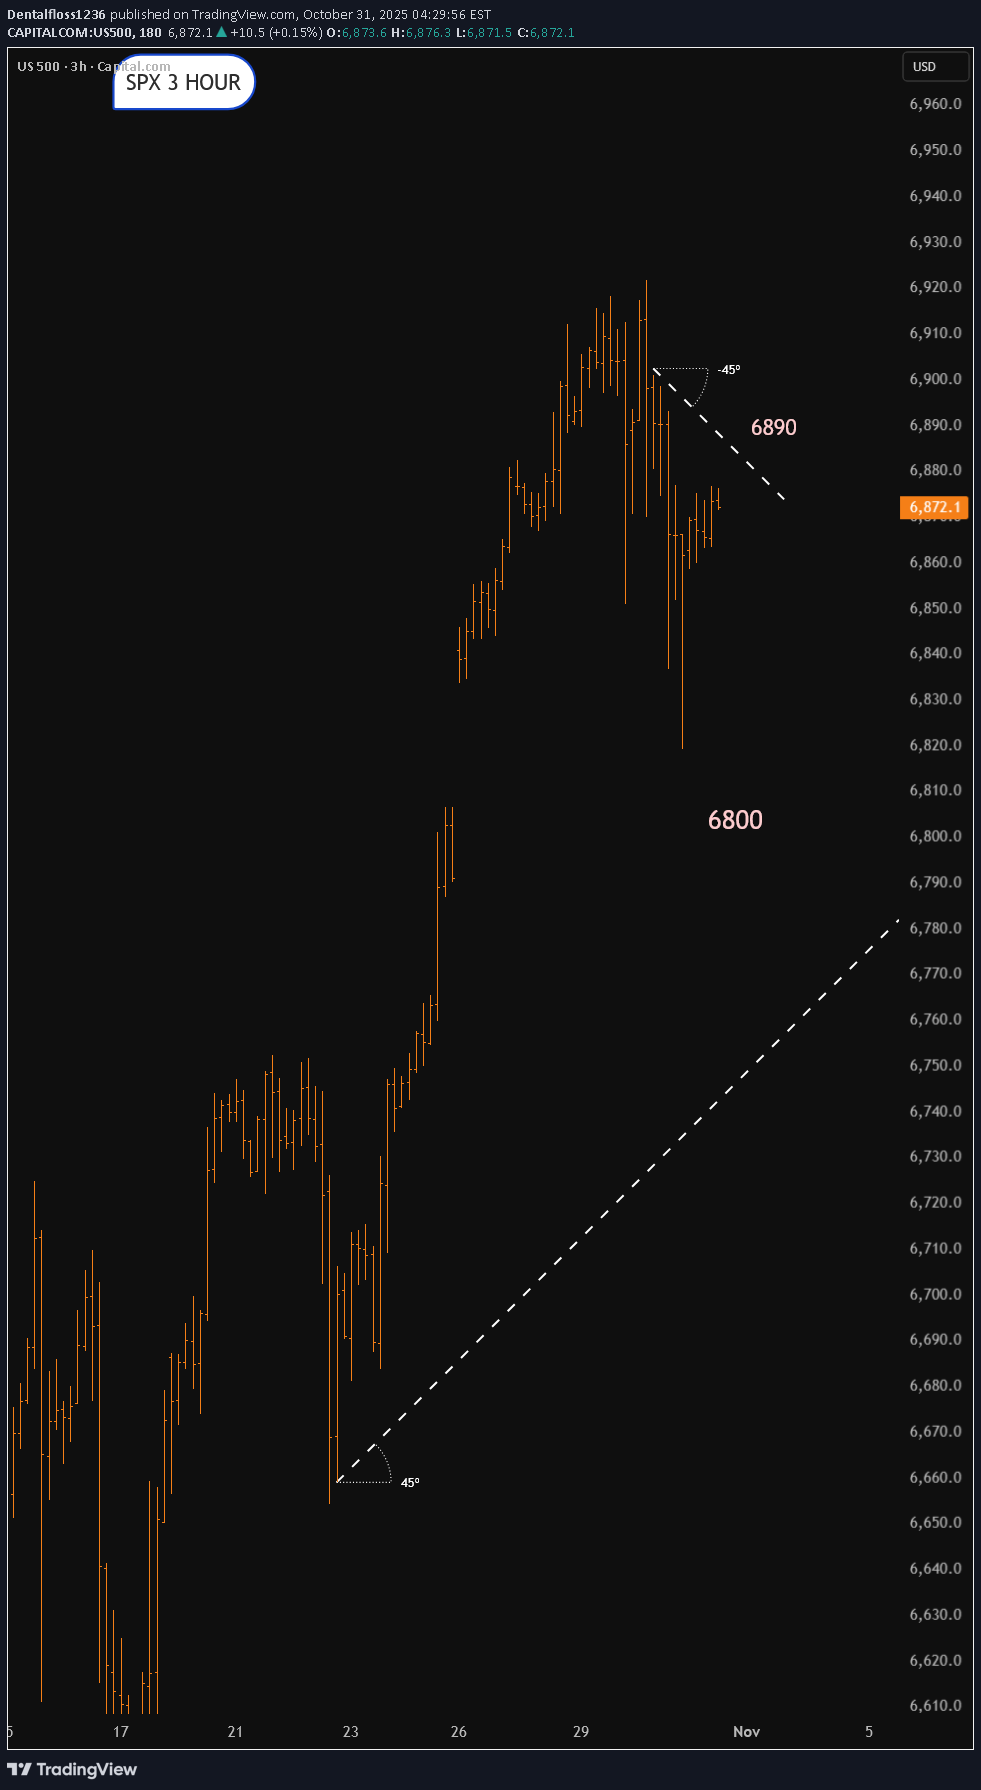
Possibly above 6890 may not be liked 6800 could get tested Lets see what happens

شاخص قیمت مصرفکننده (CPI) چیست و چرا برای اقتصاد جهان حیاتی است؟
Introduction: The Pulse of the Global Economy In the complex world of economics, few indicators hold as much influence and significance as the Consumer Price Index (CPI). Whether it’s a policymaker setting interest rates, an investor predicting market movements, or an ordinary consumer noticing rising grocery bills, CPI plays a role in everyone’s financial life. It acts as a mirror reflecting changes in the cost of living and inflation, shaping everything from global monetary policies to household budgets. Simply put, CPI measures how much prices have increased or decreased for a basket of goods and services that consumers typically buy. However, behind this simple concept lies a powerful tool that helps nations assess economic stability, business competitiveness, and the real purchasing power of their citizens. Understanding CPI: The Basics The Consumer Price Index (CPI) is an economic indicator that measures the average change in prices of a fixed basket of goods and services over time. This basket includes everyday items such as food, housing, clothing, healthcare, transportation, and education — essentially capturing the spending habits of urban consumers. CPI as a Measure of Inflation CPI is the most widely used tool to measure inflation — the general increase in prices and fall in the purchasing power of money. When CPI rises steadily, it indicates inflation; when it falls, it suggests deflation. Inflation can be both a sign of growth and a warning signal. Moderate inflation encourages spending and investment, as people prefer to buy now rather than later. But excessive inflation — as seen in countries like Argentina or Turkey in recent years — erodes savings, raises borrowing costs, and destabilizes economies. Conversely, deflation (a sustained drop in prices) might sound appealing but can trigger economic stagnation. Falling prices reduce business revenues and wages, discouraging spending and investment. Thus, tracking CPI helps governments strike a delicate balance between economic growth and price stability. Types of CPI Economists often use different versions of CPI to capture varied aspects of price changes: Headline CPI: This is the broadest measure, including all goods and services in the consumer basket. It reflects the overall inflation rate but can be volatile due to changes in food and energy prices. Core CPI: Excludes food and energy components, as they are prone to short-term fluctuations. Core CPI gives a clearer picture of long-term inflation trends. CPI-W and CPI-U (in the U.S.): CPI-W tracks the spending habits of urban wage earners and clerical workers. CPI-U includes all urban consumers and is considered the official measure of inflation. HICP (Harmonized Index of Consumer Prices): Used by the European Union, this version allows for consistent inflation comparisons across member states. Each variation of CPI serves a specific policy or analytical purpose, allowing economists to monitor inflation more accurately across different sectors and regions. CPI and Global Monetary Policy CPI plays a central role in shaping global monetary policy. Central banks like the Federal Reserve (U.S.), European Central Bank (ECB), Bank of England, and the Reserve Bank of India (RBI) rely on CPI trends to make key decisions about interest rates and money supply. When CPI shows rising inflation, central banks often raise interest rates to cool down spending and borrowing. When CPI indicates deflation or weak inflation, they lower rates to stimulate economic activity. For instance, during the COVID-19 pandemic, global CPI levels dropped as demand collapsed. Central banks responded with historically low interest rates and massive stimulus packages. However, post-pandemic supply chain disruptions and energy shortages sent CPI soaring globally — prompting rapid interest rate hikes in 2022–2023. These fluctuations show how closely CPI data influences global financial stability, currency values, and investment decisions. CPI and Purchasing Power CPI also helps determine changes in purchasing power — how much goods and services a unit of currency can buy. If wages rise slower than CPI, real income effectively decreases, meaning consumers can buy less with the same money. For example: If CPI rises by 6%, but wages increase by only 3%, then real wages have fallen by 3%. This erosion in purchasing power can reduce consumer confidence and spending — key drivers of economic growth. Governments and labor unions often use CPI data to adjust wages, pensions, and social benefits (a process called indexation) to maintain people’s living standards. CPI as a Global Benchmark CPI data is not just a domestic concern — it has international ramifications. Global investors, financial institutions, and multinational corporations all monitor CPI across different countries to assess economic health and currency risks. Here’s how: Exchange Rates: High inflation (rising CPI) typically weakens a nation’s currency because it erodes purchasing power. Investors may move money to countries with lower inflation and higher returns, affecting foreign exchange markets. Investment Flows: CPI trends help guide foreign direct investment (FDI) and portfolio investment decisions. For instance, a stable CPI and moderate inflation attract investors seeking predictable returns. Trade Competitiveness: Countries with lower inflation maintain price stability in exports, making their goods more competitive globally. Conversely, high CPI growth can make exports expensive and hurt trade balances. Thus, CPI serves as a universal barometer for comparing economic conditions across nations. CPI and the Financial Markets The stock market, bond market, and commodity markets react strongly to CPI reports. Traders and investors treat CPI announcements as key economic events because they directly influence interest rate expectations and corporate profitability. Equity Markets: Rising CPI may hurt company profits by increasing input costs. However, certain sectors — like energy, commodities, and consumer staples — often benefit during inflationary periods. Bond Markets: Bonds are highly sensitive to inflation. When CPI rises, bond yields increase because investors demand higher returns to offset the loss of purchasing power. This inversely affects bond prices. Commodity Markets: Commodities such as gold and crude oil often act as inflation hedges. A high CPI can push investors toward tangible assets that retain value when currencies lose purchasing power. Thus, CPI data can trigger short-term volatility and long-term investment strategy shifts across asset classes. Limitations of CPI While CPI is an essential tool, it’s not without flaws. Economists often debate its accuracy and representativeness due to several factors: Substitution Bias: Consumers tend to switch to cheaper alternatives when prices rise, but CPI assumes a fixed basket — overstating inflation. Quality Adjustments: Technological improvements often increase product quality (e.g., smartphones), but CPI may not fully capture this added value. Geographical Variations: Price changes differ between regions. Urban CPI may not accurately reflect rural cost-of-living changes. Lagging Indicator: CPI measures inflation after it has occurred, meaning policymakers are often reacting to past data. Exclusion of Certain Costs: CPI may exclude investment assets like real estate or stocks, even though they significantly affect household wealth. Despite these limitations, CPI remains the most reliable and widely accepted inflation measure because of its consistency and comparability. Case Studies: CPI in Action 1. United States: Inflation and Federal Reserve Policy In 2022, U.S. CPI surged above 9%, the highest in four decades. Rising food, fuel, and housing costs prompted the Federal Reserve to raise interest rates aggressively throughout 2022–2023. This decision cooled inflation but also slowed economic growth and rattled stock markets. It showcased how CPI data can reshape monetary strategy and ripple through global markets. 2. India: Balancing Growth and Inflation India’s CPI basket is heavily weighted toward food and housing. When food prices rise due to poor monsoon or supply shortages, CPI spikes quickly. The RBI uses CPI as its main inflation target, aiming to keep it between 2–6%. By adjusting repo rates based on CPI trends, the RBI manages both growth and price stability. 3. Eurozone: The Battle with Deflation and Energy Prices For years, the Eurozone struggled with low inflation and deflation risks, prompting the ECB to maintain ultra-low interest rates. However, after the Ukraine conflict in 2022, energy-driven CPI spikes forced the ECB to tighten policy sharply. This swing illustrated CPI’s impact on regional economic integration and fiscal coordination. CPI in the Context of Global Challenges Today’s world faces unprecedented inflationary pressures due to factors like: Geopolitical conflicts (e.g., Russia–Ukraine) Supply chain disruptions Energy market volatility Climate change impacting agriculture Post-pandemic demand surges As a result, global CPI data has become a critical early warning system for potential recessions, stagflation, or monetary tightening cycles. International institutions such as the IMF and World Bank rely on CPI trends to forecast global growth and recommend policy adjustments. Future of CPI: Adapting to a Changing Economy As consumption habits evolve, CPI calculations must also adapt. The rise of digital goods, subscription services, and AI-driven economies is reshaping how statisticians define the “consumer basket.” Future CPI methodologies may include: Real-time price tracking using big data and AI Regional CPI dashboards for urban and rural contrasts Inclusion of environmental costs and green inflation (the impact of climate policies on prices) Better adjustments for technological improvements Such innovations will make CPI a more accurate, dynamic, and inclusive measure of global inflation. Conclusion: The Global Significance of CPI The Consumer Price Index is more than just a number; it is the heartbeat of the world economy. It influences how central banks set interest rates, how investors allocate capital, how governments plan budgets, and how families manage their daily expenses. Understanding CPI is crucial not only for economists but for anyone navigating an interconnected global economy. Whether inflation is surging or stabilizing, CPI tells the story of how value, consumption, and confidence move together in shaping our economic future. In a world of shifting trade patterns, volatile energy markets, and evolving digital economies, CPI remains the compass that helps policymakers, businesses, and citizens alike find direction amid economic uncertainty.
Trade Nation
درآمدهای S&P 500: آیا بازار به سمت نوسان بزرگ حرکت میکند؟
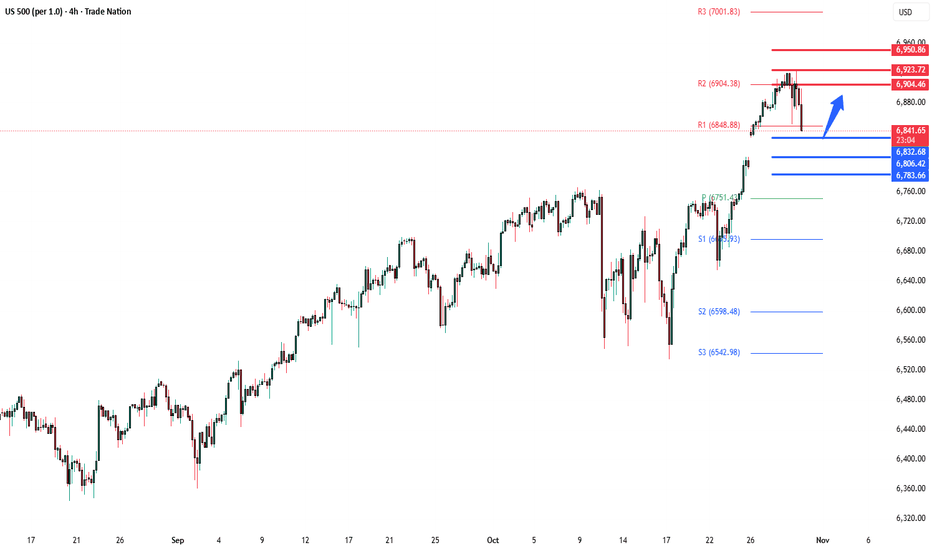
The S&P 500 closed flat (-0.004%) as Powell tempered expectations for another Fed rate cut in December, while upbeat Trump–Xi trade talks and Nvidia’s milestone $5trn valuation buoyed sentiment. Yields spiked (+10.1bps on 10yr Treasuries) as the BoJ held steady and tech gains drove the NASDAQ (+0.55%) and Mag-7 (+1.03%) to new highs. US equity futures are modestly higher ahead of today’s key events — Apple and Amazon earnings, which will steer Nasdaq direction, and the ECB’s policy decision, where rates are expected to remain unchanged at 2%. Broader attention will also be on results from Eli Lilly, Merck, and Gilead in pharma, alongside major releases in energy and industrials. Key Support and Resistance Levels Resistance Level 1: 6904 Resistance Level 2: 6923 Resistance Level 3: 6950 Support Level 1: 6832 Support Level 2: 6806 Support Level 3: 6783 This communication is for informational purposes only and should not be viewed as any form of recommendation as to a particular course of action or as investment advice. It is not intended as an offer or solicitation for the purchase or sale of any financial instrument or as an official confirmation of any transaction. Opinions, estimates and assumptions expressed herein are made as of the date of this communication and are subject to change without notice. This communication has been prepared based upon information, including market prices, data and other information, believed to be reliable; however, Trade Nation does not warrant its completeness or accuracy. All market prices and market data contained in or attached to this communication are indicative and subject to change without notice.

رازهای فصل گزارش سود: چگونه مثل حرفهایها هر فصل را مدیریت کنیم؟
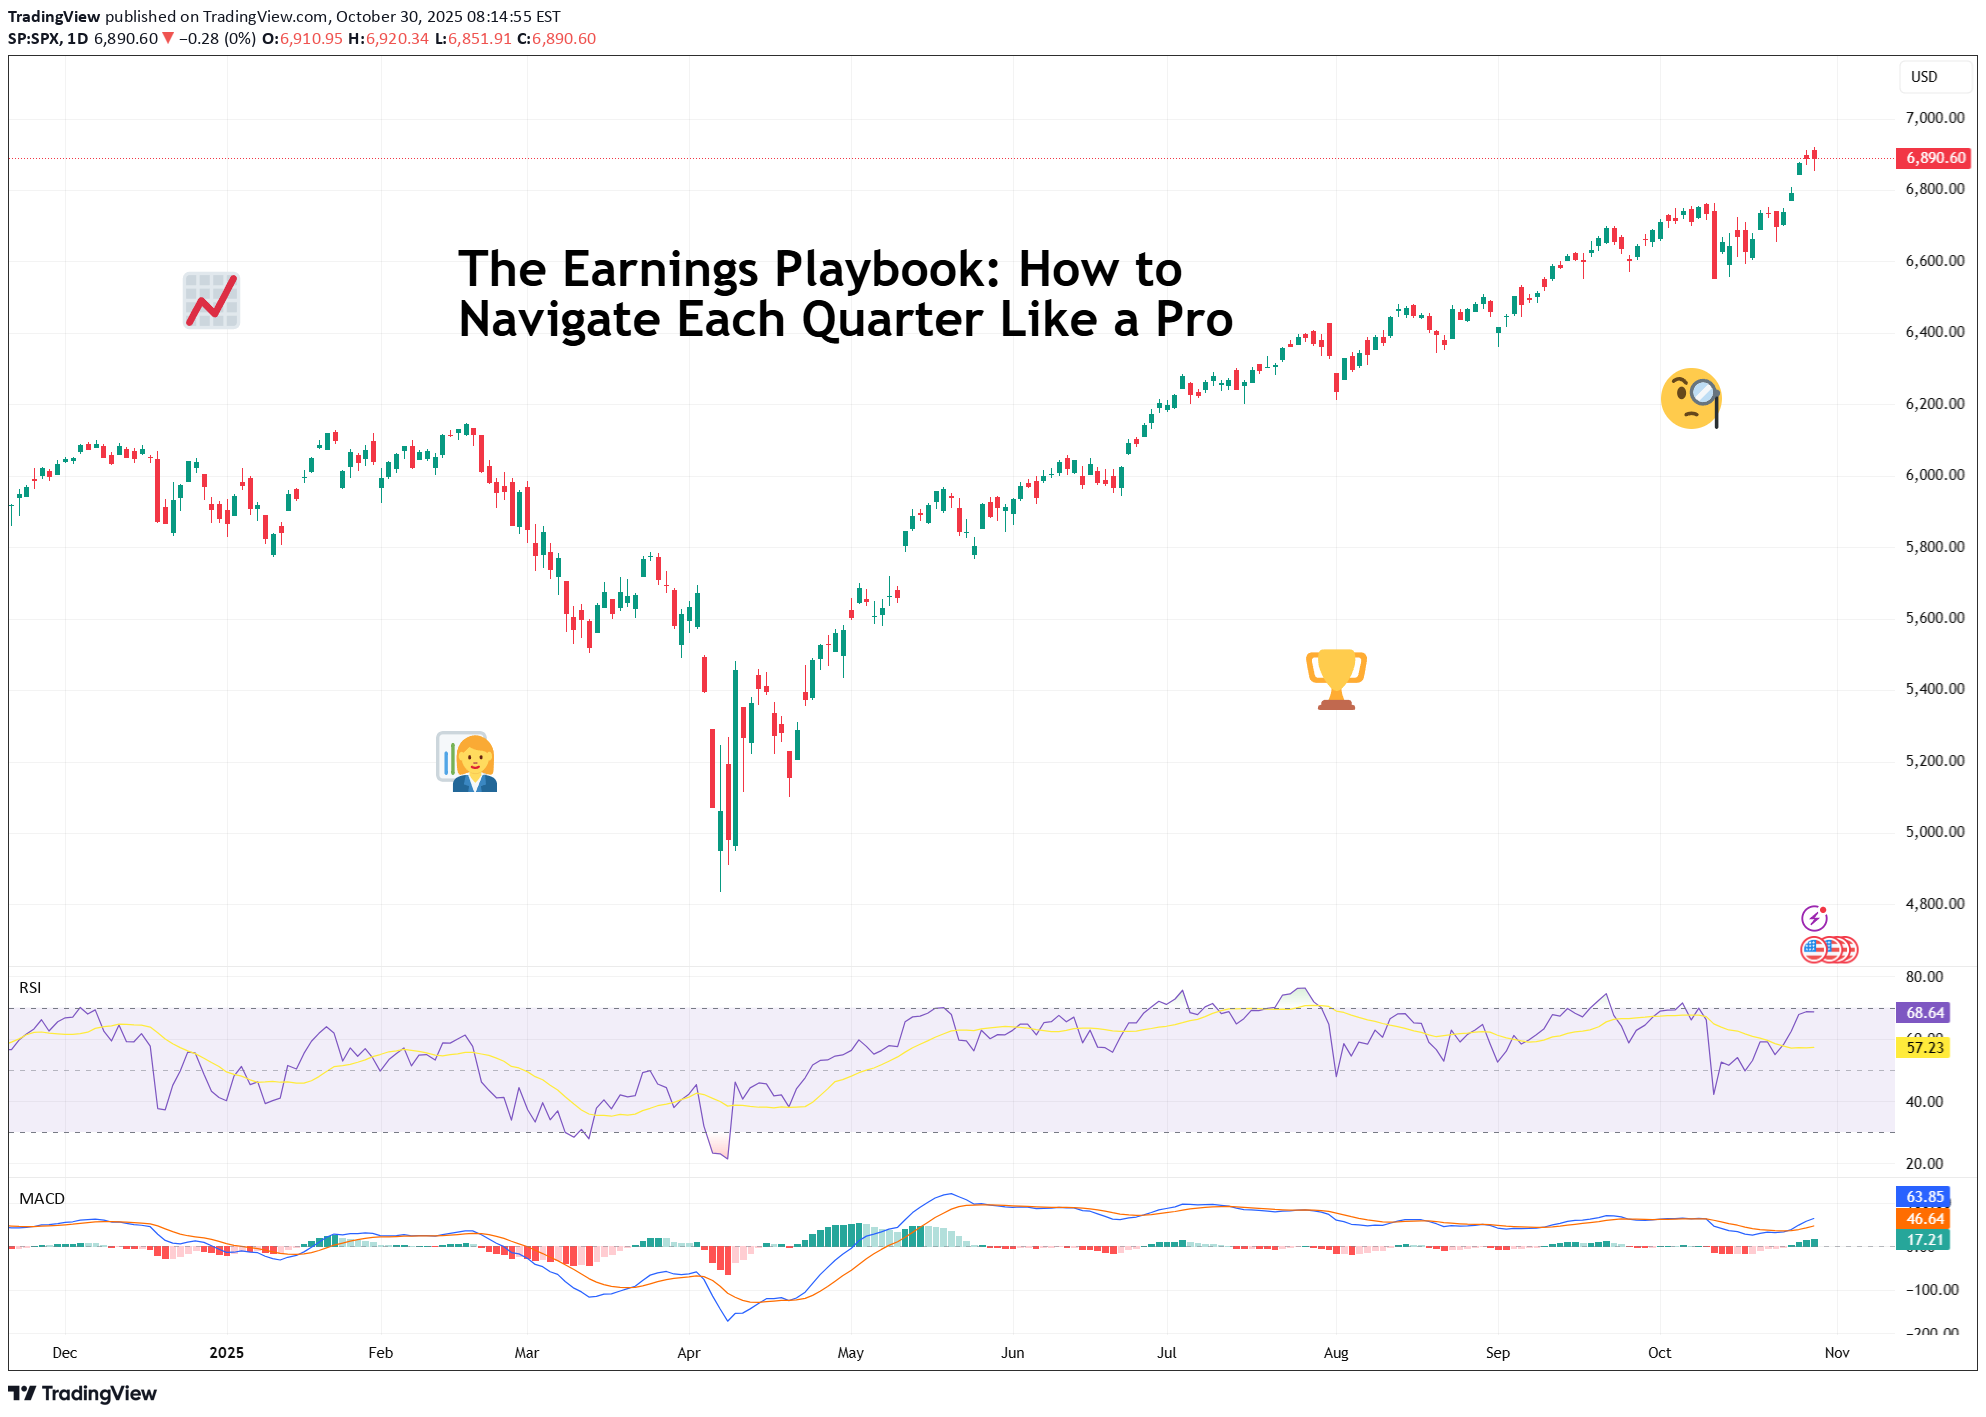
Traders are in the heat of the earnings season and euphoria is sweeping every corner of the market. The charts twitch, traders stop talking about the Fed for five minutes ( not this week, though ), and online forums turn into a parade of watch-me-trade sessions. It’s that glorious stretch when companies pop open the books and reveal what’s really been happening behind the scenes. For professional investors, it’s data heaven. For retail traders, it’s emotional cardio. Stocks can rise 20% on a single upbeat forecast — or plummet before your coffee cools. The trick isn’t just to survive it. It’s to navigate it like a pro. 💼 Know the Seasons (and the Mood Swings) Earnings season comes four times a year — January, April, July, and October — and each has its own flavor. Q1 (April): That’s the hangover quarter. Holiday sales meet new-year cost cuts. Traders recalibrate expectations and reality collides with ambition. Q2 (July): The mid-year checkup. CEOs brag about “momentum,” analysts start sharpening their red pencils. Markets get twitchy. Q3 (October): The credibility test. Guidance revisions and cautious tones dominate. If the year’s been good, this is where the victory laps start. Q4 (January): The scoreboard reveal. Everyone tallies their annual wins and losses, and traders begin to bet on who carries the next year’s momentum. Each cycle has a similar rhythm: hype, reaction, digestion, and speculation. Think of it like a four-act play. 📊 Mind the Gap One thing to keep in mind whenever you find yourself in the earnings bonanza: the actual numbers matter less than the narrative. ( Looking at you, Oracle ORCL ) A company can beat on revenue, miss on profit, and still rally — if the CEO sells a compelling story about the next quarter. Conversely, it can post record earnings and tank because analysts wanted even more. The pros know to look beyond the headline EPS. They dig into guidance, margins, and segment performance. Is revenue growing because of genuine demand, or just creative accounting? Are margins improving, or did the company quietly cut R&D? Markets don’t price what’s happened — they price what’s next. That’s especially true for growth stocks like t echnology companies . 🎯 Don’t Chase the Knee-Jerk Every earnings season has its share of instant overreactions — the “up 10% at open, down 8% by lunch” kind of chaos. That’s when seasoned traders sit back and let volatility do the heavy lifting. Smart money avoids buying into the frenzy or shorting into despair. Instead, they wait for the second move — when dust settles, algorithms calm down, and humans return to their desks. 🧠 Build Your Own Playbook To trade earnings season like a pro, you need a plan. Here’s how the veterans prep: Start early. Check the earnings calendar and mark high-impact names in your portfolio or watchlist. Study the setup. Look at how the stock’s performed heading into earnings. A big pre-report rally can mean expectations are too high. Focus on guidance. Earnings beats are old news — future commentary moves markets. Use position sizing. Never bet the farm on one report. Even the best setups can go sideways. Don’t forget the macro. Rate cuts, inflation prints, or a stray tweet from the US President can overshadow the best earnings beat. 🕹️ The Big Picture: Earnings as Market GPS Earnings season is the market’s health check because it tells you which sectors are thriving, which are limping, and how CEOs feel about the future (watch the language: “headwinds” and “volatility” are polite ways of saying buckle up). Taken together, earnings trends shape the broader narrative — from interest rate expectations to sector rotations. In other words, earnings season is where short-term trading meets long-term investing. Now go and prepare for the next batch of earnings — Big Tech is on deck this week with Apple AAPL and Amazon AMZN reporting today. Off to you : What’s your strategy this earnings season? Buying the hype or waiting to buy the dip? Share your thoughts in the comments!

VIPindicators
سیگنال خرید قوی: S&P 500 (SPX) کانال صعودی را شکست! فرصت ورود به بازار رسید.
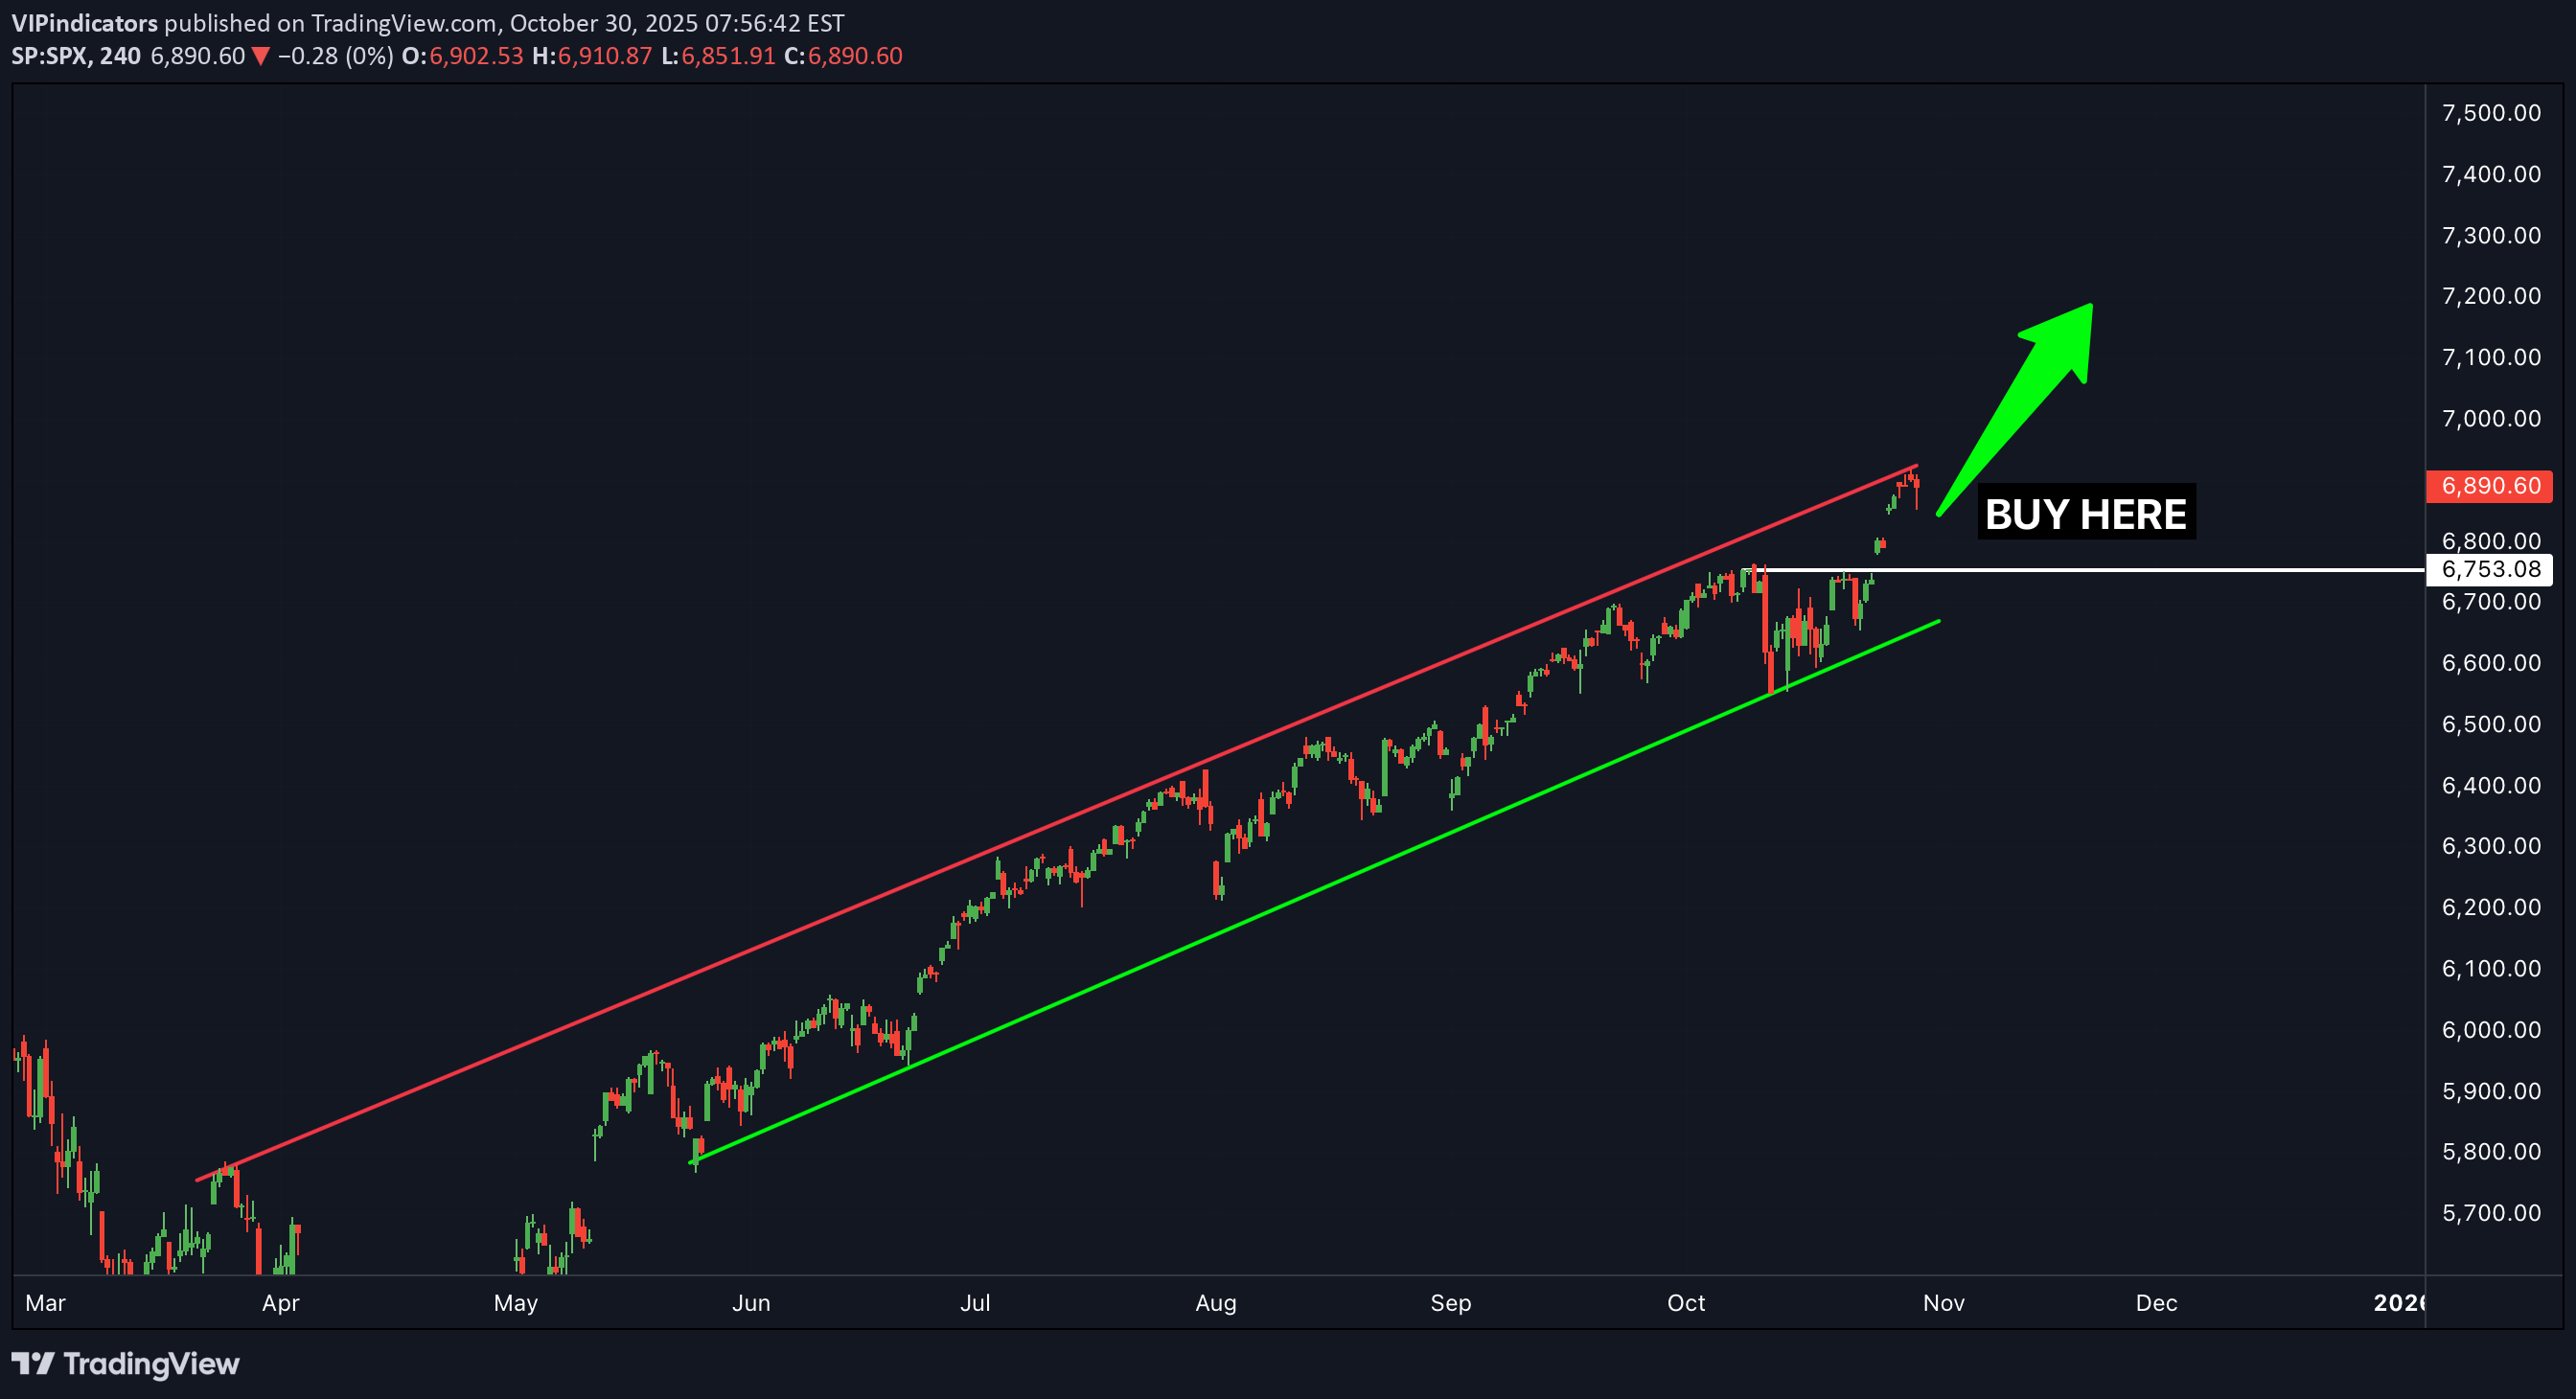
The SPX has been stuck inside an upward channel for many weeks and has been bouncing between both support and resistance levels. It has recently broken through a powerful resistance zone which was holding it... which means it is now very likely to keep heading to the upside.

NoFOMO_
آیا سقوط بزرگ در راه است؟ هشدار کاهش ۷ تا ۱۲ درصدی بازارها!
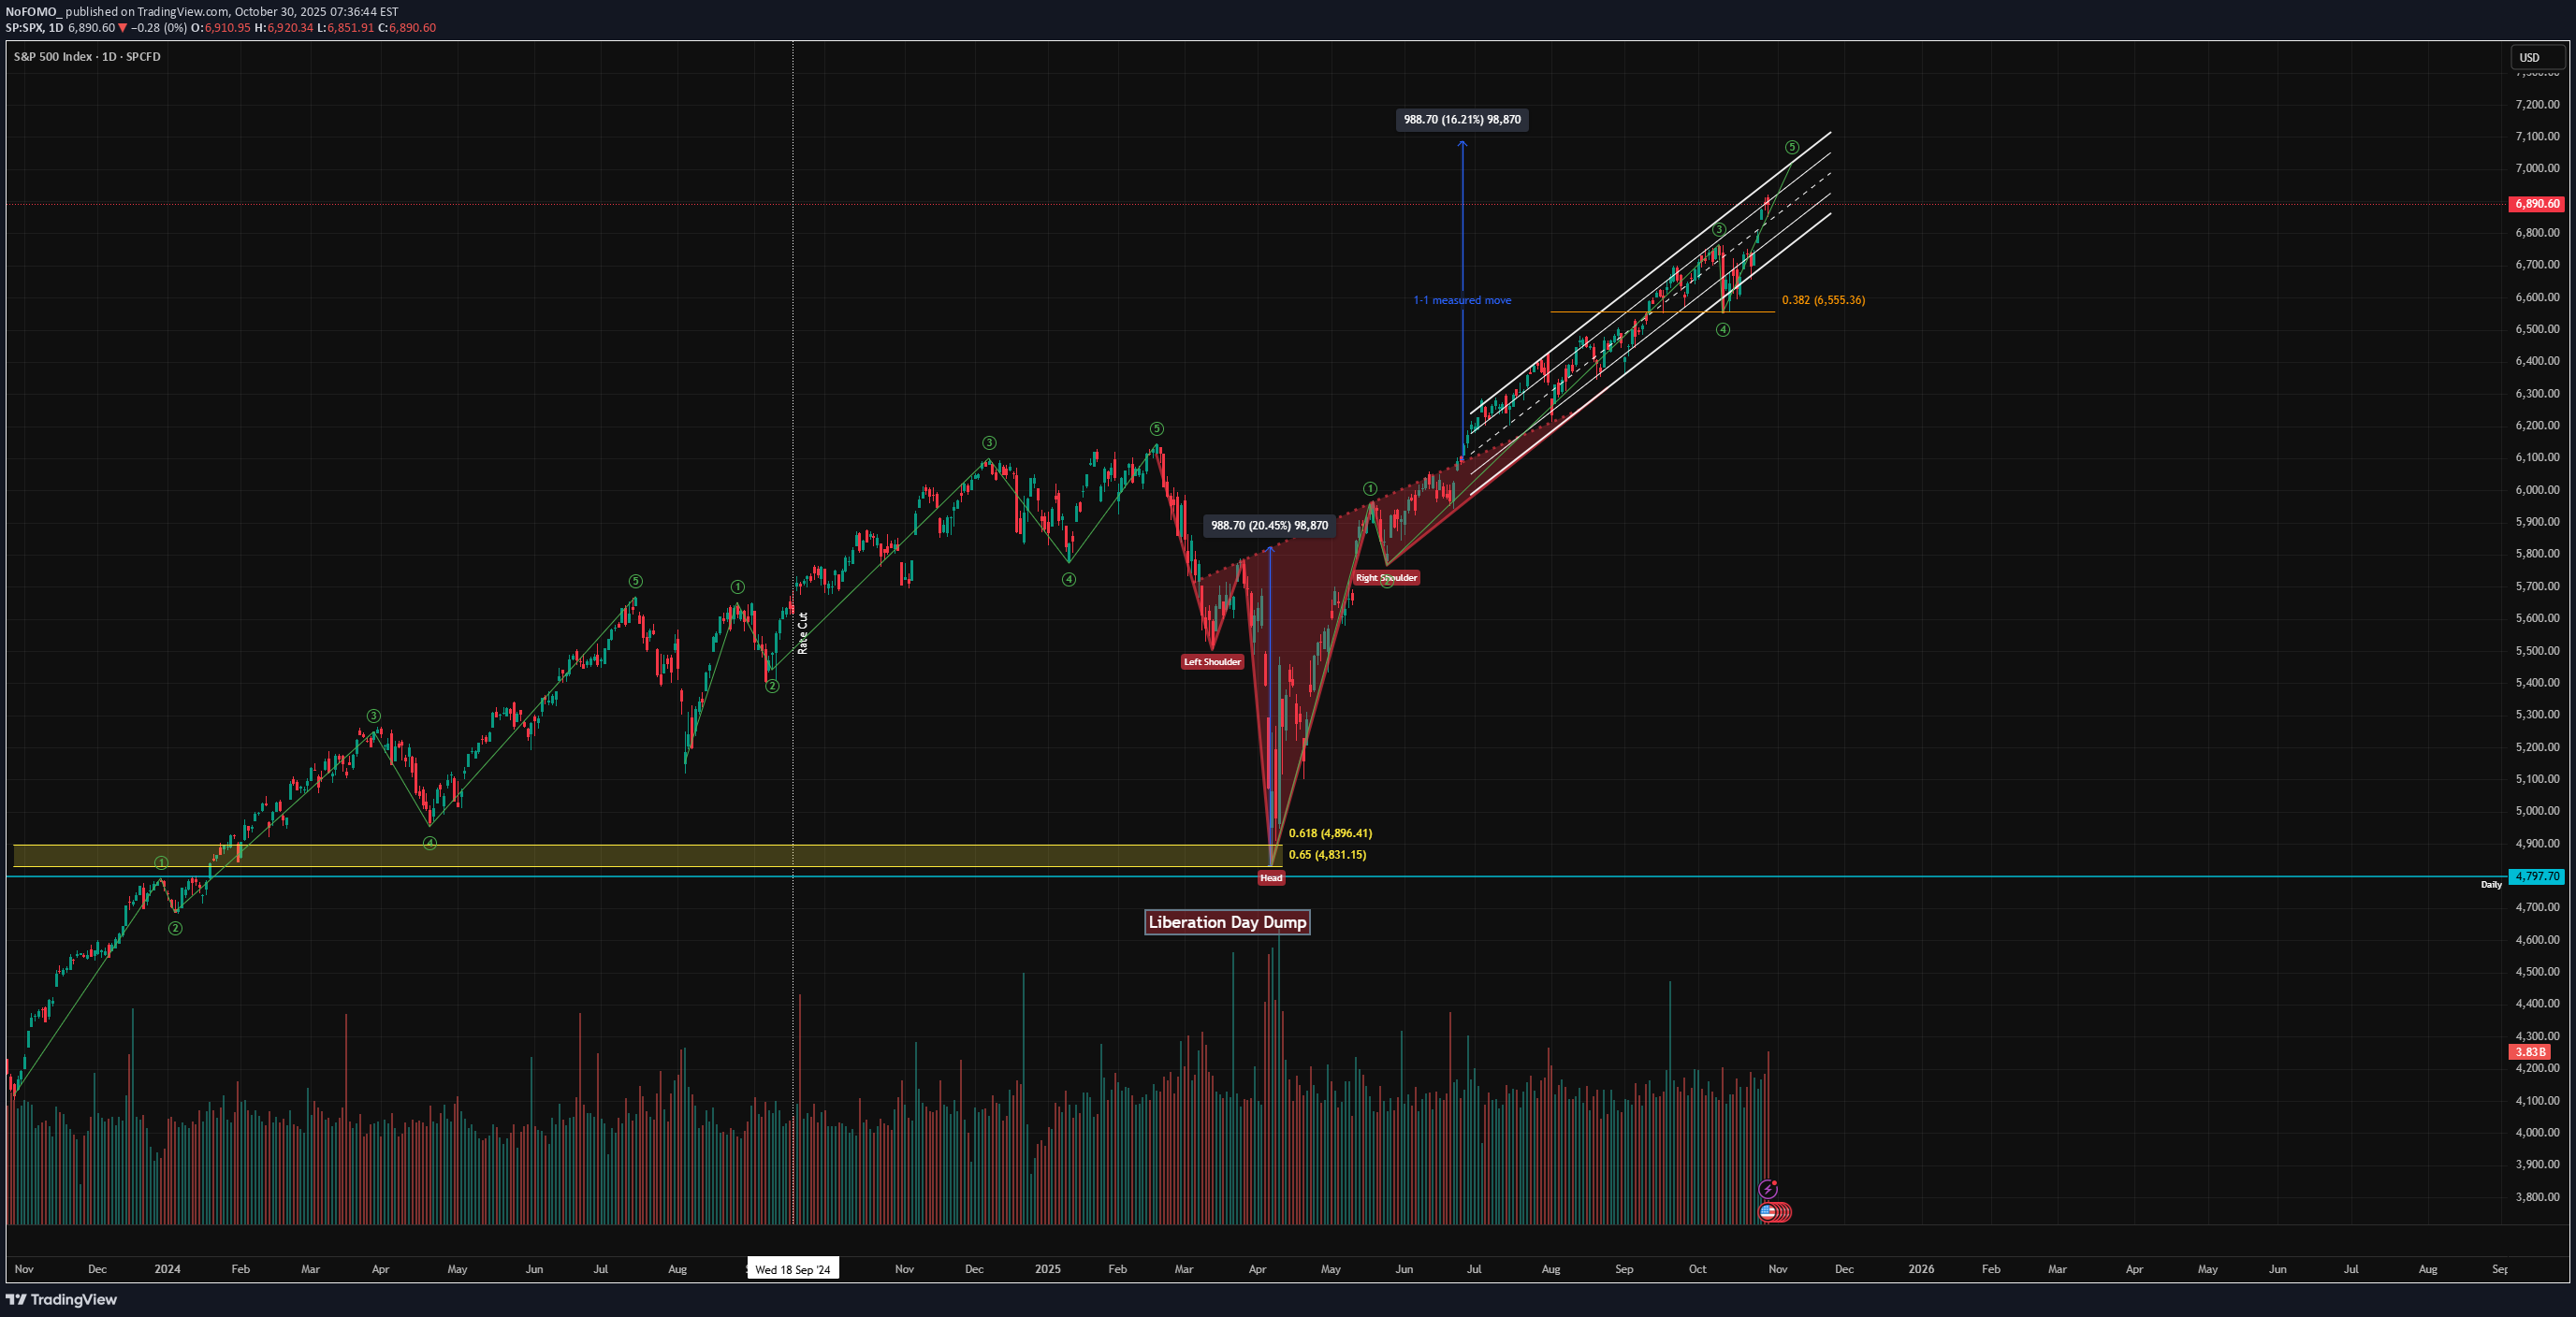
The move up since the liberation day dump has been epic. I called the low on the markets at the time. I was long AppLovin, AMD, Reddit, Arm, Alab, REMX, amongst many other names that far outperformed the market. I warned you about the imminent dump before it happened, and then took positions on the long side as the market capitulated and we hit the golden ratio. Now it's time to zoom out and remind you that this will not grind up forever. My interpretation of the chart is the move is nearing the end, the risk of strong downside move (7-12% drop) is increasing significantly and greed will catch many people out. The inverse head and shoulders pattern is almost complete, we are grinding up in this channel and will start to come up against the resistance over these coming days/weeks. I had an upside target of 7000-7250 and we are almost there. The dips are getting brought up, so bulls may have more time to make gains but I am not convinced that the gains are worth the risk at this stage. I will start taking some chips off the table here. Not financial advice, do what's best for you.
julia17
هشدار فوری: الگوی خفاش و مگافون در US500 شکل گرفت؛ سقوط به ۶۲۴۰!
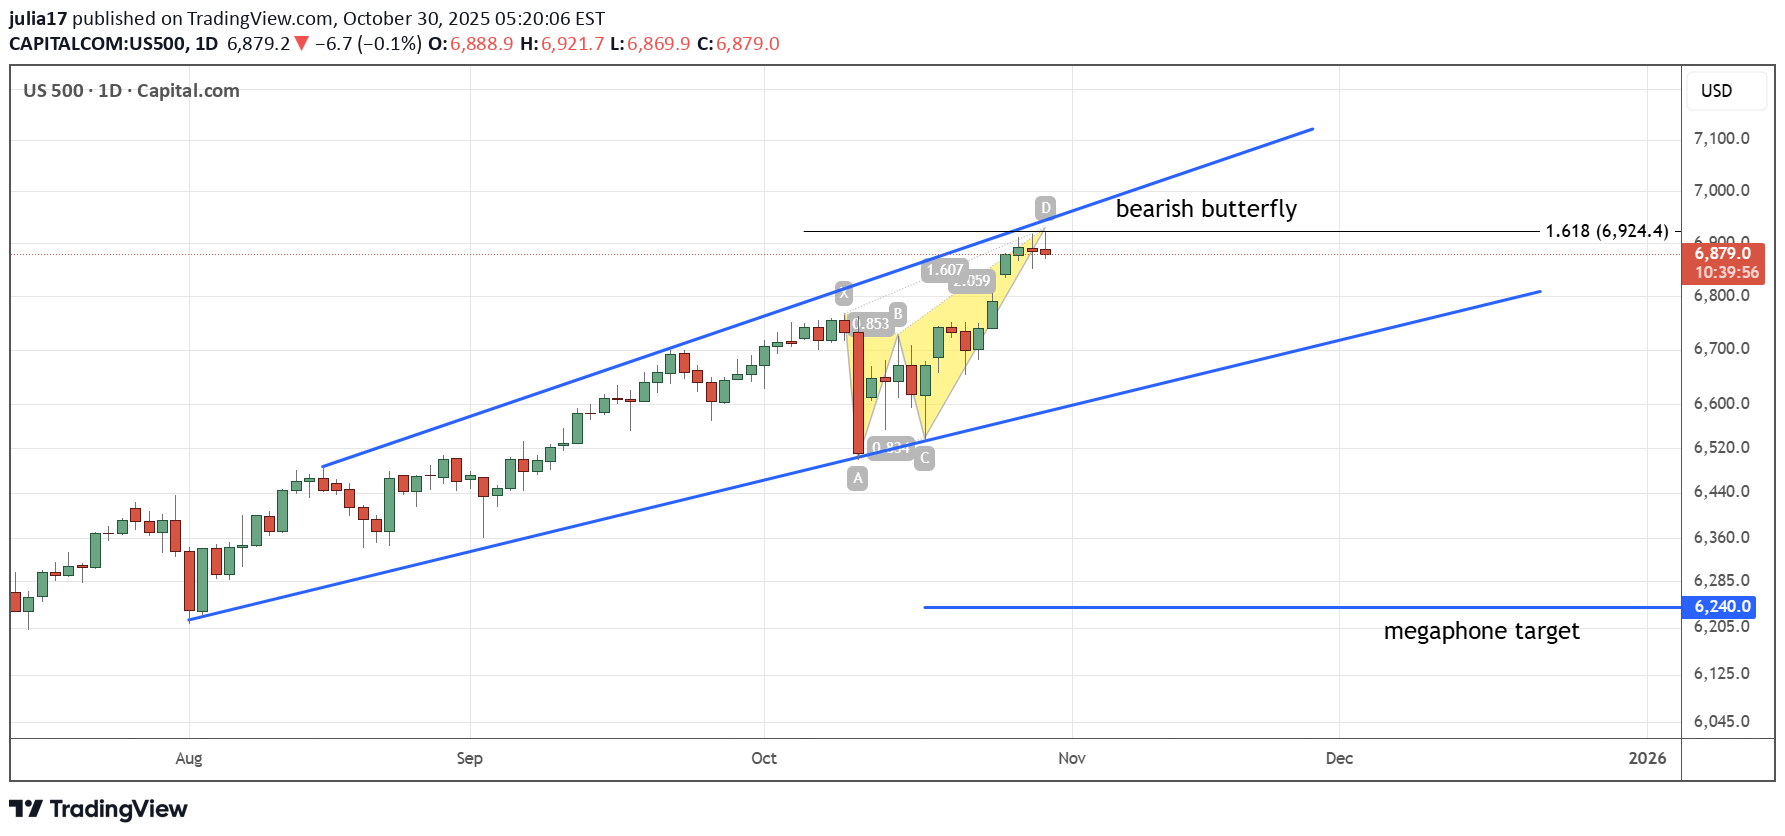
US500 has formed reversal bearish pattern - butterfly and megaphone pattern with target 6240.

ovvnyou
پیشبینی شوکهکننده بازار: آیا سقوط کریپتو در راه است؟
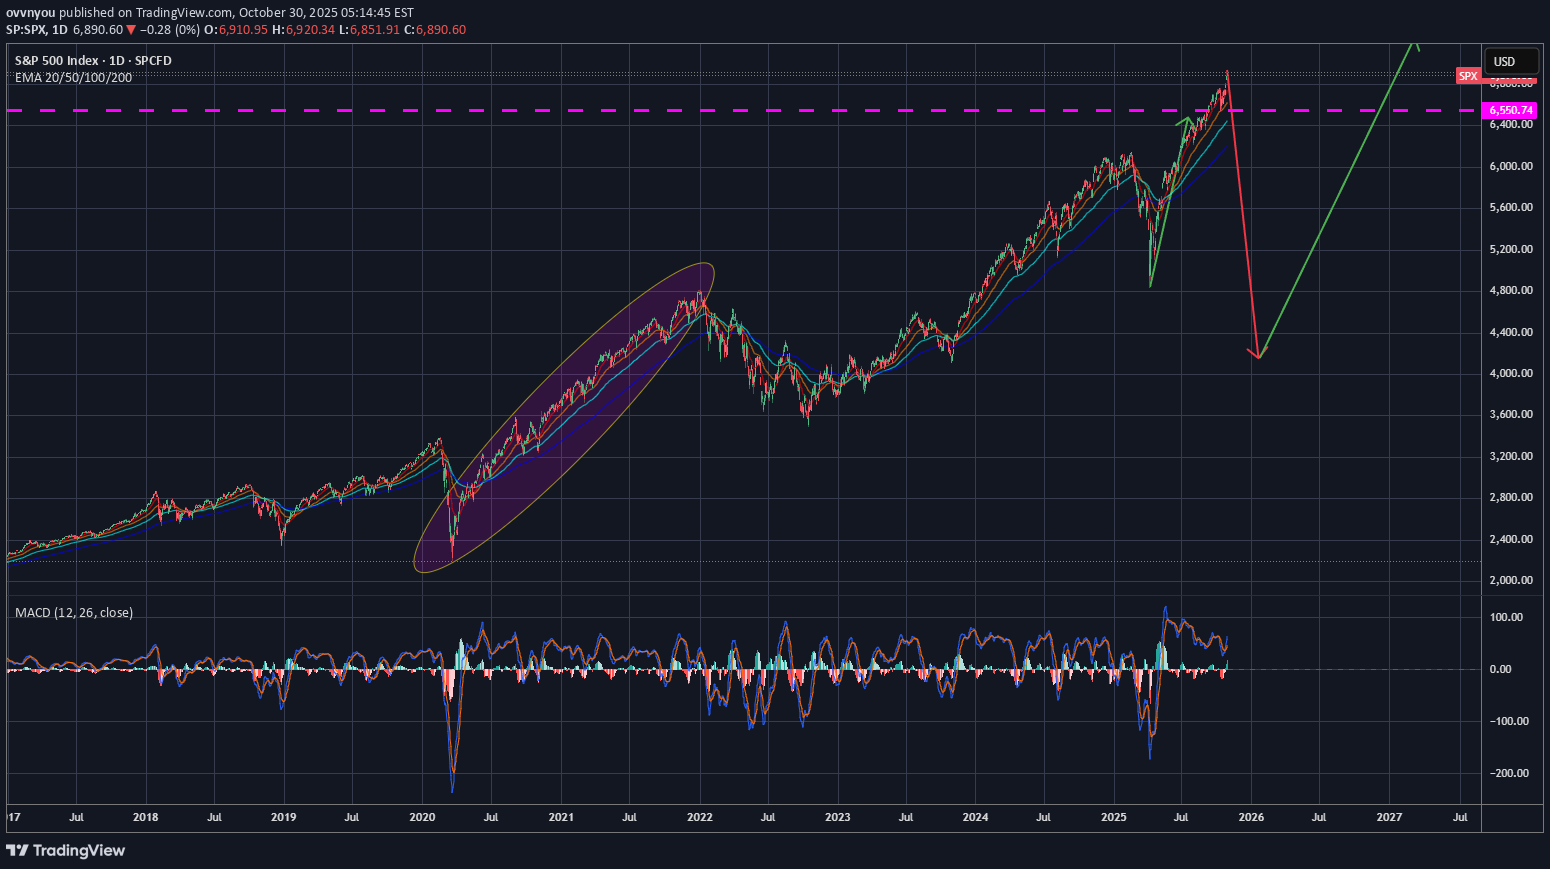
Shift prediction to the right. Global market cooler anticipated. Crypto should be hit the hardest and fastest. Most anticipating rally continuation like post-COVID... I think that will cause a surprise.

caueblanes
تحلیل شاخص US500: فرصت خرید در سطح حمایت کلیدی!
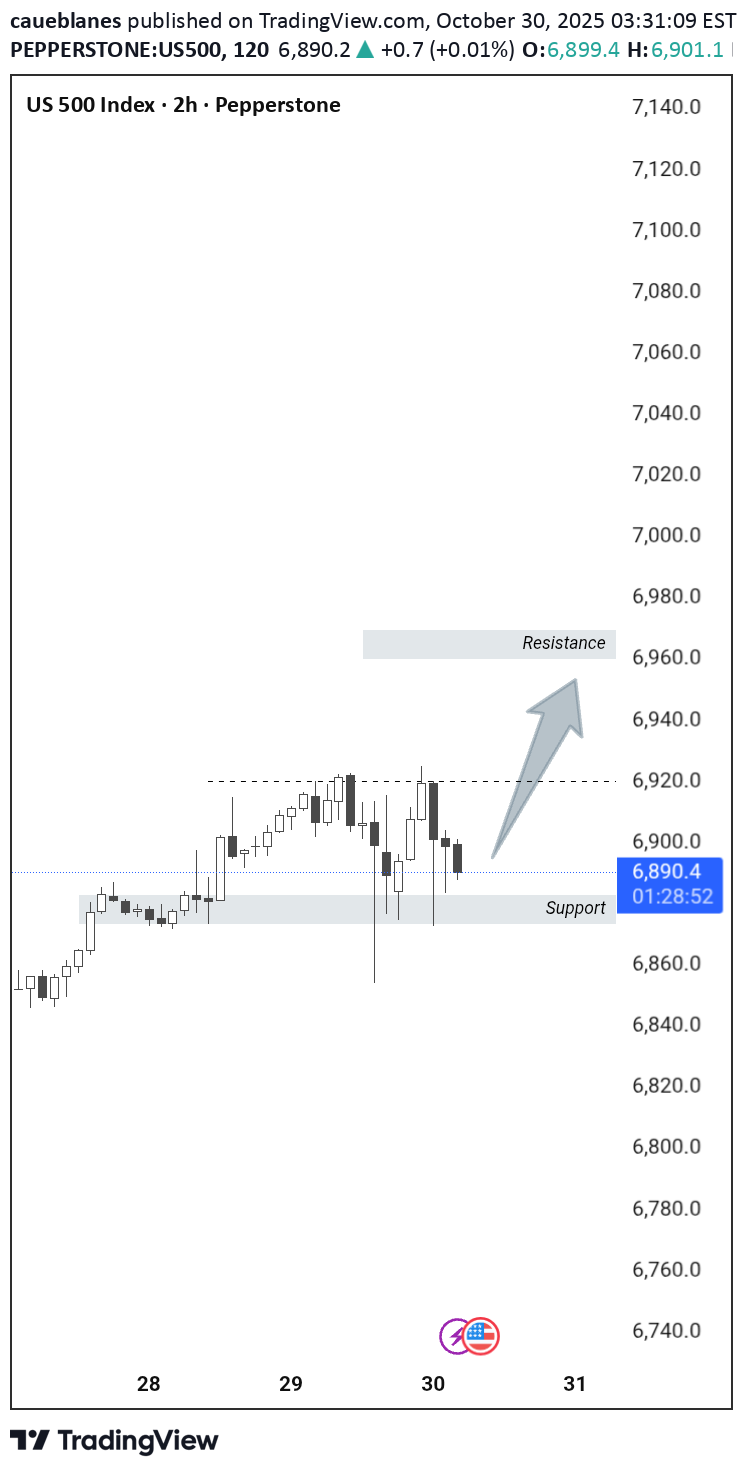
US500 – Opportunity at Support The price is consolidating between 6,880 and 6,920. The support region shows a buying reaction, which could generate a new impulse towards the resistance at 6960.
Swissquote
فدرال رزرو: آیا خوشبینی بازار سهام توجیه دارد یا پایان سرخوشی نزدیک است؟
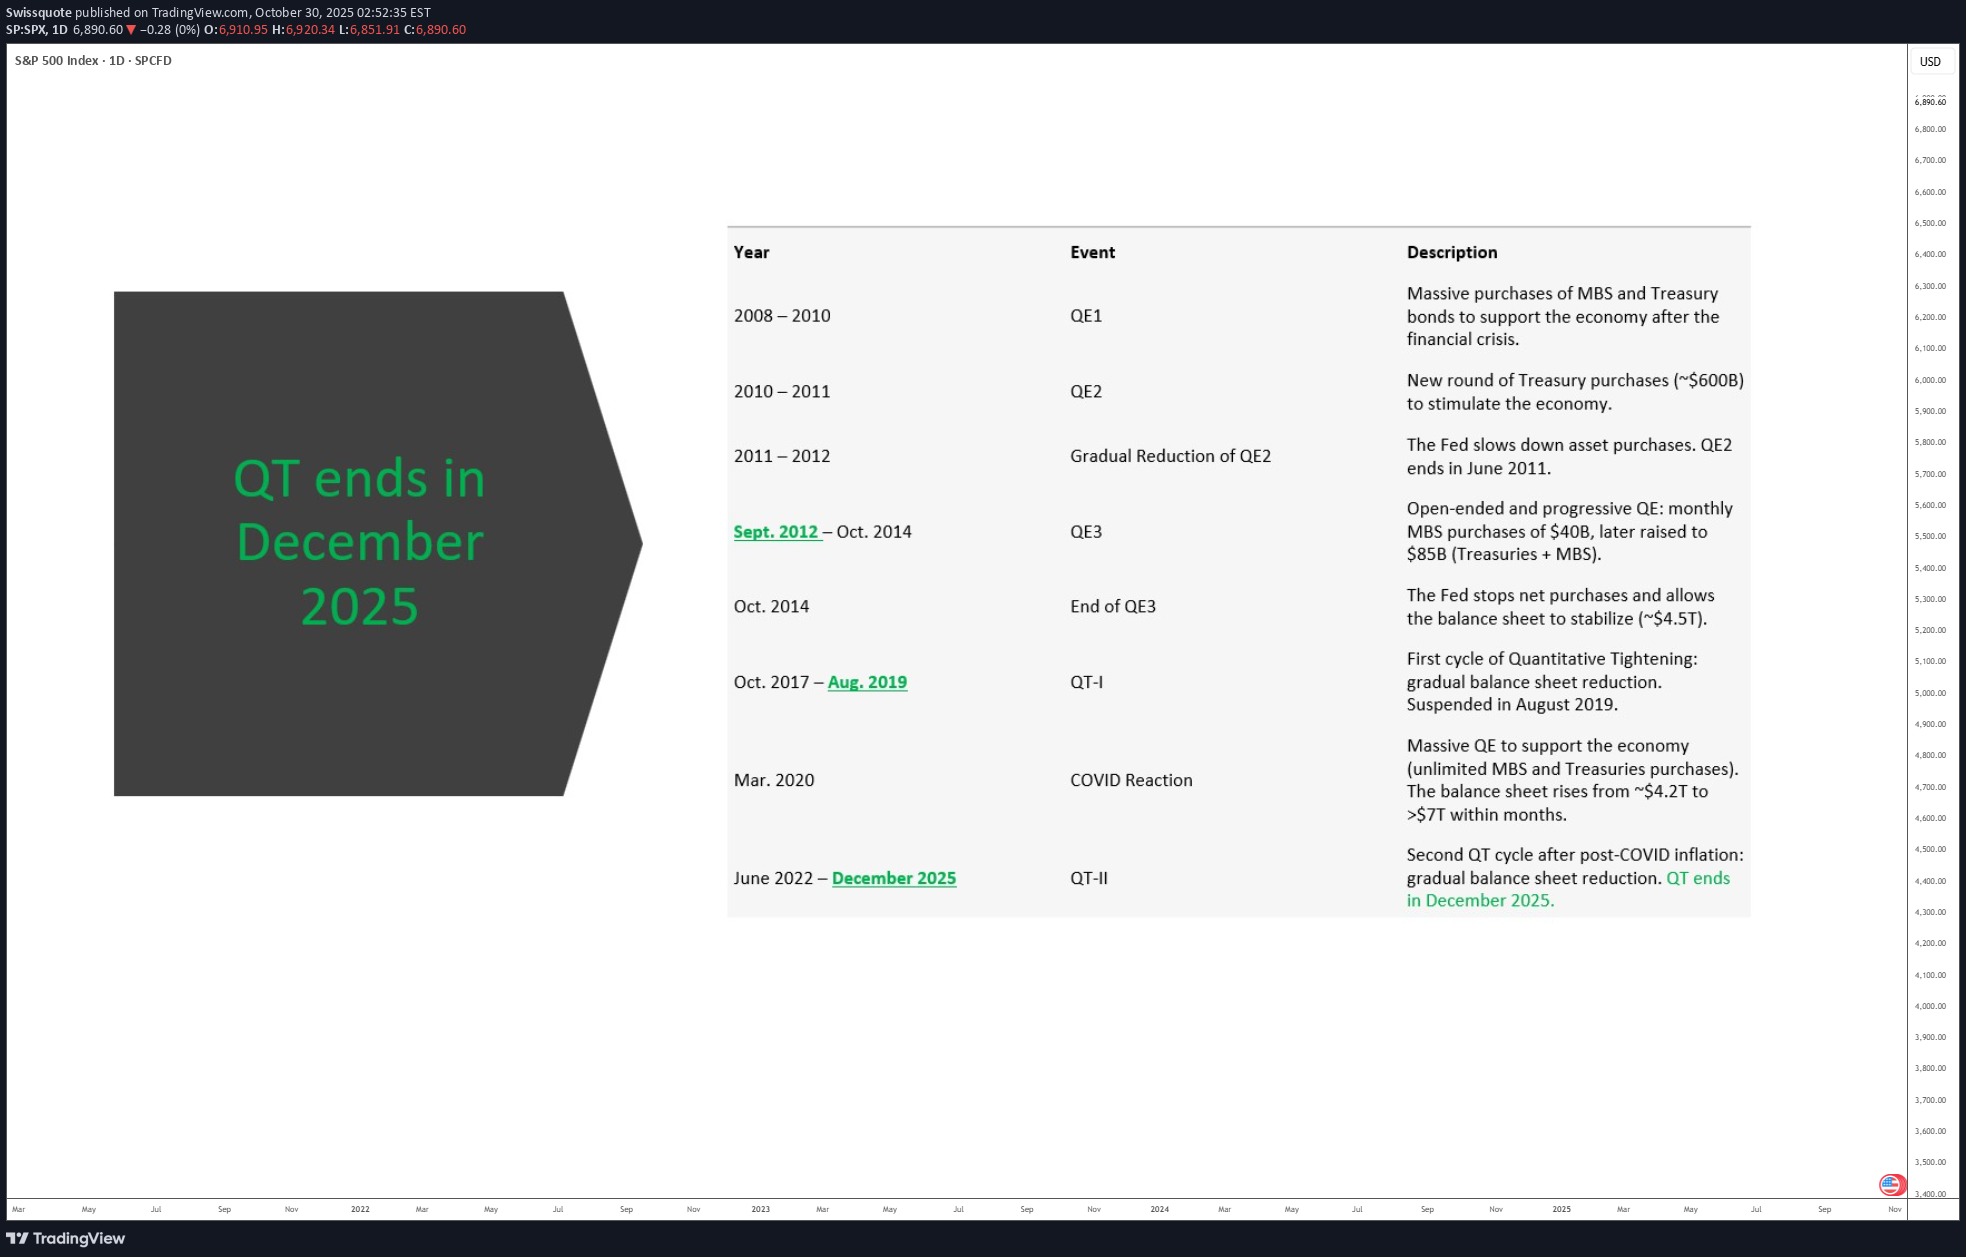
Driven by an euphoric phase, the S&P 500 has approached 7,000 points, nearing its 2000 valuation record, with six consecutive months of gains without retracement. The key question for investors is now clear: has the Federal Reserve provided enough justification for this confidence, or does Jerome Powell’s caution mark the beginning of the end of this euphoric phase? 1) A Fed slowing the pace without complacency On Wednesday, October 29, the Fed announced another 25-basis-point rate cut, bringing the federal funds rate into the 3.75%–4.00% range. This is the second consecutive reduction, aimed at countering the labor market slowdown. However, the FOMC vote revealed strong internal divisions: one member wanted a deeper cut, another preferred no change. This reflects the delicate balance between supporting employment and avoiding renewed inflationary pressure. Another key signal: the Fed decided to pause its balance sheet reduction (quantitative tightening) starting December 1st, in order to preserve financial system liquidity, as credit markets show early signs of stress. Powell clarified that this pause does not imply a lasting return to an expansionary stance. Finally, Powell cooled expectations for another rate cut in December, stating that “nothing is guaranteed.” Money markets now price roughly a 70% chance of a hold in December, down from nearly 90% odds of a cut before the meeting. 2) Between monetary realism and market excess The Fed is not ruling out further easing, but it refuses to fuel a bullish rally in the S&P 500 that is now considered excessive relative to fundamentals. Current valuations rely heavily on expectations of continued rate cuts. If that narrative weakens, the likelihood of a technical correction in the S&P 500 rises. At this stage, however, the index has not yet signaled a reversal. DISCLAIMER: This content is intended for individuals who are familiar with financial markets and instruments and is for information purposes only. The presented idea (including market commentary, market data and observations) is not a work product of any research department of Swissquote or its affiliates. This material is intended to highlight market action and does not constitute investment, legal or tax advice. If you are a retail investor or lack experience in trading complex financial products, it is advisable to seek professional advice from licensed advisor before making any financial decisions. This content is not intended to manipulate the market or encourage any specific financial behavior. Swissquote makes no representation or warranty as to the quality, completeness, accuracy, comprehensiveness or non-infringement of such content. The views expressed are those of the consultant and are provided for educational purposes only. Any information provided relating to a product or market should not be construed as recommending an investment strategy or transaction. Past performance is not a guarantee of future results. Swissquote and its employees and representatives shall in no event be held liable for any damages or losses arising directly or indirectly from decisions made on the basis of this content. The use of any third-party brands or trademarks is for information only and does not imply endorsement by Swissquote, or that the trademark owner has authorised Swissquote to promote its products or services. Swissquote is the marketing brand for the activities of Swissquote Bank Ltd (Switzerland) regulated by FINMA, Swissquote Capital Markets Limited regulated by CySEC (Cyprus), Swissquote Bank Europe SA (Luxembourg) regulated by the CSSF, Swissquote Ltd (UK) regulated by the FCA, Swissquote Financial Services (Malta) Ltd regulated by the Malta Financial Services Authority, Swissquote MEA Ltd. (UAE) regulated by the Dubai Financial Services Authority, Swissquote Pte Ltd (Singapore) regulated by the Monetary Authority of Singapore, Swissquote Asia Limited (Hong Kong) licensed by the Hong Kong Securities and Futures Commission (SFC) and Swissquote South Africa (Pty) Ltd supervised by the FSCA. Products and services of Swissquote are only intended for those permitted to receive them under local law. All investments carry a degree of risk. The risk of loss in trading or holding financial instruments can be substantial. The value of financial instruments, including but not limited to stocks, bonds, cryptocurrencies, and other assets, can fluctuate both upwards and downwards. There is a significant risk of financial loss when buying, selling, holding, staking, or investing in these instruments. SQBE makes no recommendations regarding any specific investment, transaction, or the use of any particular investment strategy. CFDs are complex instruments and come with a high risk of losing money rapidly due to leverage. The vast majority of retail client accounts suffer capital losses when trading in CFDs. You should consider whether you understand how CFDs work and whether you can afford to take the high risk of losing your money. Digital Assets are unregulated in most countries and consumer protection rules may not apply. As highly volatile speculative investments, Digital Assets are not suitable for investors without a high-risk tolerance. Make sure you understand each Digital Asset before you trade. Cryptocurrencies are not considered legal tender in some jurisdictions and are subject to regulatory uncertainties. The use of Internet-based systems can involve high risks, including, but not limited to, fraud, cyber-attacks, network and communication failures, as well as identity theft and phishing attacks related to crypto-assets.
Disclaimer
Any content and materials included in Sahmeto's website and official communication channels are a compilation of personal opinions and analyses and are not binding. They do not constitute any recommendation for buying, selling, entering or exiting the stock market and cryptocurrency market. Also, all news and analyses included in the website and channels are merely republished information from official and unofficial domestic and foreign sources, and it is obvious that users of the said content are responsible for following up and ensuring the authenticity and accuracy of the materials. Therefore, while disclaiming responsibility, it is declared that the responsibility for any decision-making, action, and potential profit and loss in the capital market and cryptocurrency market lies with the trader.