
The_STA
@t_The_STA

What symbols does the trader recommend buying?
Purchase History
پیام های تریدر
Filter
The_STA
استراتژی معاملاتی ساده: فقط با یک خط میانگین متحرک سود کنید!
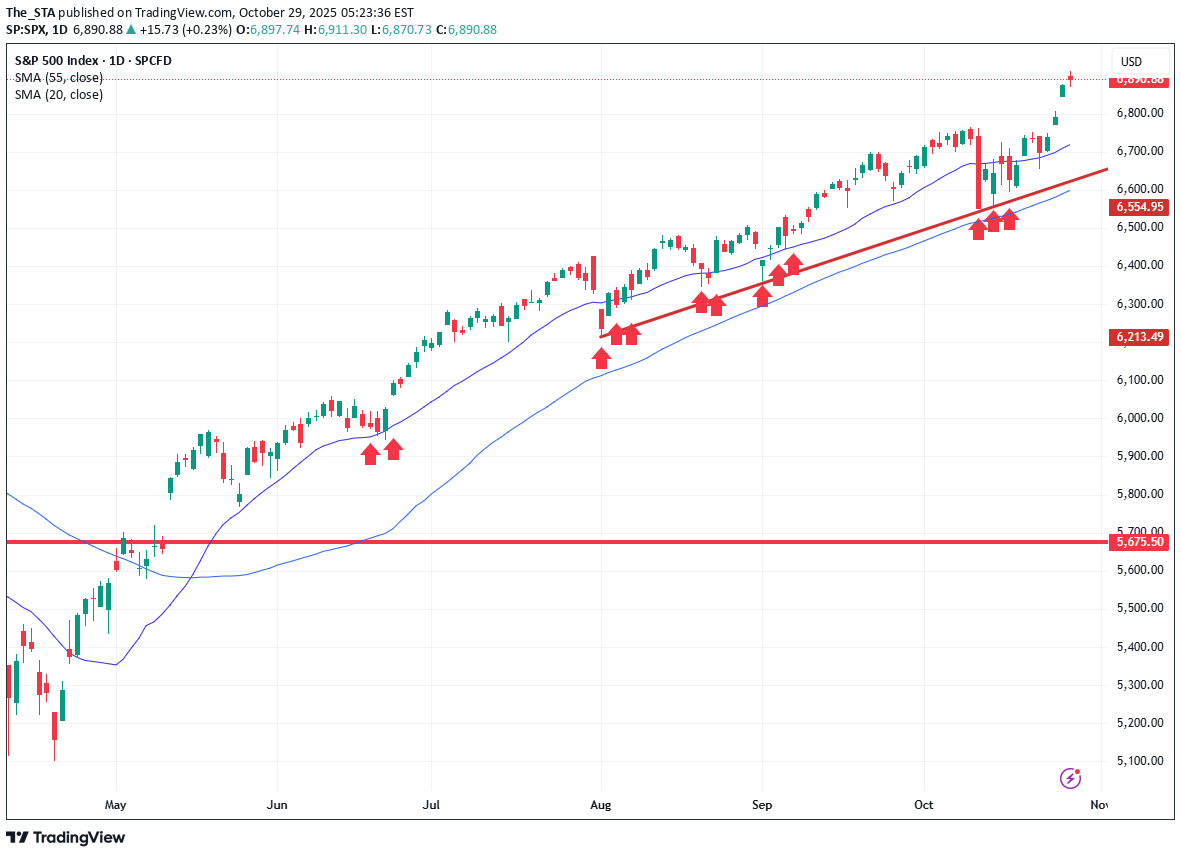
You don’t need a dozen indicators to build a solid strategy—sometimes, observation is enough. Here’s a simple setup I’ve applied to the S&P daily chart: 🔹 Use the 20-day MA to buy dips 🔹 Place stops below the 55-day MA Why? The 55-day MA has consistently supported the uptrend since May. This approach has offered multiple entry points, with stops trailing higher each time. It’s not trading advice—just a clean, repeatable structure that’s still working well. Disclaimer: The information posted on Trading View is for informative purposes and is not intended to constitute advice in any form, including but not limited to investment, accounting, tax, legal or regulatory advice. The information therefore has no regard to the specific investment objectives, financial situation or particular needs of any specific recipient. Opinions expressed are our current opinions as of the date appearing on Trading View only. All illustrations, forecasts or hypothetical data are for illustrative purposes only. The Society of Technical Analysts Ltd does not make representation that the information provided is appropriate for use in all jurisdictions or by all Investors or other potential Investors. Parties are therefore responsible for compliance with applicable local laws and regulations. The Society of Technical Analysts will not be held liable for any loss or damage resulting directly or indirectly from the use of any information on this site.
The_STA
آیا صعود بازار در حال فروپاشی است؟ نشانههای خستگی در شاخصها!
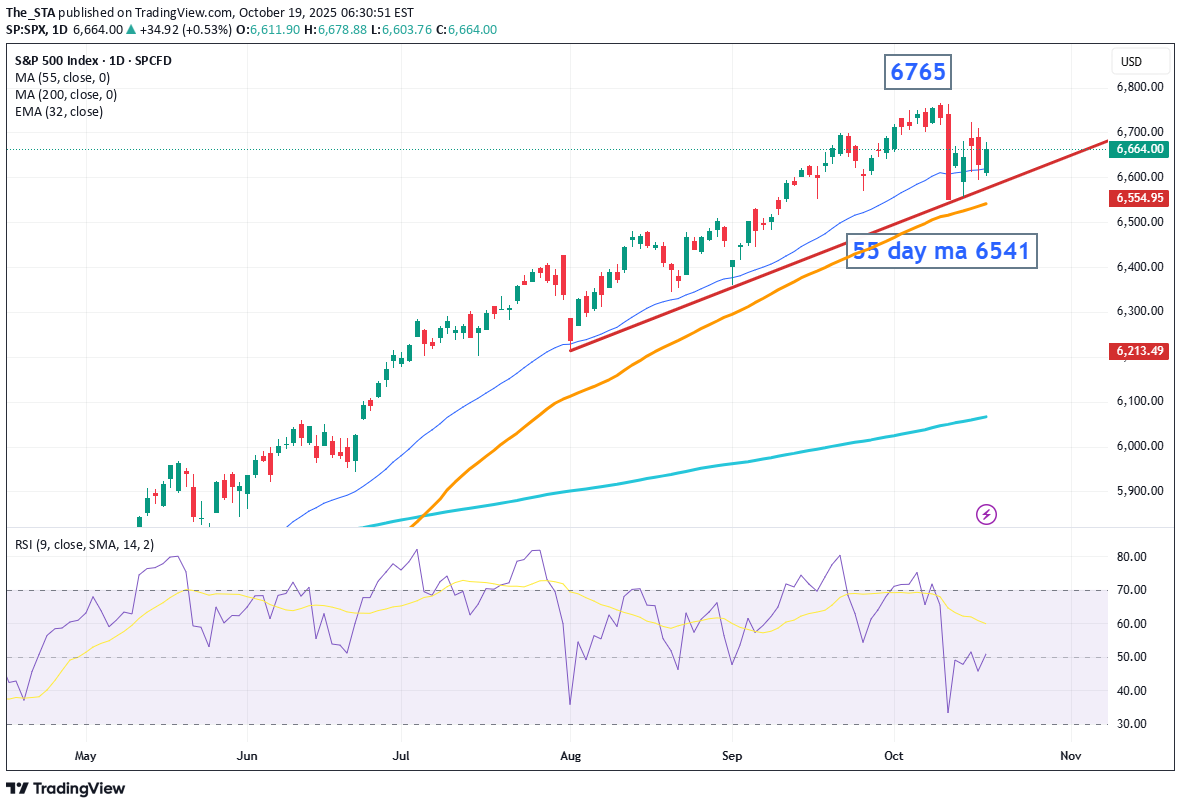
We kick off the week with the S&P still riding its two-month uptrend, supported by the 55-day MA at 6541. But signs of fatigue are emerging. 📉 Amazon is slipping below its 200-day MA 📊 NVIDIA’s recent high at 195.62 hovers near the 197 Fibonacci extension and the 200 psychological level Technically, the uptrend holds—and if 6765 the recent high breaks, the bull may charge on. If the 55-day MA erodes, brace for a correction. 🔍 Keep chart levels in focus 📌 Tighten stops ⚠️ Not investment advice #TechnicalAnalysis #SP500 #Amazon #NVIDIA #MarketUpdate #TradingStrategy #RiskManagement #Fibonacci #BullMarket #ChartWatch #FinanceTwitter #LinkedInFinance
The_STA
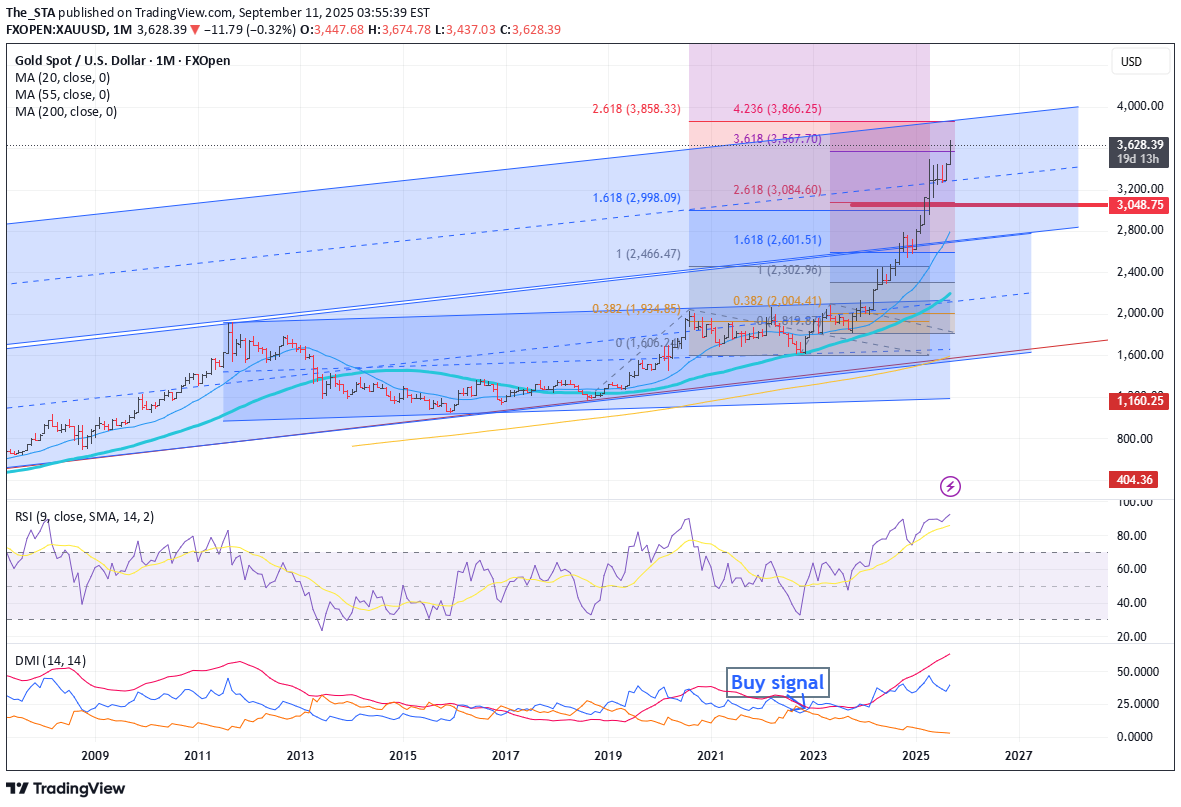
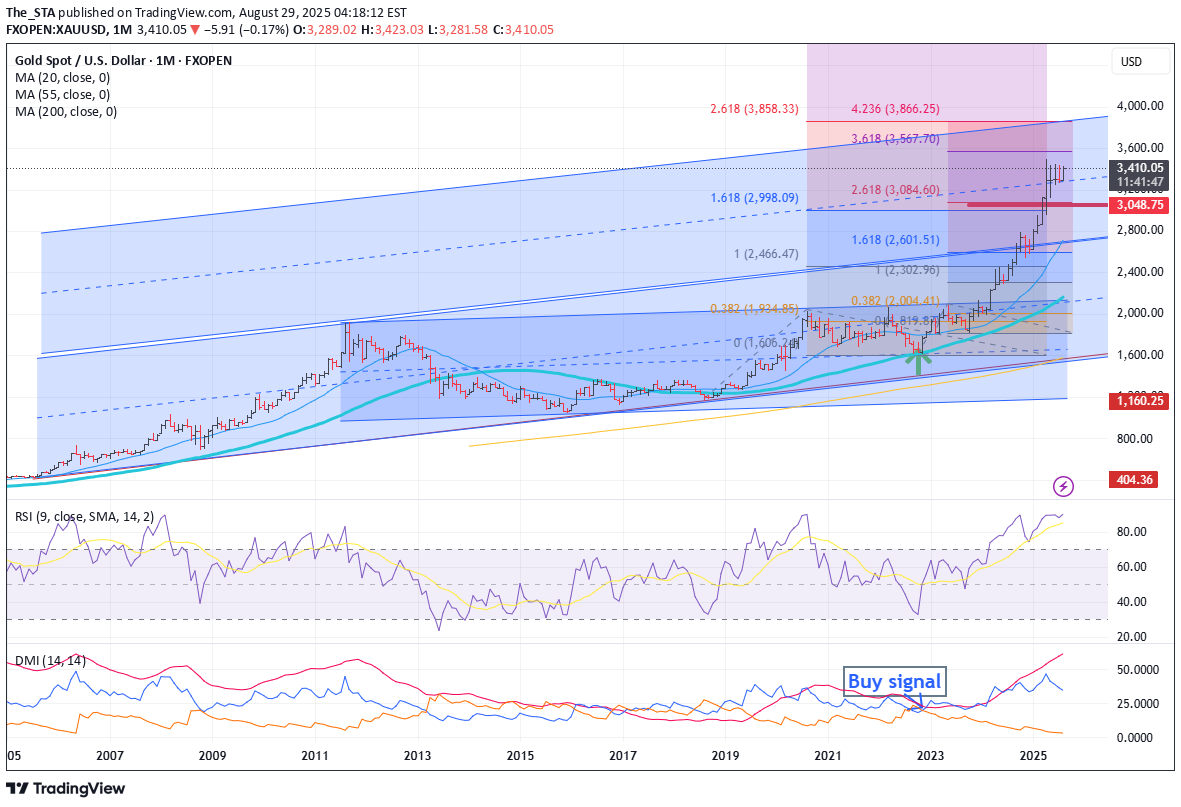
Quick gold update: things are starting to look a little tired up here. The daily RSI is beginning to roll over, which raises the question—if you're already long, where do you place your stop when nearby support levels are miles away? Personally, I drop down to a shorter time frame like the 4-hour chart and look for what’s consistently held. Since late August, the red baseline on the Ichimoku cloud has done a solid job of supporting the uptrend. If you're after a tighter stop, placing it just below that baseline—around 3,610—could be a reasonable option. Want to give it more breathing room? Then the lower edge of the cloud might be your spot. Either way, it’s time to think about locking in profits. On the monthly chart, our long-term target for gold still sits around 3,850–3,870, where several upside projections and Fibonacci extensions converge. That’s a chunky resistance zone. Also worth noting: the monthly RSI is now at 92. That’s pretty stretched. So if you haven’t already, consider tightening those stops. Disclaimer: The information posted on Trading View is for informative purposes and is not intended to constitute advice in any form, including but not limited to investment, accounting, tax, legal or regulatory advice. The information therefore has no regard to the specific investment objectives, financial situation or particular needs of any specific recipient. Opinions expressed are our current opinions as of the date appearing on Trading View only. All illustrations, forecasts or hypothetical data are for illustrative purposes only. The Society of Technical Analysts Ltd does not make representation that the information provided is appropriate for use in all jurisdictions or by all Investors or other potential Investors. Parties are therefore responsible for compliance with applicable local laws and regulations. The Society of Technical Analysts will not be held liable for any loss or damage resulting directly or indirectly from the use of any information on this site.
The_STA
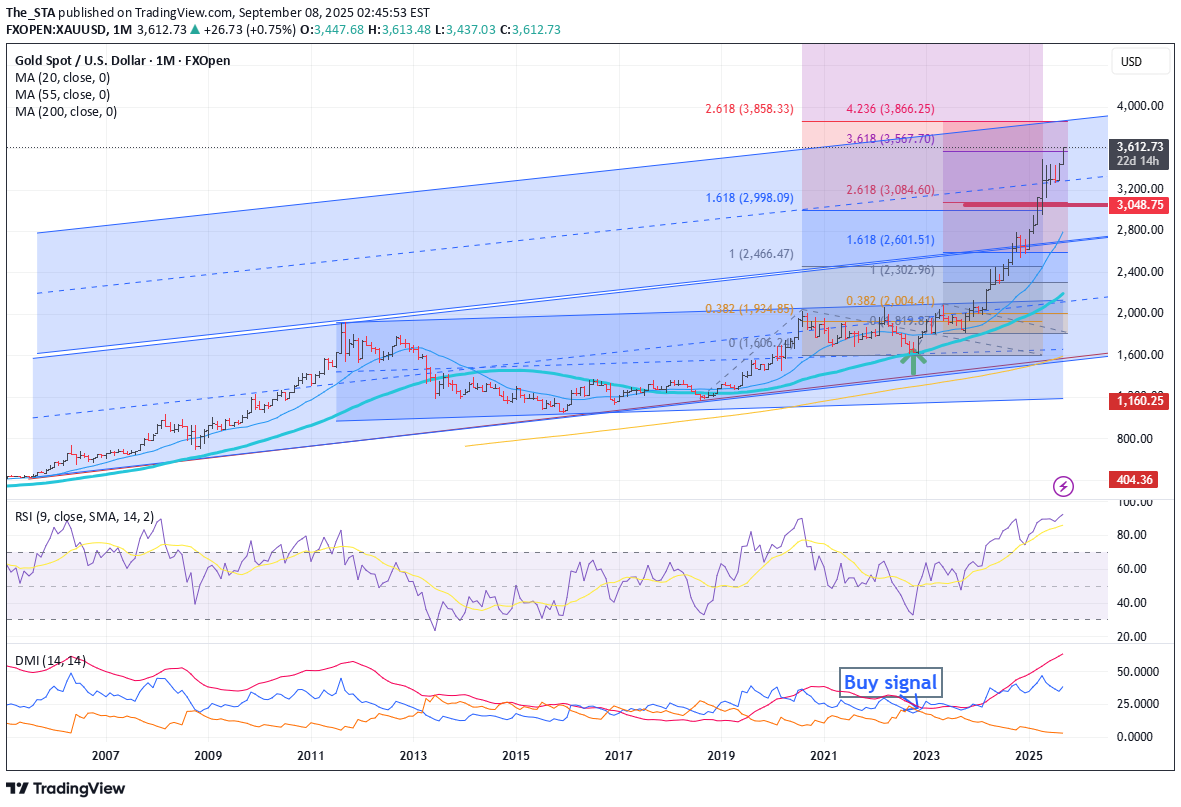
We flagged this breakout before it happened, thanks to rising reaction lows within the range. Now that gold’s pushed through resistance, the question is: where do you manage your risk? 🔍 I drop down to the 4-hour chart and use the Ichimoku cloud for clarity. We have support currently around 3,540 — and offers a solid stop placement. ✨ Watch for this classic cloud signal: → Leading line breaks above the cloud → Price follows through above the cloud That’s often your cue a move higher is underway. 🎯 Upside targets remain: → 3,860 → 3,900 Both align with range projections and Fibonacci extensions. Disclaimer: The information posted on Trading View is for informative purposes and is not intended to constitute advice in any form, including but not limited to investment, accounting, tax, legal or regulatory advice. The information therefore has no regard to the specific investment objectives, financial situation or particular needs of any specific recipient. Opinions expressed are our current opinions as of the date appearing on Trading View only. All illustrations, forecasts or hypothetical data are for illustrative purposes only. The Society of Technical Analysts Ltd does not make representation that the information provided is appropriate for use in all jurisdictions or by all Investors or other potential Investors. Parties are therefore responsible for compliance with applicable local laws and regulations. The Society of Technical Analysts will not be held liable for any loss or damage resulting directly or indirectly from the use of any information on this site.
The_STA
A triple divergence on the daily RSI is a technical analysis signal that happens when the Relative Strength Index (RSI) and the price of an asset move in opposite directions three times in a row on the daily chart. Here’s the breakdown: ________________________________________ 🔑 Divergence Basics •RSI measures momentum (overbought/oversold conditions). •Divergence occurs when the RSI and price action "disagree": oBearish divergence: Price makes higher highs, but RSI makes lower highs → momentum is weakening even as price climbs. oBullish divergence: Price makes lower lows, but RSI makes higher lows → momentum is strengthening even as price drops. ________________________________________ ✅ Triple Divergence •A triple divergence means this mismatch happens three distinct times in succession. •It shows a persistent, building contradiction between price and momentum. For example: •Bearish triple divergence: oPrice: Higher high → Higher high → Higher high oRSI: Lower high → Lower high → Lower high ➝ Suggests the uptrend is running on fumes, momentum is fading, and reversal risk is high. •Bullish triple divergence: oPrice: Lower low → Lower low → Lower low oRSI: Higher low → Higher low → Higher low ➝ Suggests sellers are losing steam, and a trend reversal upward may be near. ________________________________________ ⚠️ Why It Matters •Daily timeframe divergences carry more weight than intraday ones because they reflect broader sentiment. •A triple divergence is relatively rare and stronger than a single divergence. •Traders often see it as a warning of a major reversal or at least a significant correction ahead. Disclaimer: The information posted on Trading View is for informative purposes and is not intended to constitute advice in any form, including but not limited to investment, accounting, tax, legal or regulatory advice. The information therefore has no regard to the specific investment objectives, financial situation or particular needs of any specific recipient. Opinions expressed are our current opinions as of the date appearing on Trading View only. All illustrations, forecasts or hypothetical data are for illustrative purposes only. The Society of Technical Analysts Ltd does not make representation that the information provided is appropriate for use in all jurisdictions or by all Investors or other potential Investors. Parties are therefore responsible for compliance with applicable local laws and regulations. The Society of Technical Analysts will not be held liable for any loss or damage resulting directly or indirectly from the use of any information on this site.
The_STA
Hey there! My name is Karen Jones, content creator for the Society of Technical Analysts. Today, we’re looking at the gold market. At first glance, the chart looks sideways and uneventful since April. But on closer inspection, each recent reaction low has been higher than the previous one (June < July < August). 👉 Why does this matter? It suggests upside pressure is building within the range, pointing toward a potential breakout. 🔑 Key resistance levels to watch: •First hurdle: 3443–3450 •Major breakout: April high near 3500 If these levels clear, we view this as a bullish continuation pattern, opening the door for further upside. Longer-term projections using Fibonacci extensions and historical ranges suggest targets around 3860–3900. ⚠️ This is not investment advice. For educational purposes only.
The_STA

On the weekly chart, Amazon looks like it’s starting to tire a bit. Price is struggling just under that January high near 24,252. Looking at the Ichimoku Cloud: •In mid-2023, price broke strongly above the cloud and bounced cleanly higher after retests. •More recently (spring 2025), we had a decent correction but bounced again. •Now, instead of bouncing hard, price is just sitting on top of the cloud — feels weaker than before. On the daily chart: •The 200-day moving average has been a line in the sand since May. Several successful tests and bounces. •Currently, price is hugging the daily cloud. •If we see erosion near 219–220(top of the cloud), a quick dip back to the 200-day MA (~21,280) is very possible. •A close below that could signal a potential top forming. ⚠️ For me, this uptrend feels a little tired — worth keeping an eye on and possibly tightening stops if you’re in the trade. Disclaimer: The information posted on Trading View is for informative purposes and is not intended to constitute advice in any form, including but not limited to investment, accounting, tax, legal or regulatory advice. The information therefore has no regard to the specific investment objectives, financial situation or particular needs of any specific recipient. Opinions expressed are our current opinions as of the date appearing on Trading View only. All illustrations, forecasts or hypothetical data are for illustrative purposes only. The Society of Technical Analysts Ltd does not make representation that the information provided is appropriate for use in all jurisdictions or by all Investors or other potential Investors. Parties are therefore responsible for compliance with applicable local laws and regulations. The Society of Technical Analysts will not be held liable for any loss or damage resulting directly or indirectly from the use of any information on this site.
The_STA
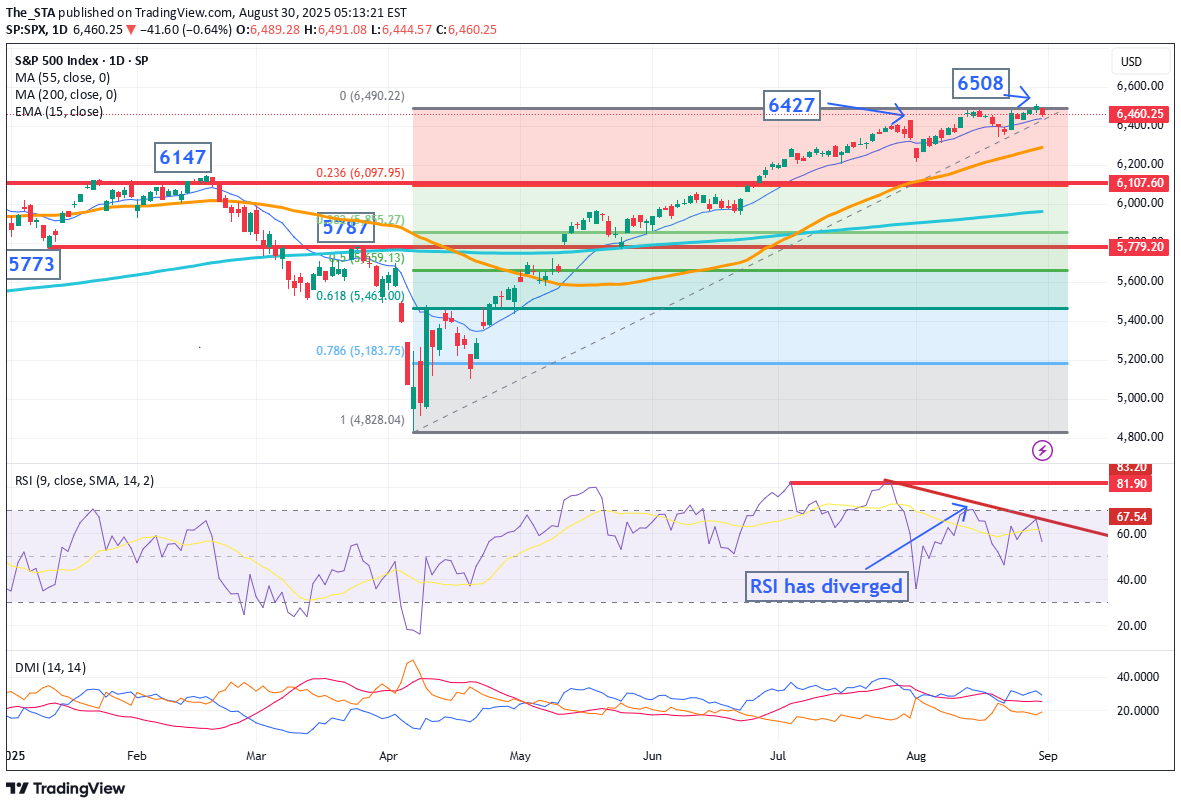
Although the S&P remains in an uptrend, recent price action suggests that momentum may be fading. 📉 Key Observations: A Key Day Reversal occurred at 6409 – a potential warning signal. We're seeing RSI divergence: price made a new high, but RSI didn’t follow suit. The market is grinding higher, but without conviction. 📊 What to Watch: The 15-day EMA, currently at 6317, is acting as near-term support. A close below this level could trigger a short-term correction. Initial downside targets: 6147–6100, the previous highs from late 2024 and early 2025. ✅ To negate this bearish bias, the market would need to break above 6409 and continue higher with stronger momentum. Stay alert — the technicals are flashing red flags. Always manage risk accordingly. Disclaimer: The information posted on Trading View is for informative purposes and is not intended to constitute advice in any form, including but not limited to investment, accounting, tax, legal or regulatory advice. The information therefore has no regard to the specific investment objectives, financial situation or particular needs of any specific recipient. Opinions expressed are our current opinions as of the date appearing on Trading View only. All illustrations, forecasts or hypothetical data are for illustrative purposes only. The Society of Technical Analysts Ltd does not make representation that the information provided is appropriate for use in all jurisdictions or by all Investors or other potential Investors. Parties are therefore responsible for compliance with applicable local laws and regulations. The Society of Technical Analysts will not be held liable for any loss or damage resulting directly or indirectly from the use of any information on this site.
The_STA
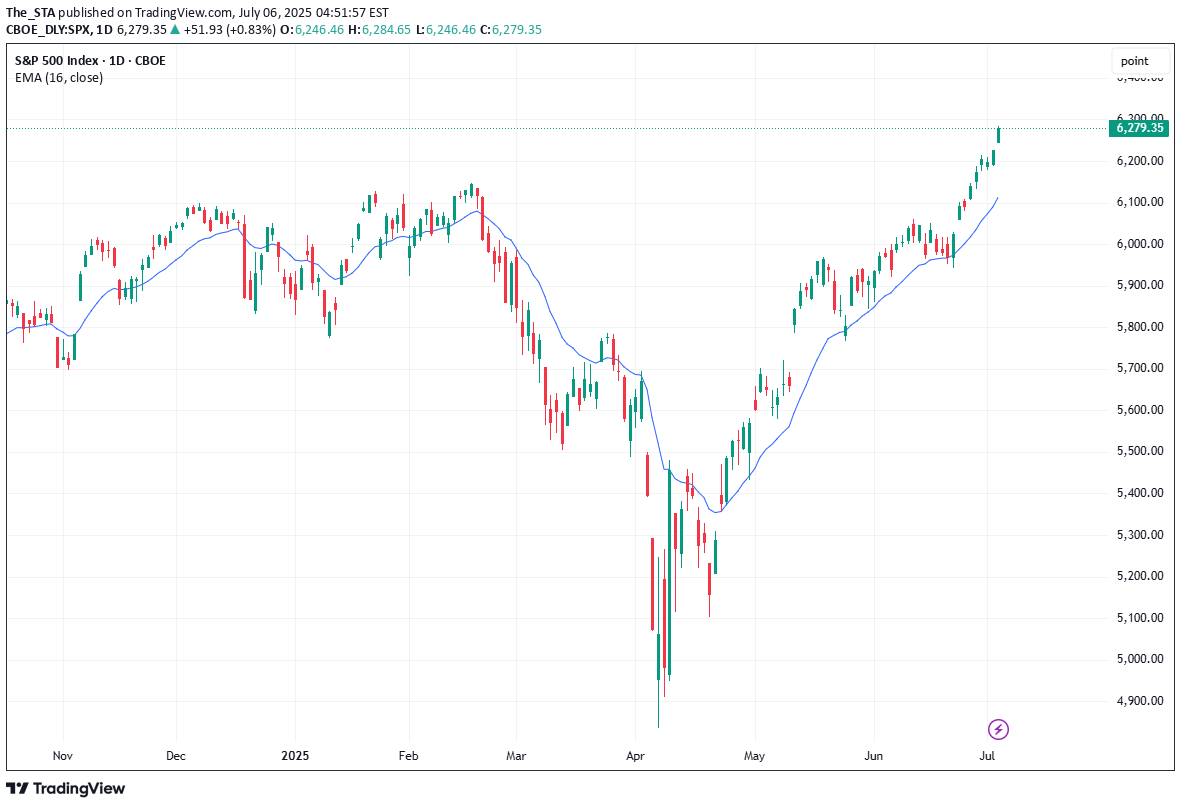
Technical analysis is not your decision-making process — it’s a tool to help you structure better trading decisions by studying past price movements to anticipate likely future moves. 👉 Every time you look at a chart, you should decide: ✅ Do I want to trade at all? ✅ What’s my entry? ✅ Where’s my stop (when does my thesis fail)? ✅ What’s my target (where will I take profits)? ________________________________________ 🛑 Where to put your stop? Take the S&P 500 daily chart. It’s been trending up strongly. Many traders use an exponential moving average (EMA) as a dynamic stop. But: •A 9 EMA often stops you out too early on strong trends. •Adjusting to a 15 or 16 EMA could keep you in the trade longer, letting your winners run. In tools like TradingView, you can visually adjust the EMA and see in real time how it would have kept you in or taken you out. ________________________________________ 💡 Key takeaway: When price closes below your EMA stop — that’s your signal to exit and lock in profits. Use TA to structure your trades, not just spot pretty patterns. ________________________________________ 💬 What’s your favourite method for setting stops? Disclaimer: The information posted on Trading View is for informative purposes and is not intended to constitute advice in any form, including but not limited to investment, accounting, tax, legal or regulatory advice. The information therefore has no regard to the specific investment objectives, financial situation or particular needs of any specific recipient. Opinions expressed are our current opinions as of the date appearing on Trading View only. All illustrations, forecasts or hypothetical data are for illustrative purposes only. The Society of Technical Analysts Ltd does not make representation that the information provided is appropriate for use in all jurisdictions or by all Investors or other potential Investors. Parties are therefore responsible for compliance with applicable local laws and regulations. The Society of Technical Analysts will not be held liable for any loss or damage resulting directly or indirectly from the use of any information on this site.
The_STA
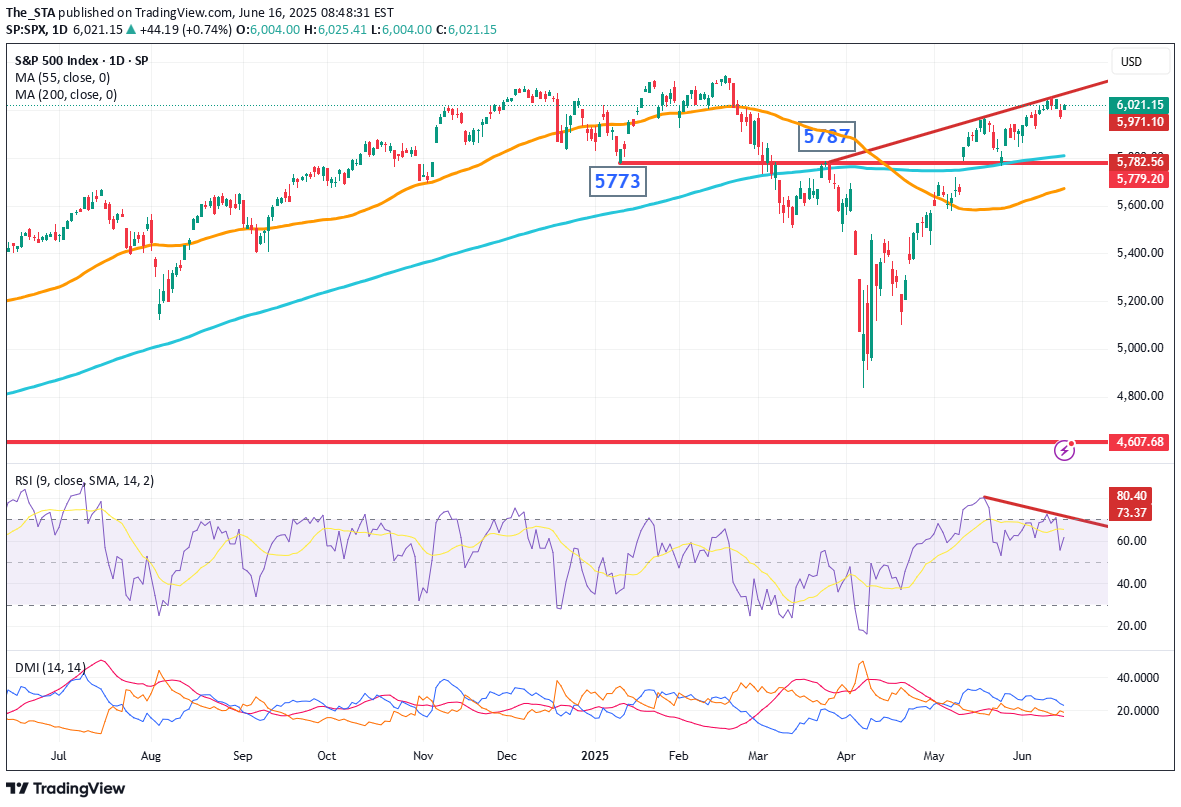
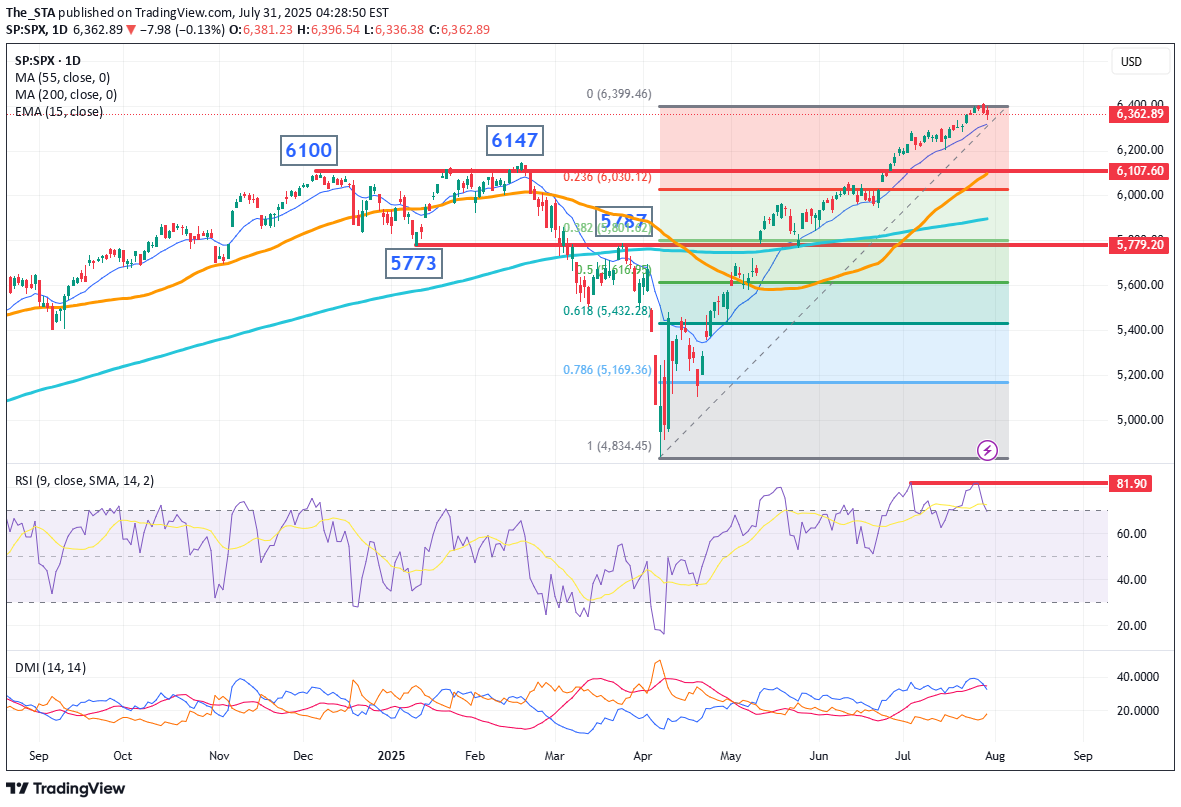
U.S. stock index futures rose Monday, buoyed by easing oil prices, even as geopolitical tensions between Israel and Iran simmer in the background. All eyes are now on the upcoming Federal Reserve meeting. 👀💼 But here’s the catch on the S&P 500 👇 🔹 Price is stalling at a resistance line, tracing back to March highs 🔹 Daily RSI shows major divergence, signalling a loss of momentum 🔹 Rally is slowing just as it approaches the Feb all-time high at 6147 📉 If the index fails to hold and breaks below: 🔻 The 200-day MA at 5808 🔻 Key pivot levels at 5773 (Jan low) and 5787 (March peak) …then we could see real downside pressure emerge. 🛑 For now, the market is showing red flags at a critical level. Stay alert — this could get interesting. Disclaimer: The information posted on Trading View is for informative purposes and is not intended to constitute advice in any form, including but not limited to investment, accounting, tax, legal or regulatory advice. The information therefore has no regard to the specific investment objectives, financial situation or particular needs of any specific recipient. Opinions expressed are our current opinions as of the date appearing on Trading View only. All illustrations, forecasts or hypothetical data are for illustrative purposes only. The Society of Technical Analysts Ltd does not make representation that the information provided is appropriate for use in all jurisdictions or by all Investors or other potential Investors. Parties are therefore responsible for compliance with applicable local laws and regulations. The Society of Technical Analysts will not be held liable for any loss or damage resulting directly or indirectly from the use of any information on this site.
Disclaimer
Any content and materials included in Sahmeto's website and official communication channels are a compilation of personal opinions and analyses and are not binding. They do not constitute any recommendation for buying, selling, entering or exiting the stock market and cryptocurrency market. Also, all news and analyses included in the website and channels are merely republished information from official and unofficial domestic and foreign sources, and it is obvious that users of the said content are responsible for following up and ensuring the authenticity and accuracy of the materials. Therefore, while disclaiming responsibility, it is declared that the responsibility for any decision-making, action, and potential profit and loss in the capital market and cryptocurrency market lies with the trader.