
SPELL
Spell Token
| تریدر | نوع سیگنال | حد سود/ضرر | زمان انتشار | مشاهده پیام |
|---|---|---|---|---|
 FortuneAIRank: 3359 | خرید | حد سود: تعیین نشده حد ضرر: تعیین نشده | 12/6/2025 |
Price Chart of Spell Token
سود 3 Months :
سیگنالهای Spell Token
Filter
Sort messages by
Trader Type
Time Frame
FortuneAI
سیگنال قوی صعودی: آیا زمان معکوس شدن روند در اسپِل فرا رسیده است؟
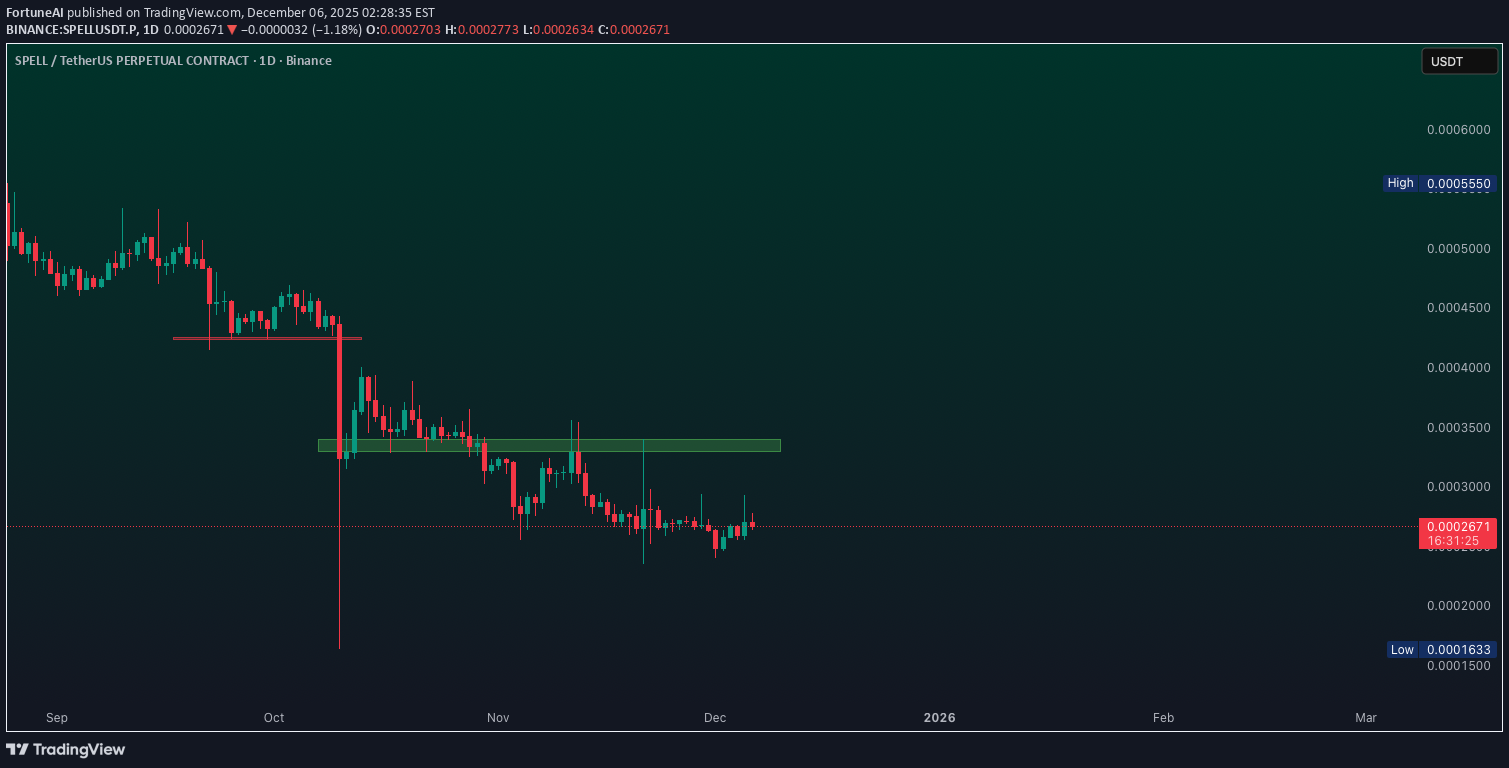
SPELL Technicals look very bullish here for a good reversal. Use Proper Risk Management.

asilturk
آیا SPELL آماده جهش بزرگ است؟ پیشبینی صعودی و نکات مهم سرمایهگذاری
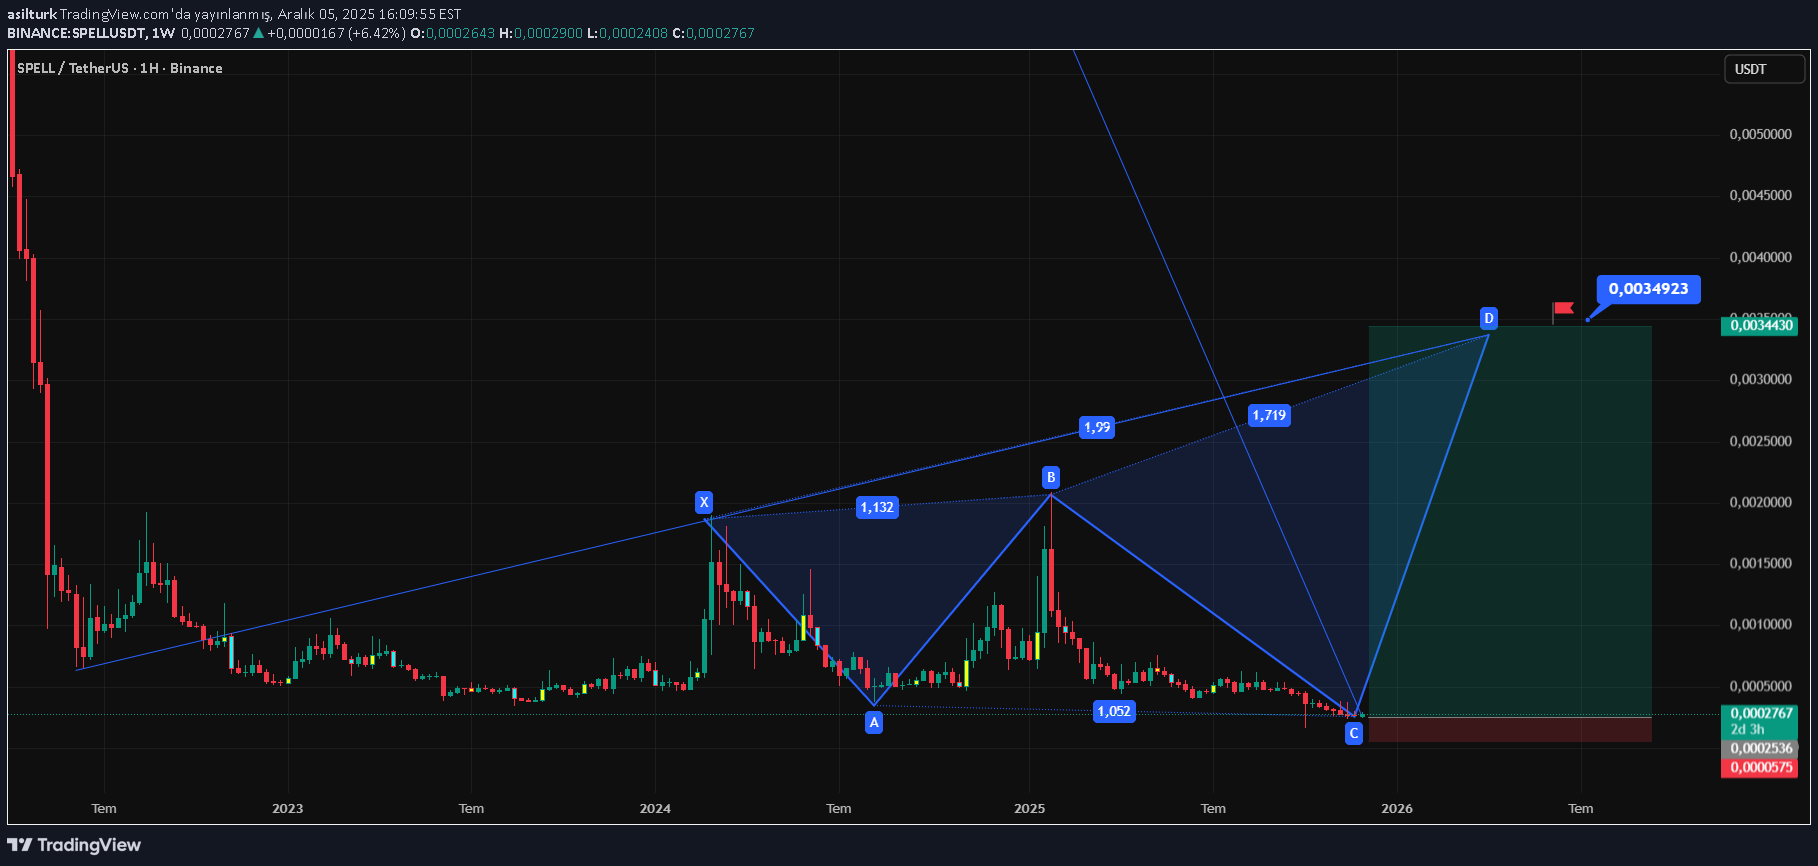
SPELL is the native cryptocurrency of the Abracadabra.money platform, which operates primarily in the field of decentralized finance (DeFi). Currently, there is a giant triangle formation on the chart with a price of 0.00027 cents. In fact, it cannot be called a formation, it is just a chart that has been falling for many years. No sequential targets SPELL is not only a cryptocurrency, but also a key that provides access to the governance and revenue sharing of the Abracadabra DeFi protocol. Its value largely depends on the success of the MIM stablecoin and how well the protocol manages liquidity and collateral risks. We just follow the money trail according to the chart. A low volume but a strong trend can be expected. SPELL tokens can be invested in the medium and long term. However, harsh movements may occur in the short term. It is necessary to be careful. I wish you good luck.

CryptoNuclear
آیا طلسم (SPELL) در آستانه انفجار صعودی است؟ تحلیل الگوی گُوِه نزولی
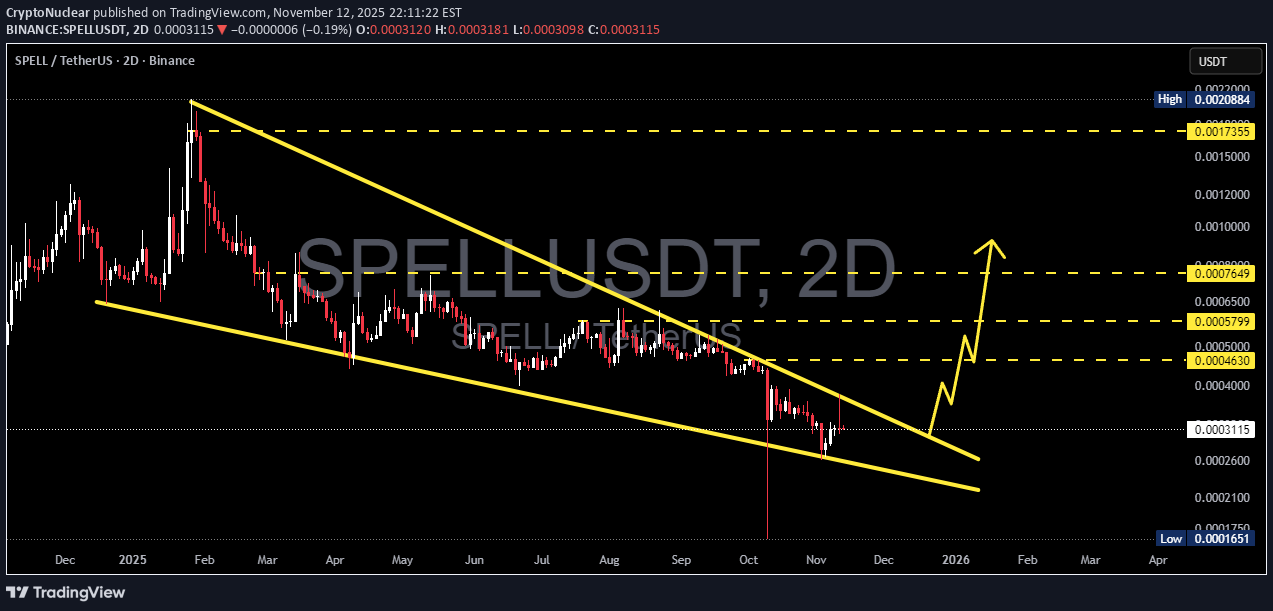
The SPELL/USDT (2D – Binance) pair is currently forming a large Falling Wedge pattern, a classic technical formation that often signals the end of a prolonged downtrend and the potential beginning of a bullish reversal. Since the early-year peak, SPELL has been locked inside a downward-sloping channel, consistently printing lower highs and lower lows. However, each drop toward the wedge’s lower boundary has triggered buying reactions, hinting that accumulation may be taking place quietly among strong hands. Now, as price moves closer to the apex of the wedge, volatility is compressing — setting the stage for a decisive breakout or breakdown. This is the make-or-break zone for SPELL. --- Pattern & Key Levels 🔹 Main pattern: Falling Wedge (potential bullish reversal setup). 🔹 Current price: Around 0.0003138 USDT. 🔹 Critical support: Lower wedge boundary and the historical low at 0.0001651 (strong invalidation level). 🔹 Key resistance / breakout targets: 0.0004630 → initial breakout target 0.0005799 → structural shift confirmation 0.0007649 → mid-term target 0.0017355 → extended target if momentum accelerates --- Bullish Scenario 1. Breakout Confirmation: A strong 2D candle close above the descending resistance line with a clear rise in volume would confirm a potential trend reversal. 2. Retest for Validation: After the breakout, a retest of the former resistance (now turned support) could offer a low-risk entry opportunity. 3. Progressive Targets: Target 1: 0.0004630 — first reaction zone Target 2: 0.0005799 → 0.0007649 — continuation targets Extended Target: 0.0017355 — possible in a strong altcoin rally 4. Momentum Confirmation: Sustained volume growth + higher closes above the wedge will reinforce bullish sentiment. --- Bearish Scenario 1. Rejection at Upper Wedge: Price fails to break the upper resistance and faces rejection → potential retest of the lower wedge line. 2. Breakdown Below Support: If SPELL closes below the wedge and loses 0.0001651, it would confirm continuation of the macro downtrend. 3. Downside Targets: Initial support zone between 0.00022 – 0.00018, then down to 0.0001651 if selling pressure intensifies. 4. Bearish Confirmation: Rising sell volume and strong candles below support would indicate distribution and further downside risk. --- Conclusion SPELL has been trapped in a multi-month descending wedge, and now approaches a critical decision point. Historically, such wide wedge formations often precede explosive reversals when breakout confirmation is supported by volume. However, if the price fails to break out and instead closes below support, the bearish continuation remains in play. This is the decisive moment for SPELL: 📈 Breakout → potential trend reversal. 📉 Breakdown → extended bearish continuation. --- Technical Notes Wait for 2D candle confirmation and volume validation before acting on a breakout. Use multi-timeframe confluence (4H + 1D) for better entry confirmation. Apply strict risk management due to SPELL’s volatility and low liquidity nature. --- #SPELL #CryptoAnalysis #Altcoin #TechnicalAnalysis #FallingWedge #BullishSetup #BreakoutWatch #PriceAction #MarketStructure #SwingTrade #CryptoChart #AltcoinReversal

Bithereum_io
تحلیل تکنیکال SPELL: فرصت خرید در کف الگوی گوه نزولی با اهداف بزرگ!

#SPELL is moving inside a falling wedge pattern on the daily chart. Consider buying near the support. In case of a breakout above the pattern resistance and the daily SMA50, the potential targets are: 🎯 $0.0003916 🎯 $0.0004880 🎯 $0.0006182 🎯 $0.0007234 🎯 $0.0008285 🎯 $0.0009783 ⚠️ Always use a tight stop-loss and apply proper risk management.
FortuneAI
تحلیل فنی SPELL: فرصت صعودی بزرگ یا دام ریسک؟
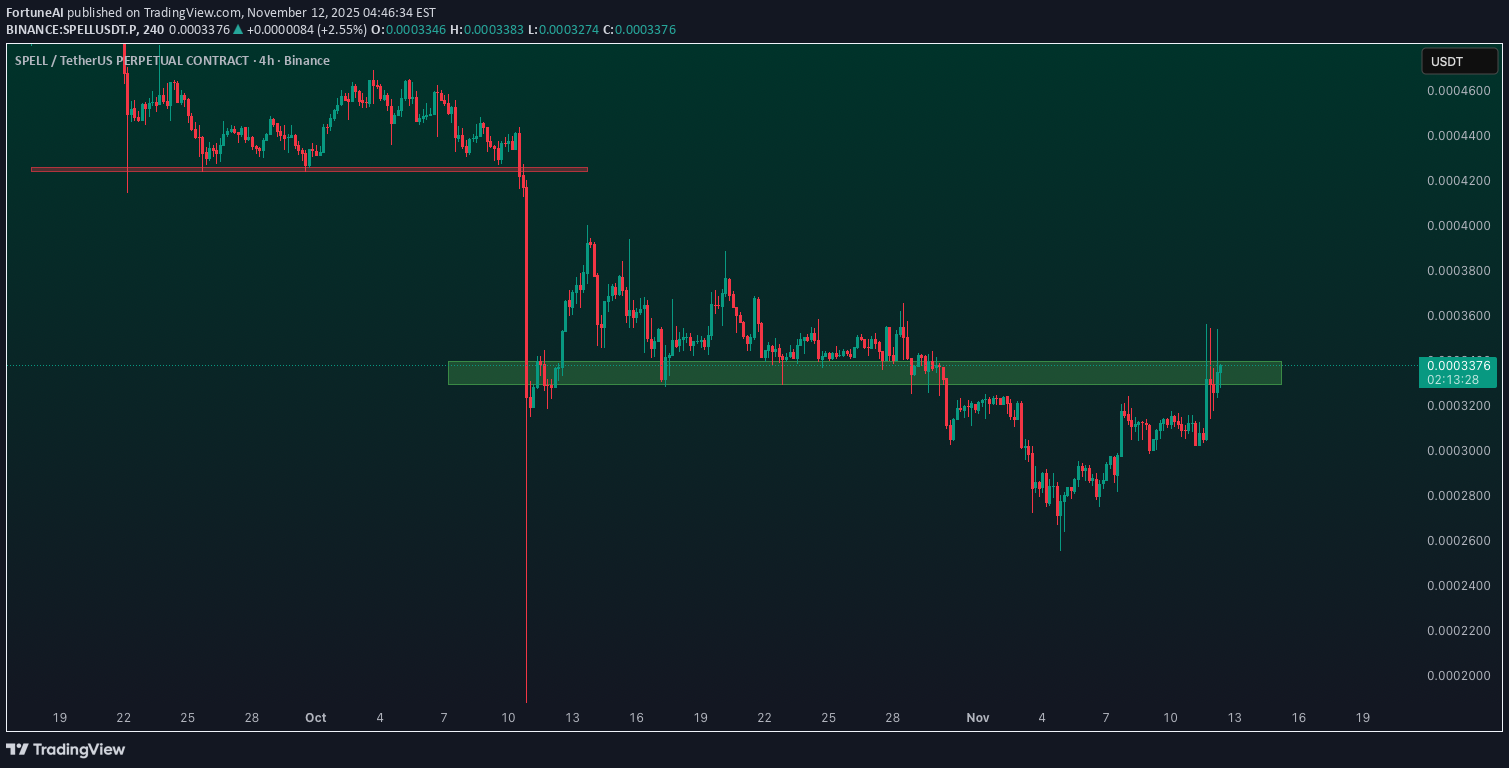
SPELL Technicals look bullish but Trade with proper Risk Management

SatochiTrader
CYCLE UPDATE FOR SPELL/USDT $0,002 2025
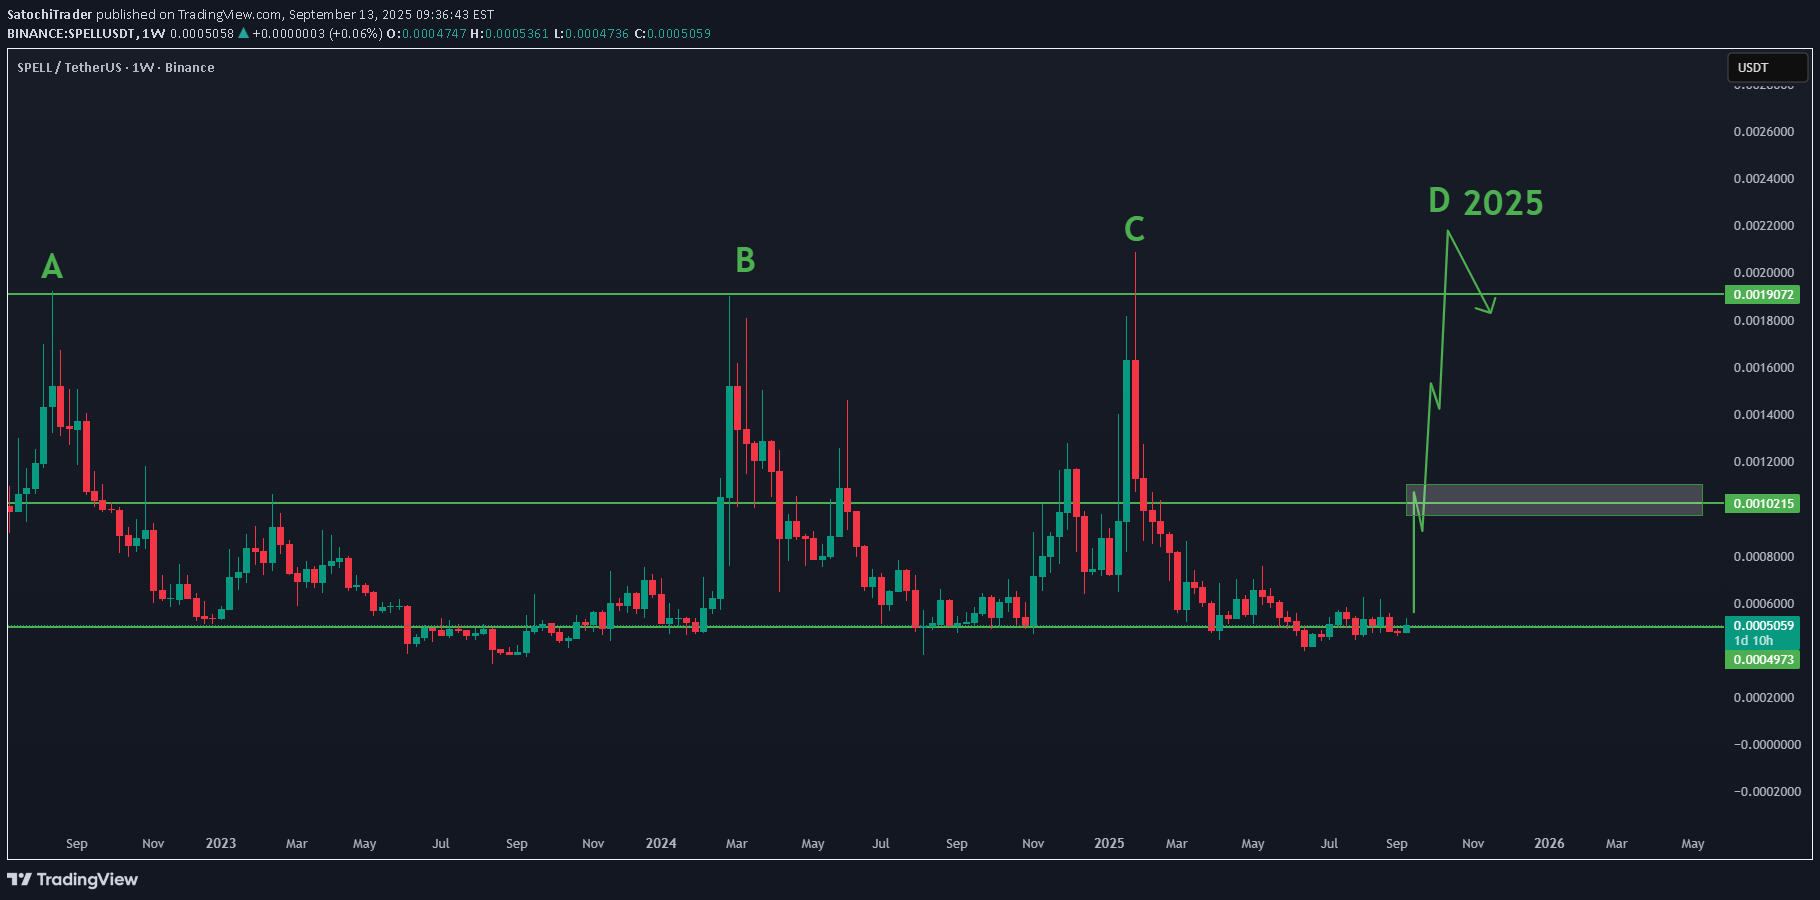
SPELL/USDT – Loading Next Cycle? 🚀 Looking at SPELL on the weekly chart, the structure looks very clear to me. We had big cycle tops before (A → B → C), and every time after a long accumulation, the price came back with a strong pump. Right now, SPELL is sitting at the bottom around 0.0005, a level where it has been building support for a long time. If this cycle repeats, the next big wave (D) could target around 0.002 in 2025. We see here a view that every time it started around the same time. And the last pattern structure shows the same trend as it did before (exactly the same patterns) For the trading update SEP/OCT There is an expectation for $0,001 My view: As long as we hold this base, I expect a breakout first toward 0.0010 – 0.0012. If that zone flips into support, then the next leg up could reach 0.0019 – 0.0020. This would match the previous cycle moves we saw before. But at the same time, know that cycles go with a study plan and not just random. There is a trend on this coin where the cycles can run between 32 days and 91 days to targets. I’m watching closely. Accumulation is boring, but that’s usually where the best moves start. Patience could pay off big here. always do your study and make only choices depending your view as Cycles can take time.This means not that it should go now, it can take time for cycle to enter 80% of the time Also, when there is a correction by BTC, the coin can breakdown before it starts to rise.
SatochiTrader
SPELL/USDT HAS HIGH CHANCE TO BREAK UP $0,001
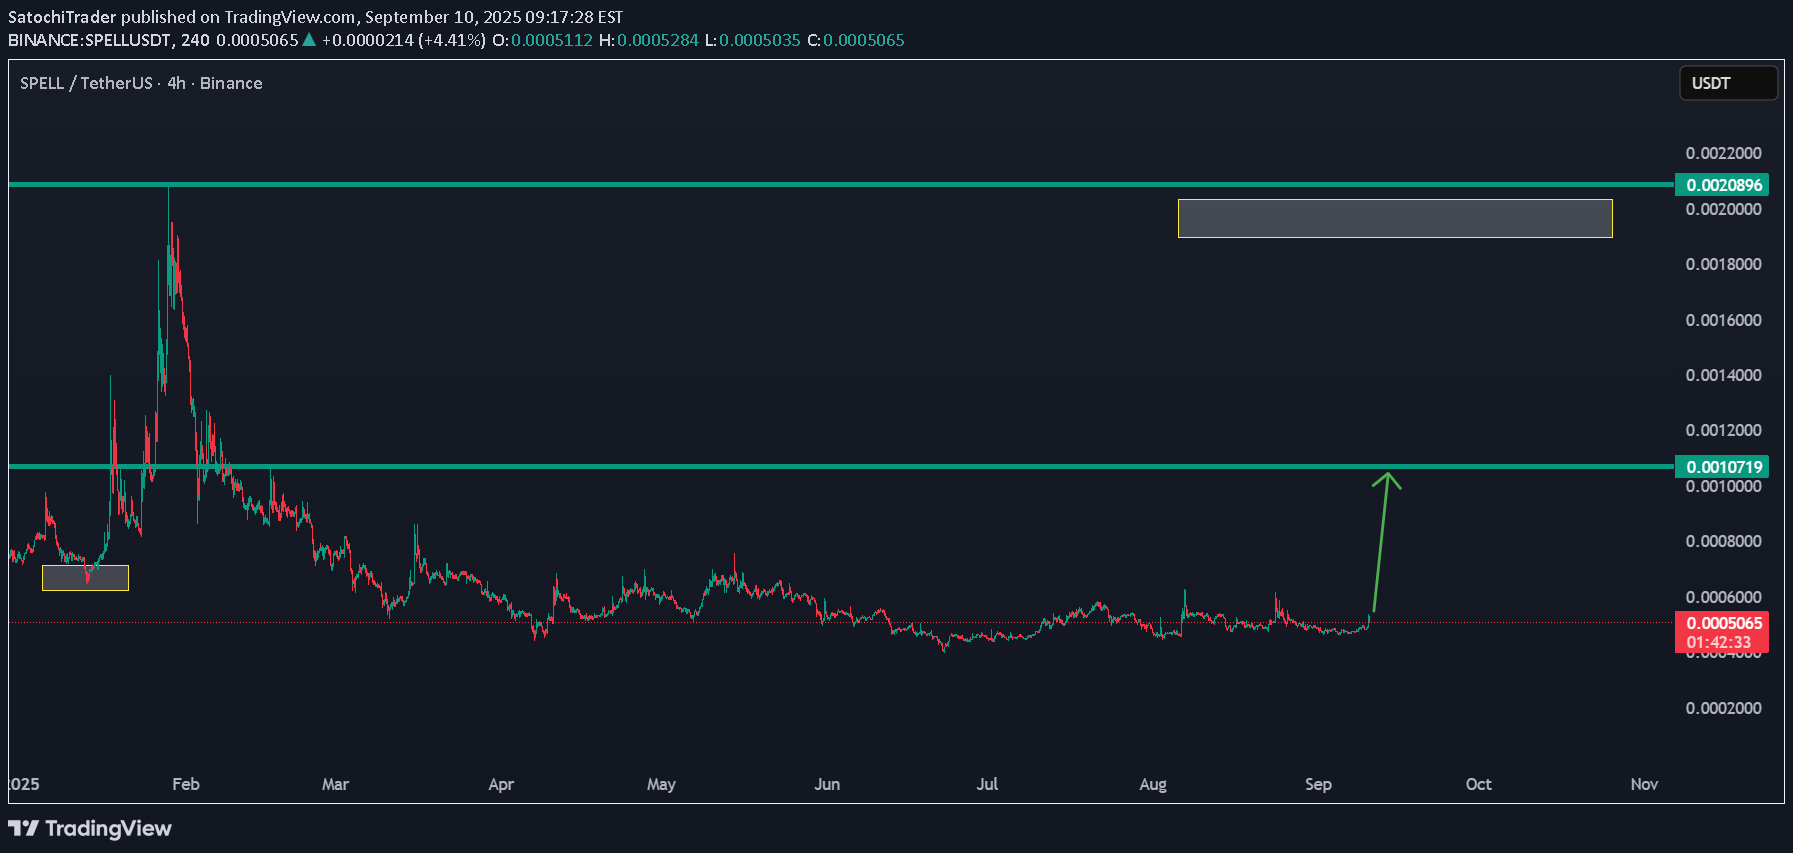
Depending on last data and since BTC is positive Spell show that this can be the bottom and for new reenter to up $0,001, we will follow the coin for confirmations.✅ I’ve prepared a complete setup for SPELL/USDT — both for traders who are already in a position and for those just looking to analyze it. 📌 If you’re not in a trade yet, wait for SPELL to confirm the highlighted yellow check zone before entering. 📊 I’ve also added risk zones for both scalp and swing trades, which makes this a full trading strategy with stop-loss levels included.Swing is still running.Spell is about to confirm an important target cross level, when that happens, it can increase by 40%, every time it crosses that level it increases The level is still not activated, but it can happen in the next hours.What can happen coming time is similar to what happened in this chart, this was a 20% range increase From an increase to a small breakdown, and with a break of 20% our new view can be 40%+First 15% could look like thisThe same start point and all 3 did confirm before the uptrend line.. The next one = in processingThis coin can show unexpected volume when it targets the activation lineWith precise analysis, the activation level can be estimated to be around this area. In the coming time, we’ll see if the price returns to this level and breaks through. There’s no guarantee it all depends on the data. we can follow it max 3 days to see what will happen Check this page for updates, spell/usdt$0.001 is a target that this coin can achieve after the increase.Very important Data This coin could do 270%, we have seen that the range can be between 21 days and 86 days after confirming the trend line. Depending on the data, this coin can do 270% with a max data of 8 October 2025 Our main expectation is below this data $0,001When the price breaks down, the activation level comes below, and higher chance of a break The key = Time frame, the more times it goes, the better it becomes for spell/usdt for activation level. At a point, they will break it since it happens more times the same, and data shows a high chance for that.
CryptoNuclear
SPELL/USDT — Long-Term Accumulation or Final Breakdown?
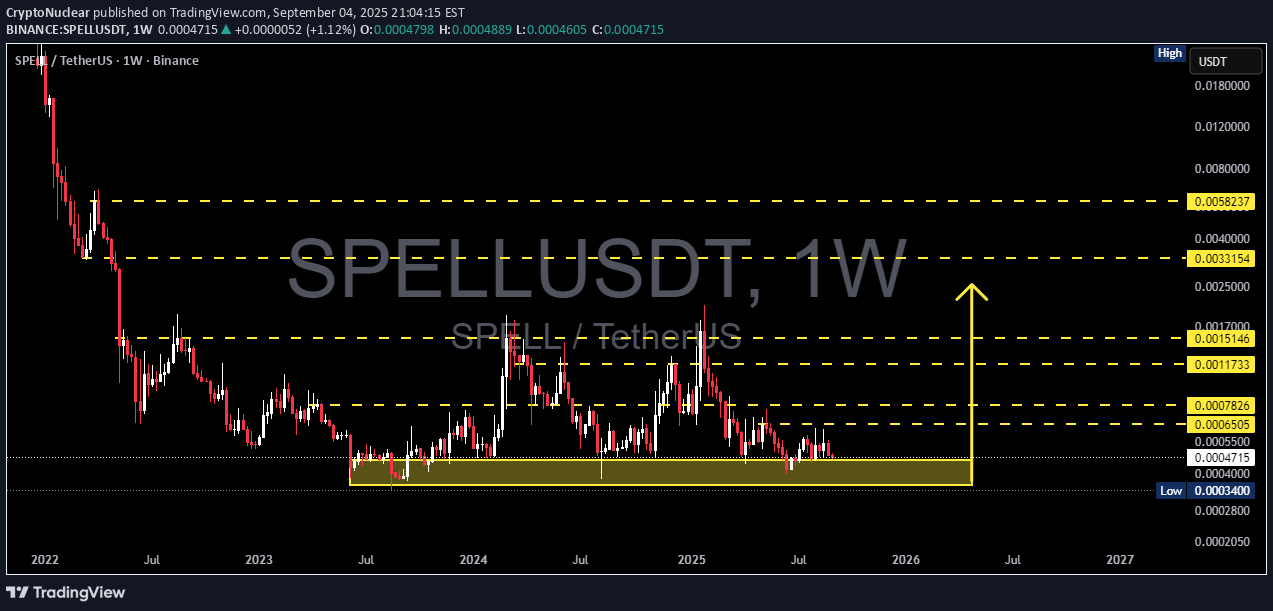
Since early 2022, SPELL has been in a strong downtrend, followed by a multi-year consolidation. Right now, the price is once again sitting inside the critical accumulation zone (0.00034 – 0.00047), which has been tested multiple times over the past 2+ years. This area represents a major battleground between long-term buyers looking for undervaluation and sellers maintaining downward pressure. --- 🔎 Chart Structure & Pattern Macro Downtrend: clear series of lower highs and lower lows since 2022, showing dominant selling pressure. Rectangle Accumulation: since 2023, price has been moving sideways inside the yellow support box (0.00034 – 0.00047). Repeated Rejections: every dip into this zone was met with sharp wicks upward, showing demand. But... if this zone fails, it may confirm exhaustion of buyers and open the door for deeper downside. --- 🚀 Bullish Scenario (Rebound & Reversal) For SPELL to flip bullish, these conditions must be met: 1. Support Holds: weekly close remains above 0.00034. 2. Breakout Confirmation: price must break and hold above resistance levels at 0.00065 → 0.00078 → 0.00117. 3. Volume Expansion: strong volume on the breakout to confirm real demand. 🎯 Bullish Targets: Short-term: 0.00065 – 0.00078 Mid-term: 0.00117 – 0.00151 Long-term (major reversal): 0.00331 – 0.00582 --- ⚠️ Bearish Scenario (Breakdown & Continuation) If SPELL closes below 0.00034 on the weekly, it will confirm a major breakdown: Long-term holders may cut losses, adding further selling pressure. With no strong historical support below, price may seek psychological levels lower. This could trigger a capitulation phase, creating new lows before a potential cycle reset. 🎯 Bearish Targets: Psychological support at 0.00020 – 0.00025 or even deeper levels due to lack of structure below. --- 🧩 Conclusion & Narrative SPELL is at a make-or-break zone: If 0.00034 – 0.00047 holds, we could see a significant rebound with multi-level rally potential. If it breaks, we may enter a new bearish leg with much lower prices ahead. For traders, this area can be approached two ways: Aggressive Strategy: accumulate inside support with a tight stop below 0.00034. Conservative Strategy: wait for a confirmed breakout above 0.00078 and enter on the retest. 📌 Bottom line: This zone is not just numbers — it’s the cycle-defining area for SPELL in the coming months and possibly years. --- #SPELL #SPELLUSDT #Crypto #Altcoin #TechnicalAnalysis #SupportResistance #PriceAction #CryptoAnalysis #Accumulation

rackly
spell
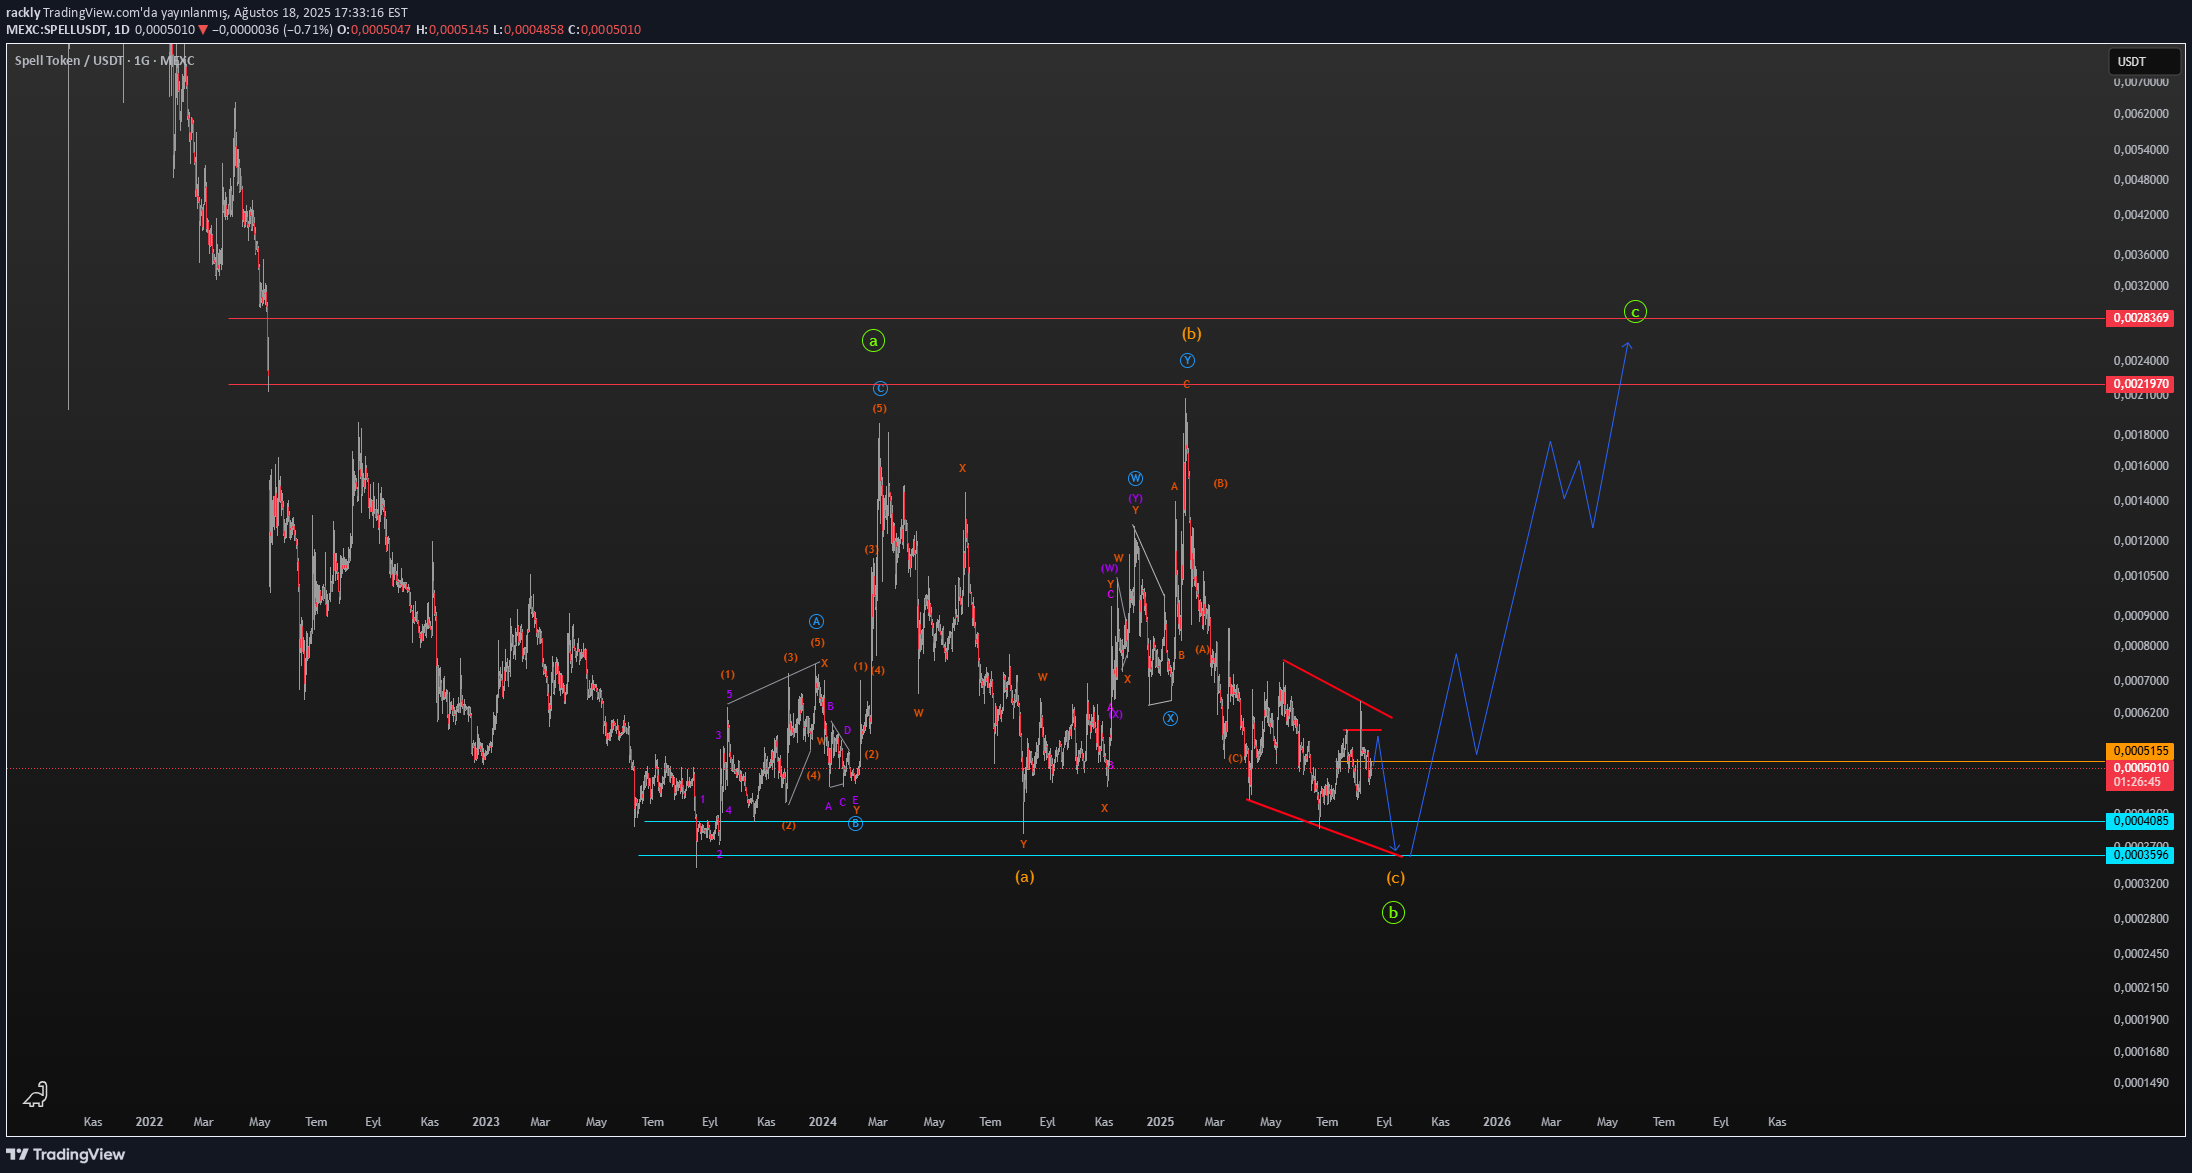
spell Elliot Wave is the count only for tracking purposes. YTD.
rackly
spell

spell Elliot Wave is the count only for tracking purposes. YTD.
Disclaimer
Any content and materials included in Sahmeto's website and official communication channels are a compilation of personal opinions and analyses and are not binding. They do not constitute any recommendation for buying, selling, entering or exiting the stock market and cryptocurrency market. Also, all news and analyses included in the website and channels are merely republished information from official and unofficial domestic and foreign sources, and it is obvious that users of the said content are responsible for following up and ensuring the authenticity and accuracy of the materials. Therefore, while disclaiming responsibility, it is declared that the responsibility for any decision-making, action, and potential profit and loss in the capital market and cryptocurrency market lies with the trader.