
rackly
@t_rackly

What symbols does the trader recommend buying?
Purchase History
پیام های تریدر
Filter
rackly
spell
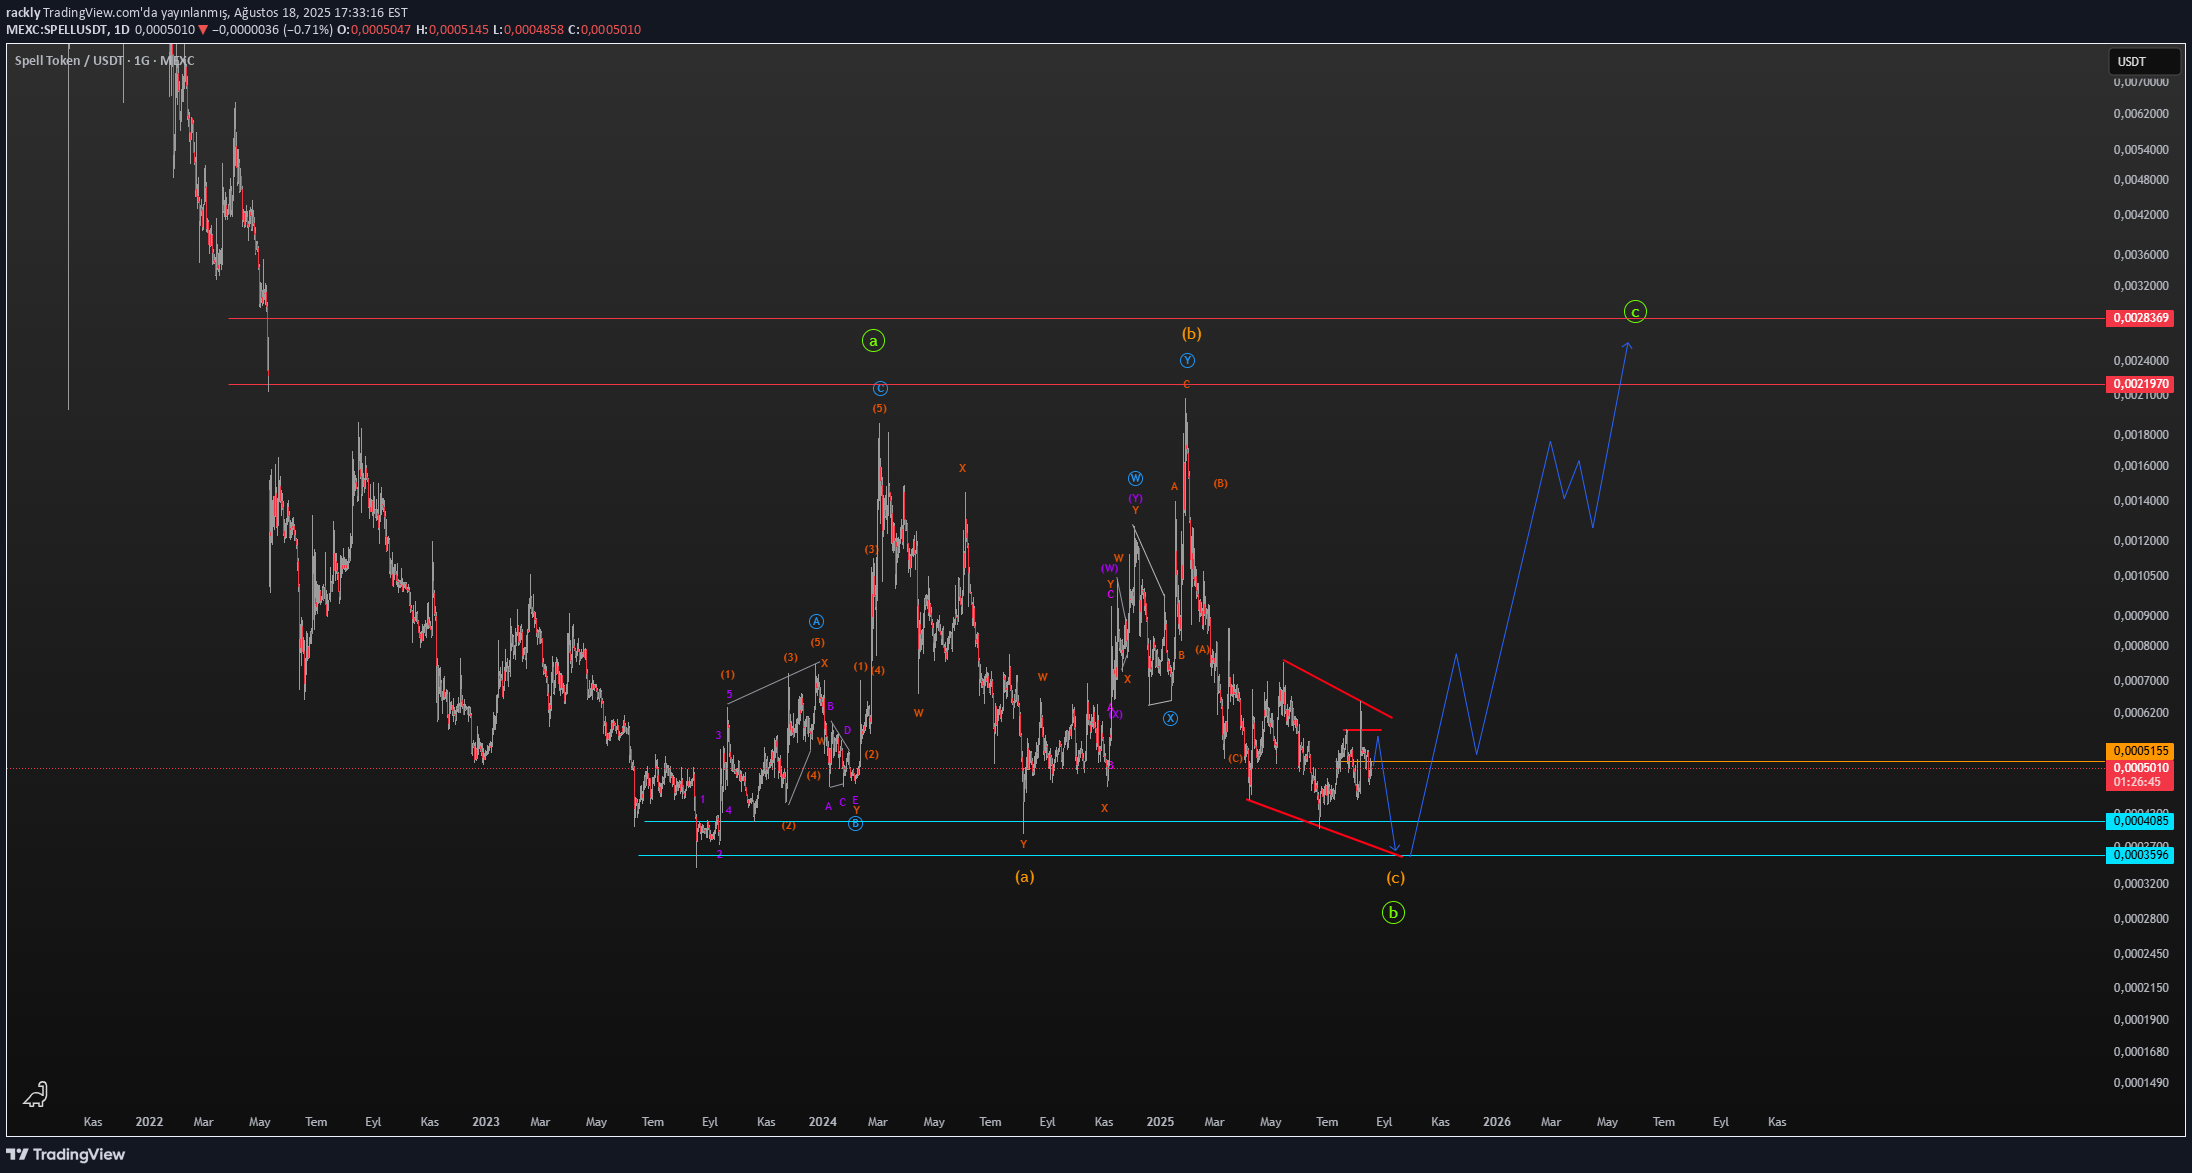
spell Elliot Wave is the count only for tracking purposes. YTD.
rackly
rackly

rackly
TAOUSDT

Tao Long term is a nice scheme welcomes us, and when we look at the elliot wave perspective, I expect him to complete the upward missing wave that has given correction after a obvious 5 -impulse. I have specified targets on the graph, it is definitely not an investment advice.
rackly
RSRUSD

I think the complex wave structure is missing in RSR I think that the targets towards the end of the year are specified in the graph. It is not precisely investment advice. daaaaaaagğ
rackly
ETHFI

در نمودار، به نظر میرسد که یک الگوی اصلاحی W-X-Y گسترده در جفت ETHFI به پایان رسیده است. پس از این الگو، قیمت از کف شروع به تشکیل یک ساختار ایمپالس صعودی جدید کرده است. اولین موج صعودی پنجتایی کامل شده و در حال حاضر، به نظر میرسد که وارد یک فاز اصلاحی پس از این افزایش شدهایم.این حرکت اولیه صعودی، ماهیتی ایمپالس با ساختار پنج موجی دارد و به عنوان موج A برچسبگذاری شده است. با این حال، یک تحول تکنیکی مهم که جلب توجه میکند، شکست رو به پایین خط روند 0-4 پس از این موج صعودی پنجتایی است. این شکست به شدت نشان میدهد که حرکت صعودی در کوتاه مدت به پایان رسیده و یک فاز اصلاحی (موج B) آغاز شده است.در این راستا، این احتمال وجود دارد که موج B به سمت پایین توسعه یابد و تا دو منطقه حمایتی مهم ذکر شده در نمودار (0.828 و محدوده 0.620–0.575 USDT) عقبنشینی کند. این سطوح همچنین مناطقی هستند که در گذشته نقدینگی و تقاضا در آنها متمرکز شدهاند. در صورتی که اصلاح در این مناطق به پایان برسد، انتظار یک موج C قوی میرود. این موج C میتواند قیمت را به سمت بالا تا منطقه مقاومت/عرضه اصلی در سطح 6.36 USDT برساند.به طور خلاصه، اگرچه تمایل اصلاحی در کوتاه مدت غالب است، اما پتانسیل صعودی قوی در بلند مدت حفظ شده است. انتظار میرود پس از تکمیل موج "B"، یک شروع روند جدید با موج "C" آغاز شود.
rackly
fet

این یک شمارش موج الیوت کوتاه مدت است. احتمالاً موج 4 را تکمیل کرده و موج 5 را آغاز میکند. لطفاً فقط برای اهداف پیگیری در نظر گرفته شود. توصیه سرمایهگذاری نیست.
rackly
bome

توی bome یک الگوی زیگزاگ دوبل برای اصلاح بعد از ۵ لی دیده میشه، این فقط برای پیگیری هست و توصیه سرمایه گذاری نیست.
rackly

rackly
wıf

با توجه به چشم انداز کوتاه مدت و میان مدتم، این موارد فقط برای اهداف پیگیری هستند. توصیه مالی نیست.
Disclaimer
Any content and materials included in Sahmeto's website and official communication channels are a compilation of personal opinions and analyses and are not binding. They do not constitute any recommendation for buying, selling, entering or exiting the stock market and cryptocurrency market. Also, all news and analyses included in the website and channels are merely republished information from official and unofficial domestic and foreign sources, and it is obvious that users of the said content are responsible for following up and ensuring the authenticity and accuracy of the materials. Therefore, while disclaiming responsibility, it is declared that the responsibility for any decision-making, action, and potential profit and loss in the capital market and cryptocurrency market lies with the trader.