
SNX
Synthetix
| تریدر | نوع سیگنال | حد سود/ضرر | زمان انتشار | مشاهده پیام |
|---|---|---|---|---|
No results found. | ||||
Price Chart of Synthetix
سود 3 Months :
سیگنالهای Synthetix
Filter
Sort messages by
Trader Type
Time Frame

تحلیل الیوت SNXUSD: رازهای پر کردن جیب با سینتتیکس!
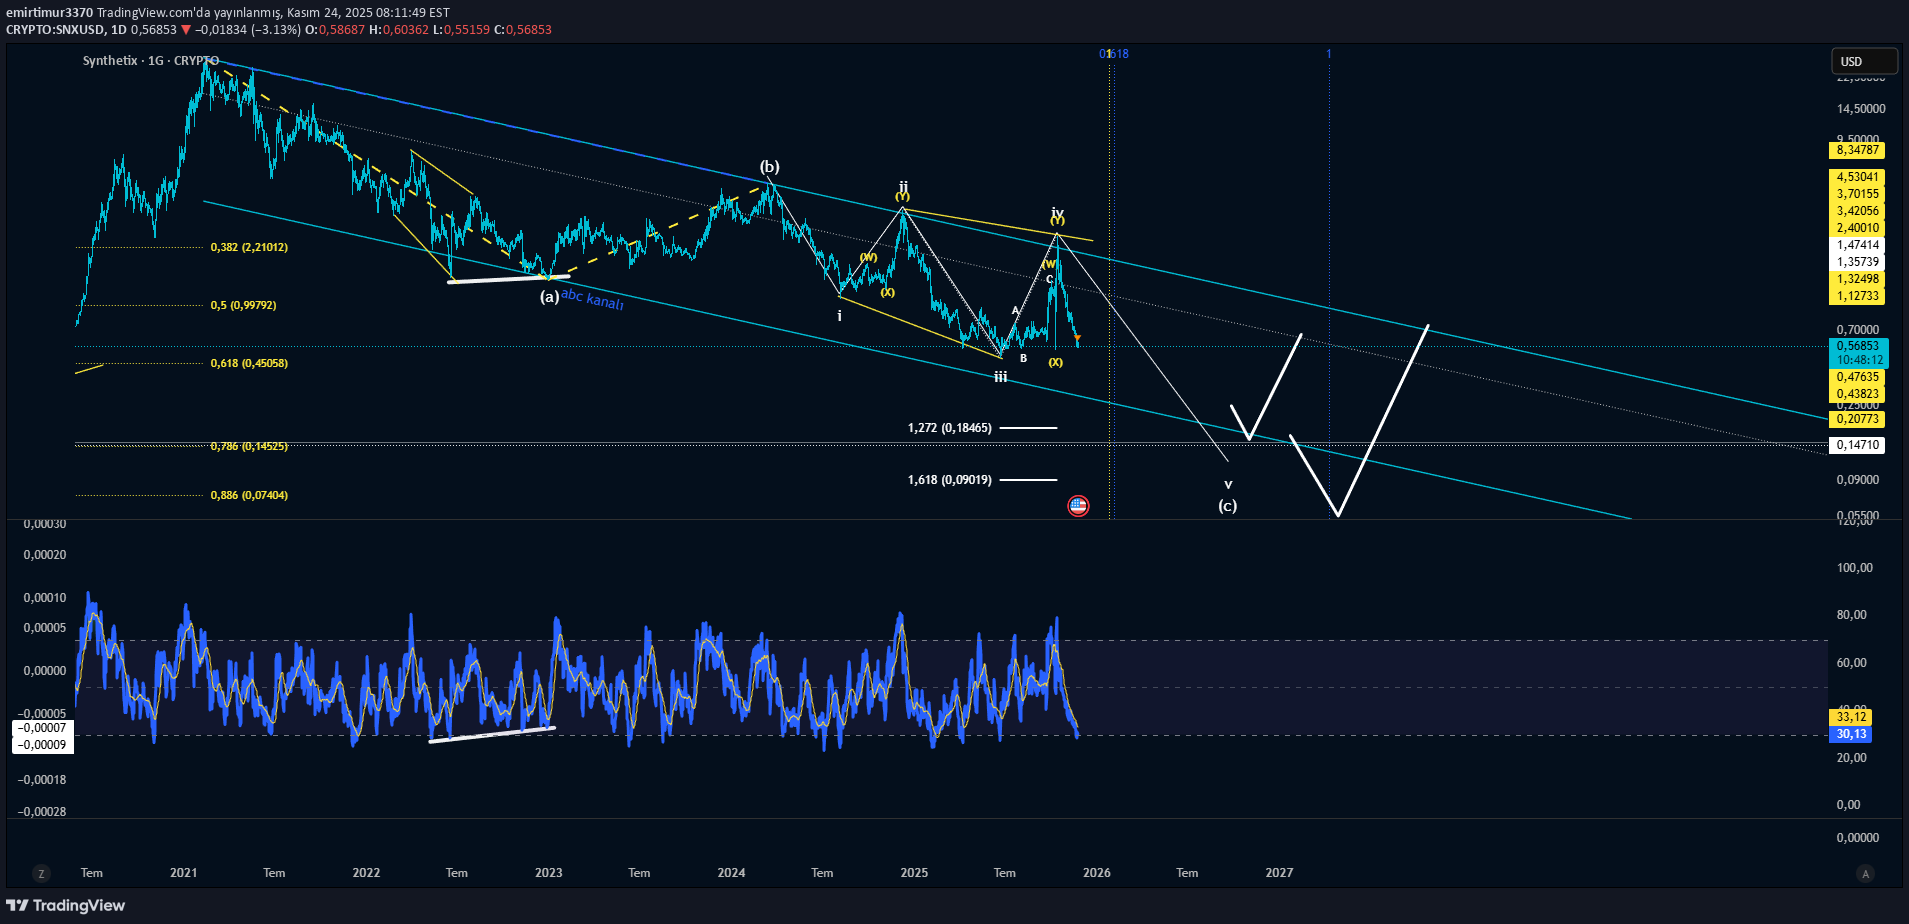
This count seems more plausible than the previous count, but it seems like there is more to it one way or another. YTD. Previous counting idea.
سقوط آزاد SNX/USD: ماجرای فرود اجباری به باکس 5 دقیقهای!
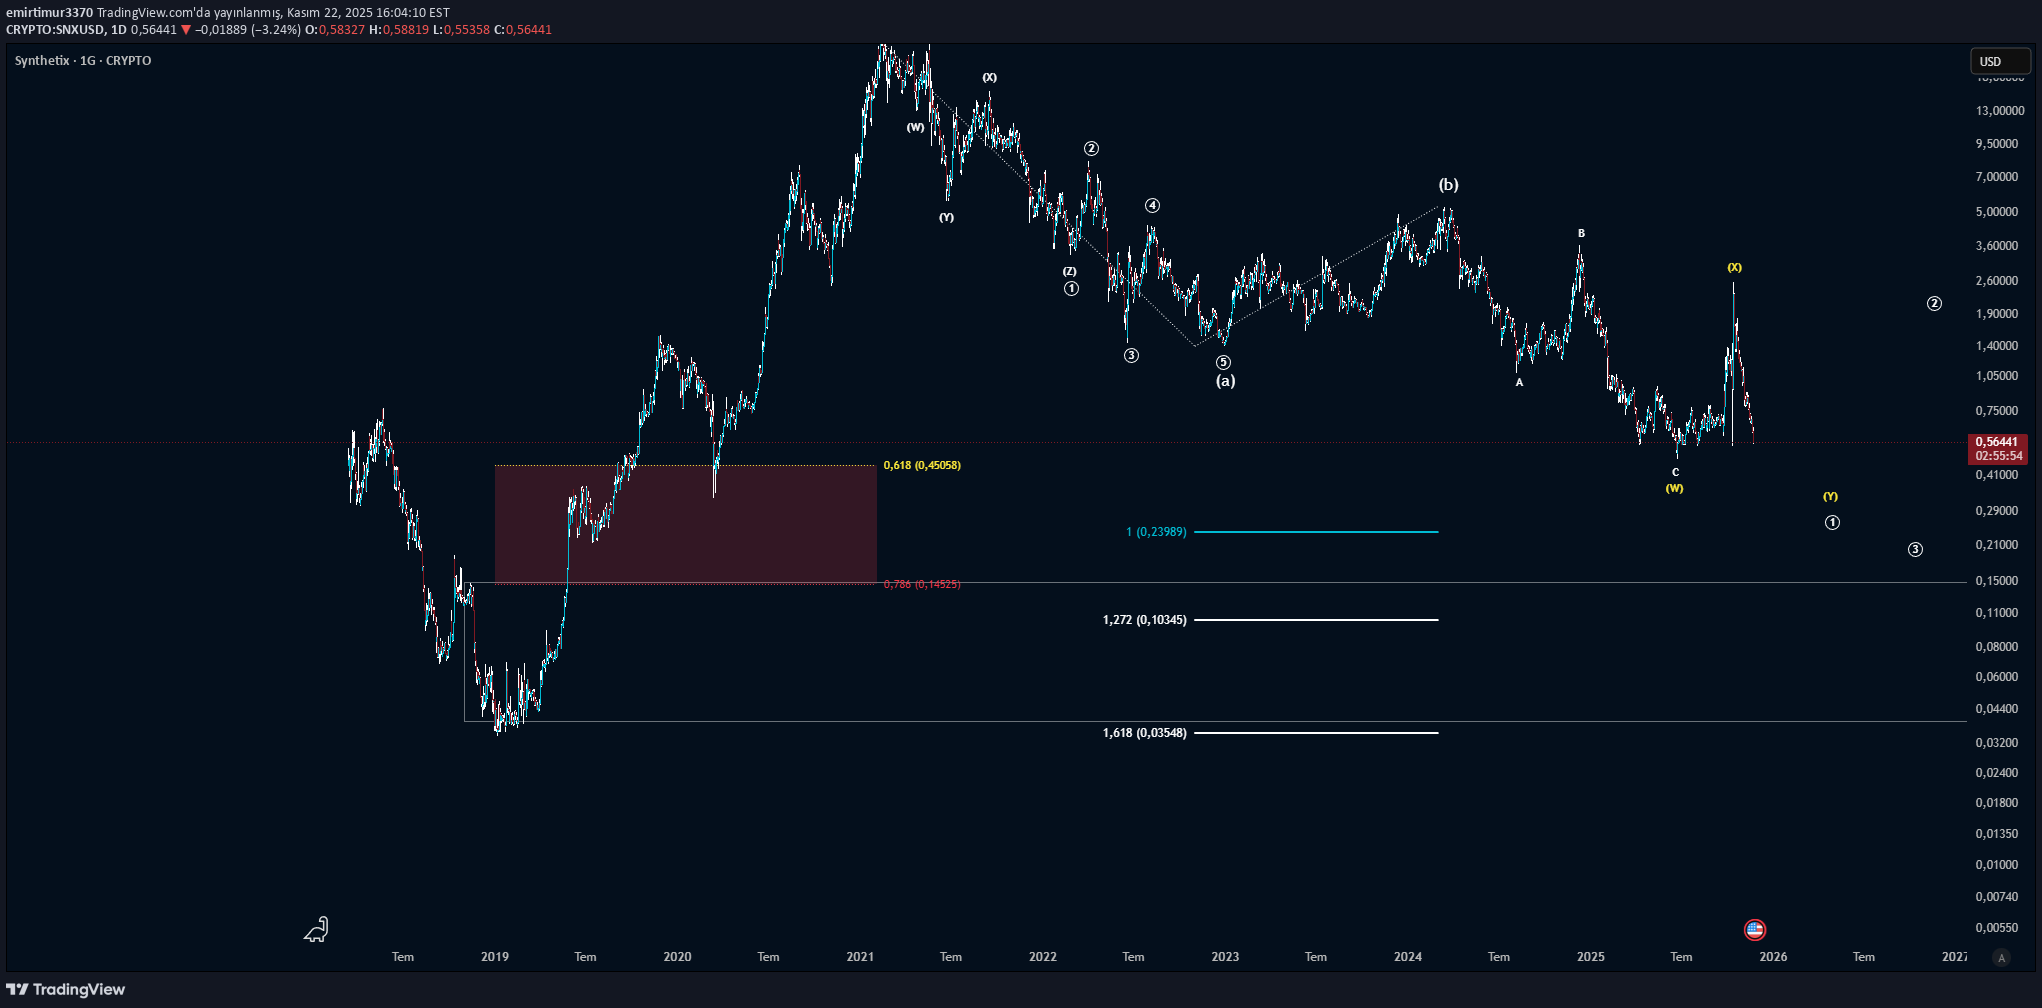
My SNXUSD EWA analysis is briefly like this. YTD. I feel like they're going to beat me down there one way or another.

Kapitalist01
پیشبینی کوتاهمدت بازار: استراتژی فیبوناچی ۶۱۸ برای تاریخ ۲۱.۱۱.۲۰۲۵
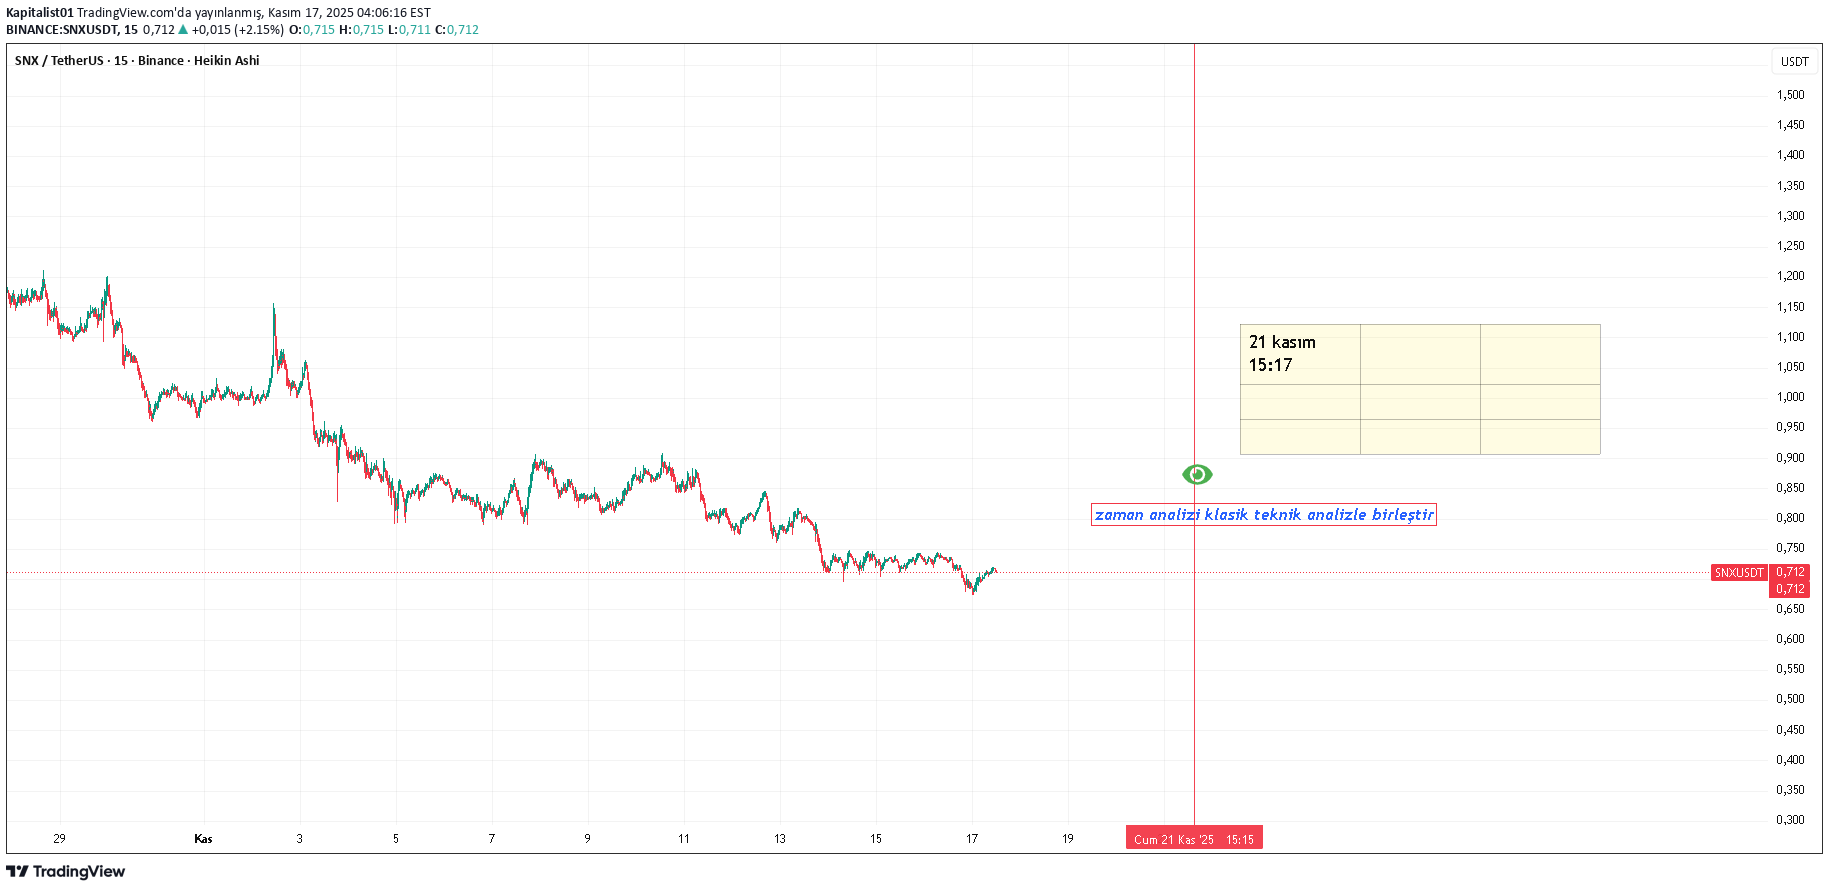
for monitoring purposes y.t.d trading on daily chart A note to myself based on fibonaççi 618 for short term futures market
تحلیل تکنیکال SNX/USD: نقشه راه آینده و استراتژی معاملاتی قطعی
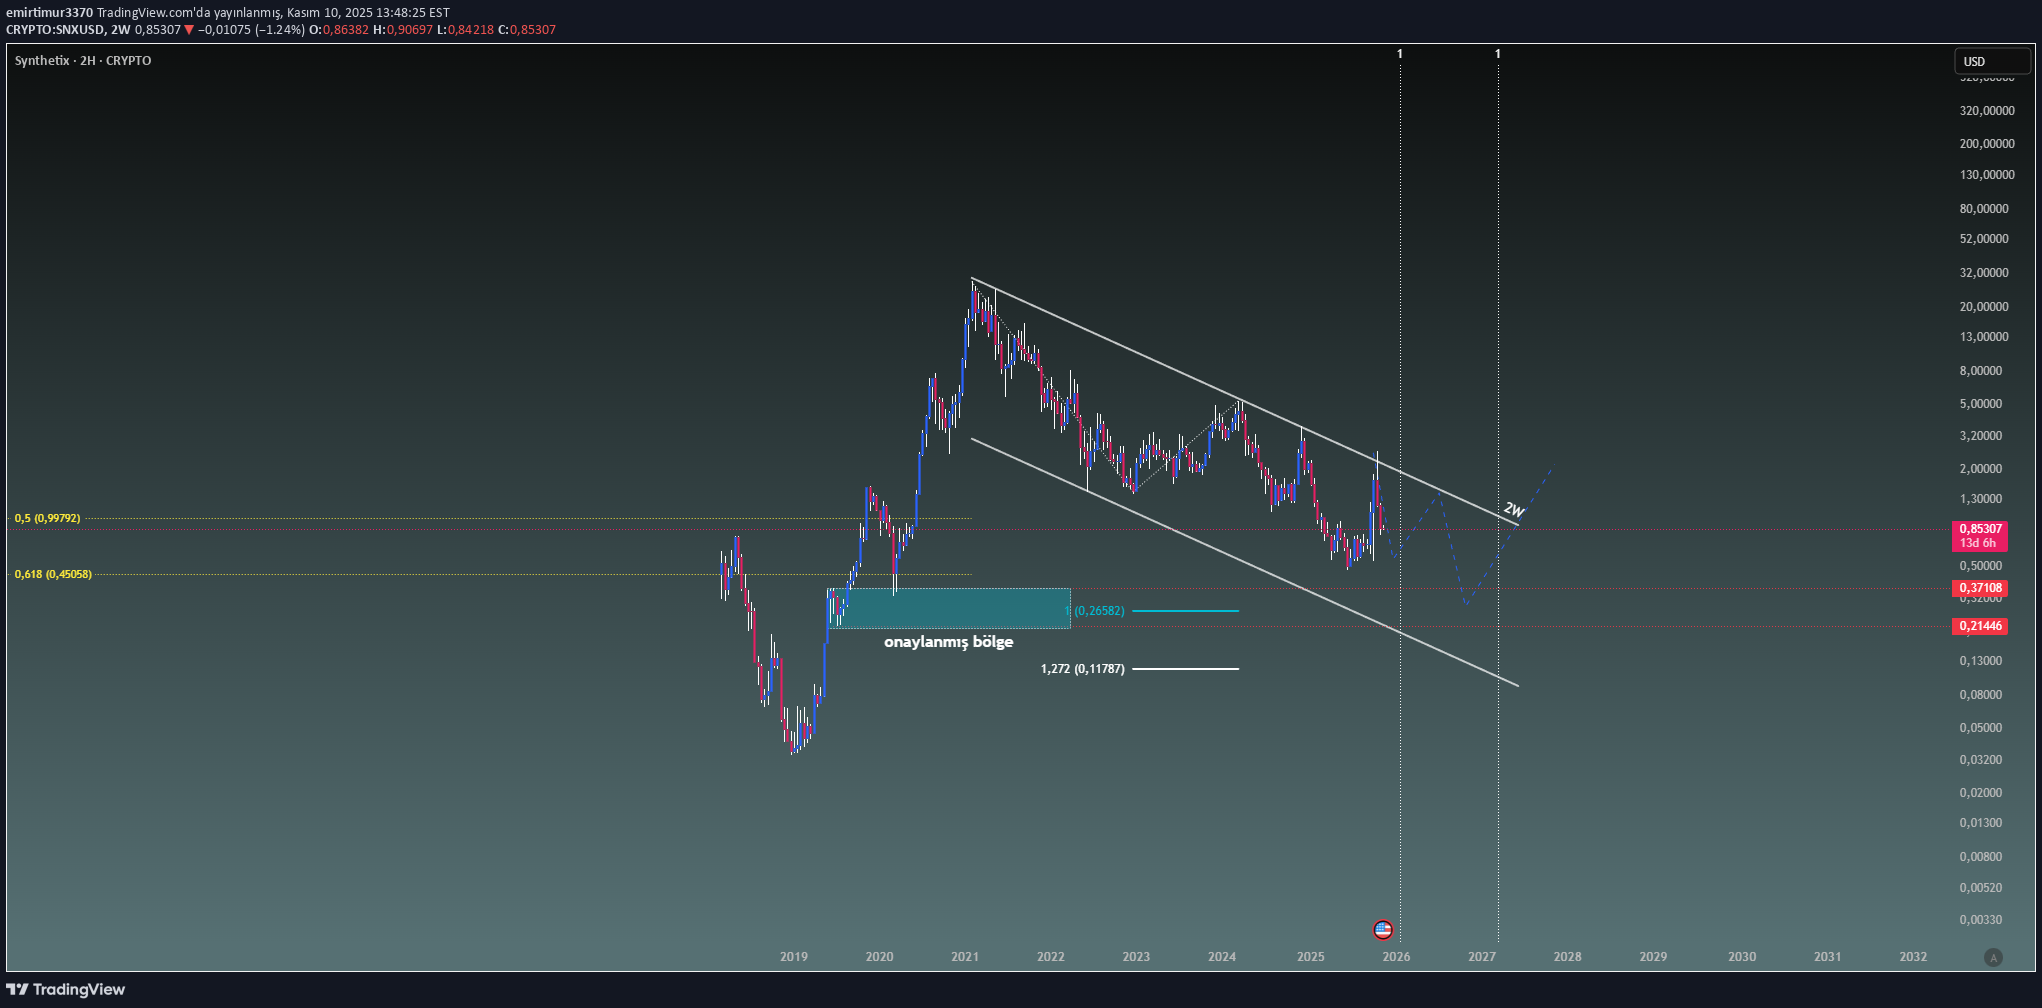
A road map has been prepared for SNXUSD. I will follow this way, YTD. Good luck.

FX_Professor
توکن SNX (غول دیفای) بیدار شده است؟ فرصت خرید در کف تاریخی!

SNX – The OG DeFi Token Awakens? 🧬🚀 Synthetix (SNX) is back on the radar, trading just above its historic base at $0.78–$0.88 — the same accumulation zone that birthed past monster runs. This isn’t just nostalgia. The OG DeFi protocol is launching a new DEX in the coming weeks, built on L2 Ethereum. And yes — SNX was the first perpetuals DEX on-chain before it was even cool. 📊 Current Setup: Strong base at $0.78–$0.88 Resistance targets: $2.04 → $5.08 → $14.06 Macro extension: $22.04 zone if cycle rotates full DeFi 🔁 You’re looking at a classic bottom formation across both short- and long-term timeframes. Accumulation + news = ignition risk. Synthetix is part of DeFi history — and possibly its future if the new DEX delivers. Mindset Check 🧘 DeFi summer may be long gone, but real builders never left. The best setups are always born in silence. Disclaimer: I'm not a financial advisor, but I am the best prognosis you’ll ever get. Better than AI. Better than the herd. Still, this ain’t advice — it's education. And risk? That’s always yours. One Love, The FXPROFESSOR 💙

CryptoNuclear
منطقه طلایی SNX: آیا صعود میکنیم یا سقوط؟ (محدوده 0.87 تا 0.75)
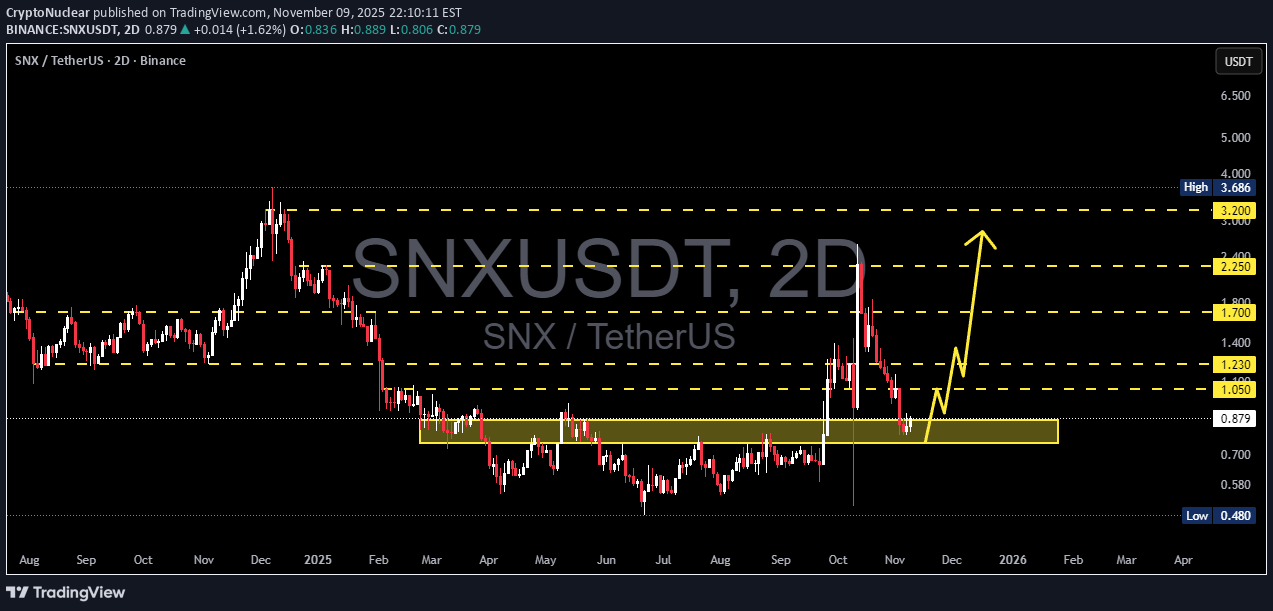
SNX has returned to the golden zone at 0.87–0.75, a level that has historically acted as the main battlefield between buyers and sellers. Price is now retesting the same area that once served as the foundation of a strong accumulation phase earlier this year. But this time, the context is different — after a sharp rejection from the 3.68 high, the market is testing whether this zone still holds real demand strength or not. --- 📊 Technical Structure & Price Pattern On the 2D chart, SNX has formed a broad accumulation range between 0.75 and 1.23. The spike to 3.68 looks like a classic liquidity sweep, where the market took out stop orders above resistance before quickly pulling back — often a sign of redistribution and preparation for the next move. Now, the 0.87–0.75 zone becomes the decision point: If it holds, the structure could evolve into a reaccumulation phase; If it fails, the market may confirm a descending continuation pattern toward the previous low around 0.48. --- 🟩 Bullish Scenario — Reclaim & Relief Rally For a bullish continuation: Price must hold above 0.87 and establish a higher low above 0.80. A confirmed reclaim of 1.05 and 1.23 will strengthen the bullish case, unlocking higher targets at 1.70 → 2.25 → 3.20. Sustained buying pressure with volume could shape a major double bottom targeting the upper range near 3.20. For swing traders, this yellow zone offers a low-risk accumulation opportunity, with clearly defined risk below 0.75 and potential multi-fold upside. --- 🟥 Bearish Scenario — Breakdown & Failed Retest If price closes below 0.75, it would confirm a range breakdown. Typical follow-up structure: Failed retest (price retests 0.80–0.87 and gets rejected); Bearish continuation toward 0.60–0.50, with possible extension to 0.48. This scenario could represent a final capitulation phase before a major cycle bottom — so traders should monitor volume and market sentiment closely. --- 🔎 Analytical Perspective The 0.87–0.75 zone isn’t just a technical level — it’s a psychological battleground. Large players often define their next move here, either absorbing supply for accumulation or distributing before the next leg down. Watch for bullish RSI or OBV divergences, as they often precede strong reversal setups before breakouts. --- 📈 Strategic Outlook Key Zone: 0.87–0.75 Current Sentiment: Neutral / Wait for confirmation Directional Bias: Bullish above 0.87, Bearish below 0.75 Main Bullish Targets: 1.05 → 1.23 → 1.70 → 2.25 → 3.20 Main Bearish Targets: 0.60 → 0.48 Keyword: “This zone will define SNX’s next market cycle.” --- #SNX #SNXUSDT #CryptoTA #TechnicalAnalysis #PriceAction #SupportZone #Accumulation #CryptoMarket #BreakoutOrBreakdown #SwingTrading

suleymankumyol
تحلیل SNX/USDT: آیا این کوین برای ترید مناسب است یا سرمایهگذاری؟ (بررسی سطوح کلیدی)
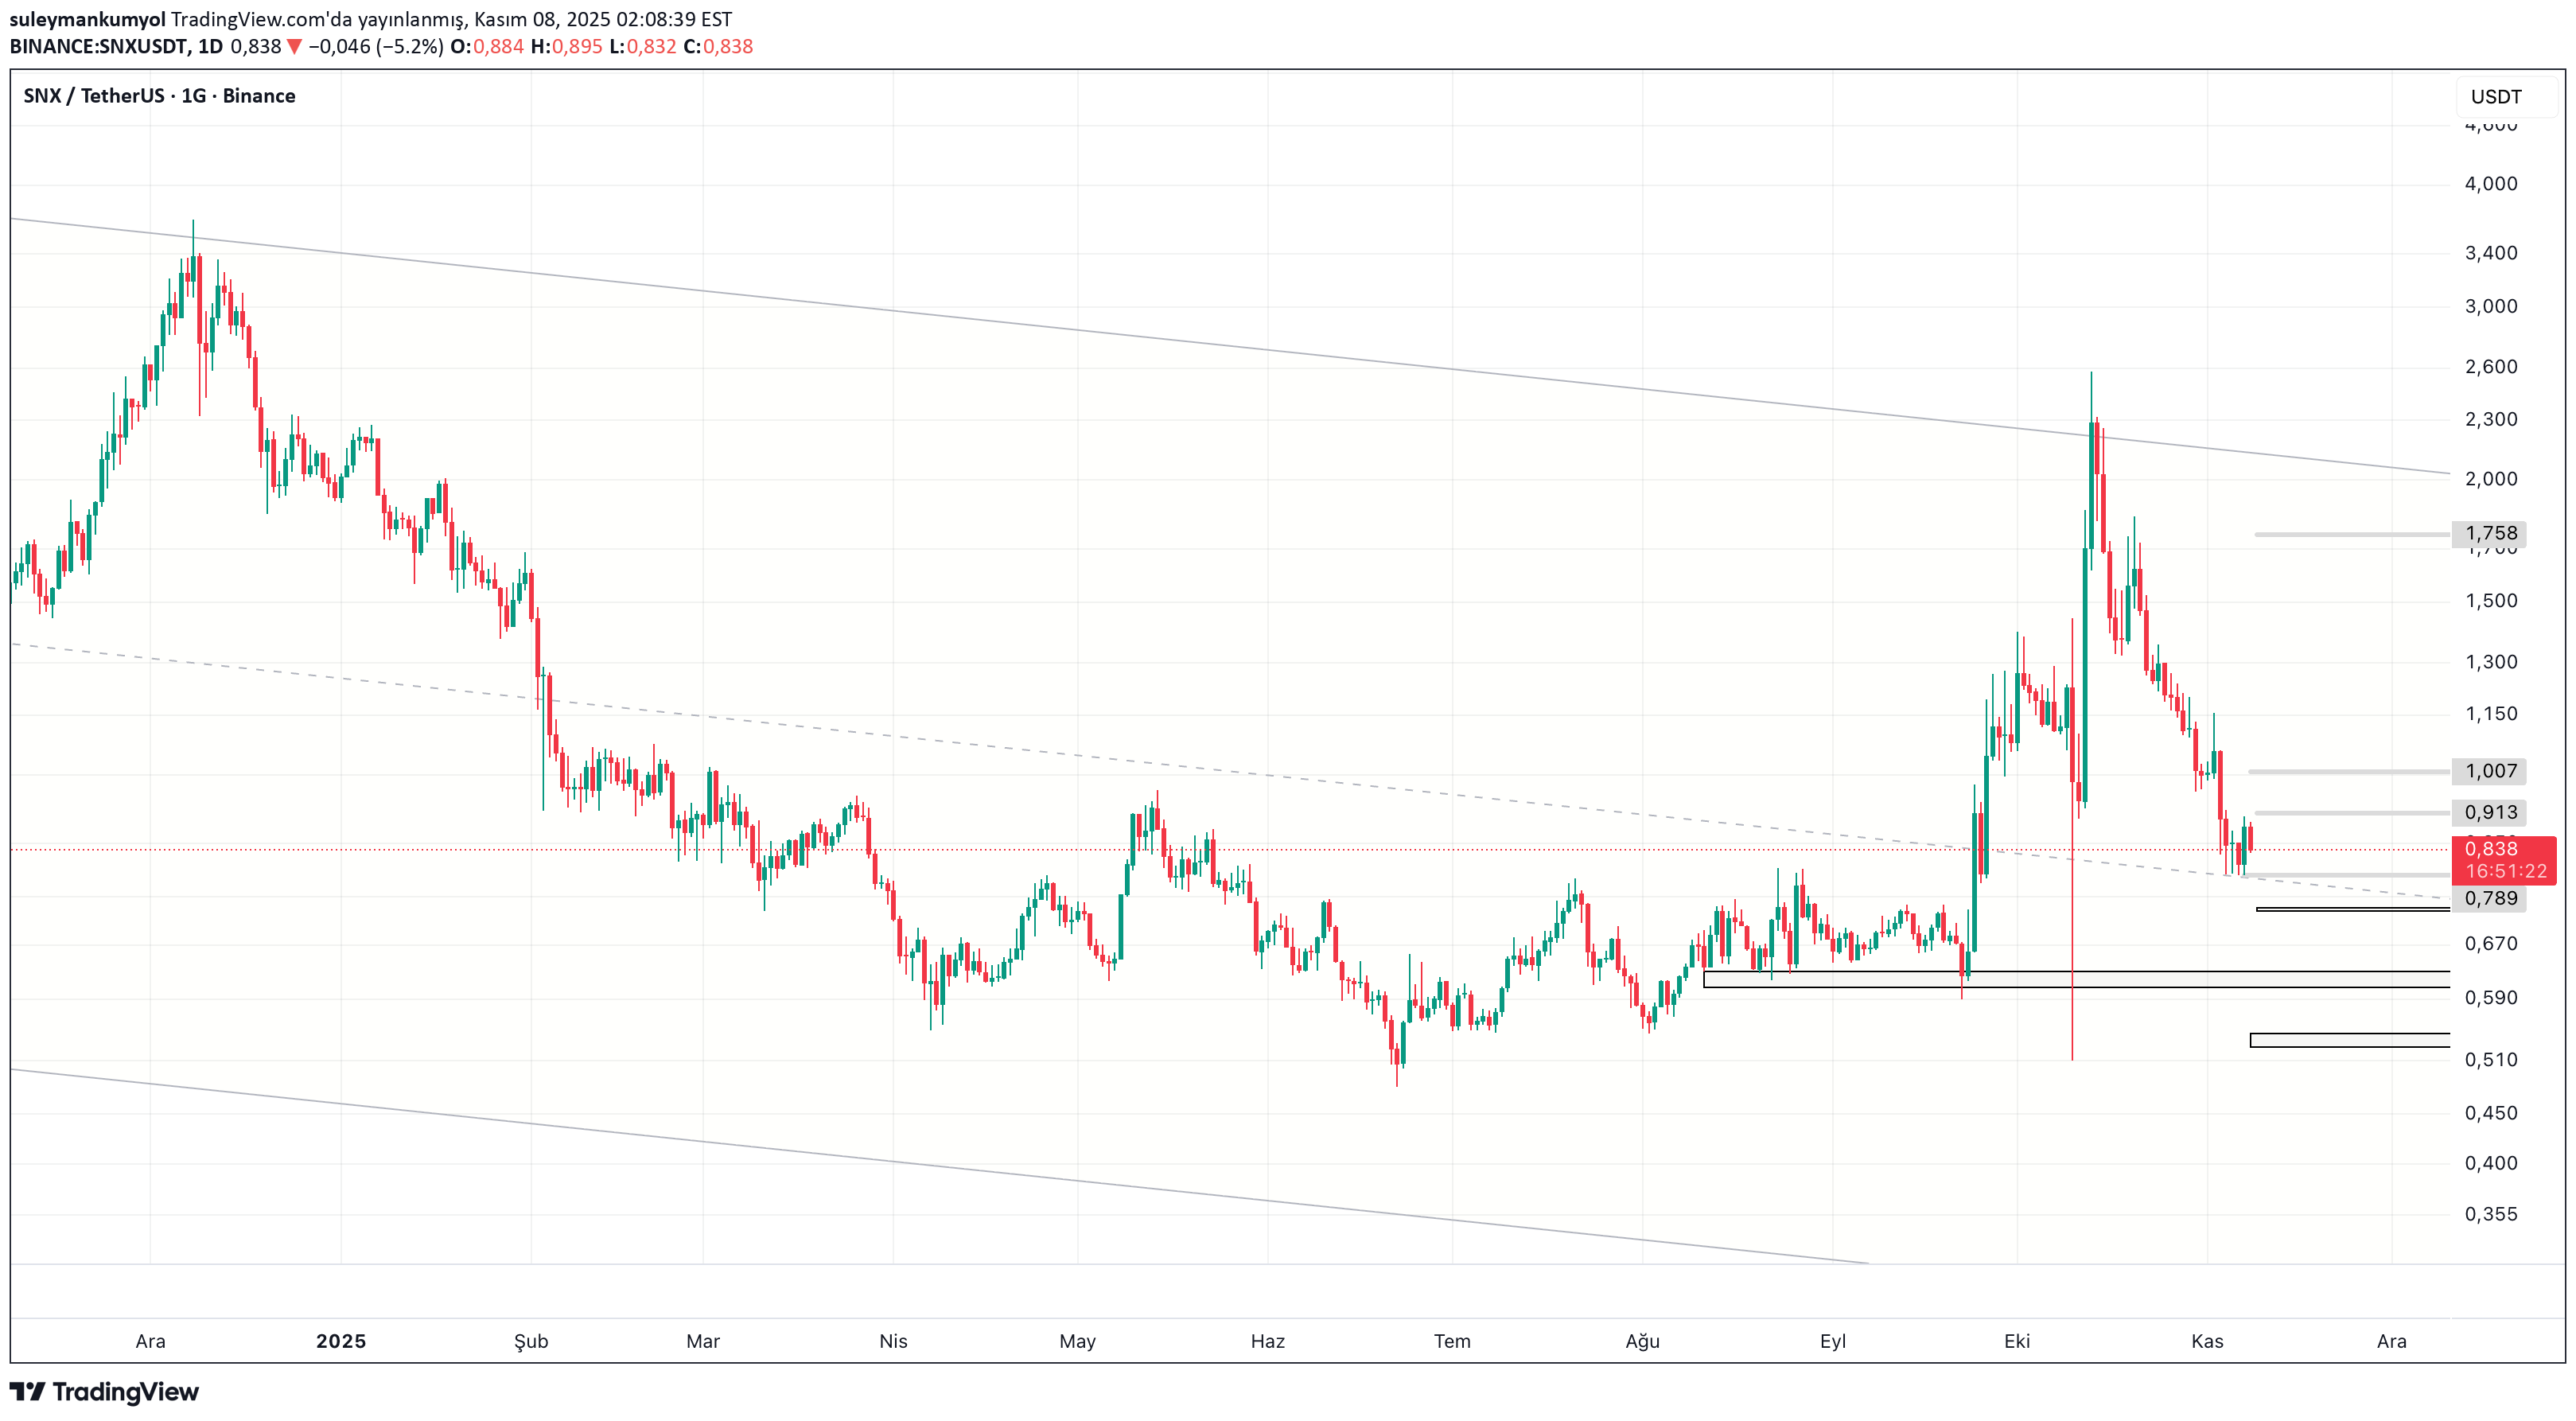
SNXUSDT Chart Commentary If I had to make a general evaluation; I think it is a coin that is more suitable for trading rather than including it in the portfolio. It has been continuing its movement within a large channel since '21. Although the chart I shared here only shows the last year, it is clearly seen that there is a channel movement, especially in the chart showing the weekly time frame. The enthusiastic movement that started on September 24, '25 carried SNXUSDT to the $2.3-2.4 line, which is the upper band of the channel. This big movement differed from the general situation of the market and caused SNXUSDT to diverge positively. However, before this big movement took place, it remained horizontal for about 5 months and accumulated, that is, it gained strength. In these types of coins, that is, coins that stand out from the market, the trader effect is still very high. In other words, price movement was achieved due to the push of traders rather than investors. For this reason, I do not include it in my portfolio, but I trade it. What I am telling you are my opinions. It does not contain investment advice. Let's talk about what the chart says. SNXUSDT has now supported the daily SMA200, that is, the $0.79 band. This line is also the middle line of the major channel, that is, a separating support. If serial day closings occur below the midline of the channel I showed in the chart, that is, if the day closes below this line for a few days, $0.63 and then the $0.52-0.55 band will work as support. If it falls below this, we need to re-evaluate. Before explaining the stops in a possible upward movement, I must say that SNX should do some horizontal pricing and gather strength. Additionally, a Death Cross has formed on the chart. On the daily, SMA20 crossed SMA 50 below. This is a situation caused by an extreme increase from the end of September to mid-October. But this indicator may keep investors away for a while. In other words, they may say that the coin has already made its move and do not prefer it. These are just comments. It could also be the opposite. But I think it will spend some time sideways and do whatever the market does. So I don't expect any drastic action. The above pricing will be as follows: There is daily SMA100 in the 0.913 band. A big rise will not start before passing this. After that there is $1.03. This will also be a nice stop. The upper band of the channel, that is, the $ 1.7-2 band, has served as resistance for about 5 years. So this place is like an impenetrable castle. If this resistance is broken in a possible bull run, extremely high and surprising prices will occur. I'm adding this as an extra comment. It is not investment advice. I wish everyone good luck.

crypto_profile
آخرین فرصت خرید SNX قبل از جهش بزرگ: تحلیل دقیق و سناریوهای سودآوری!
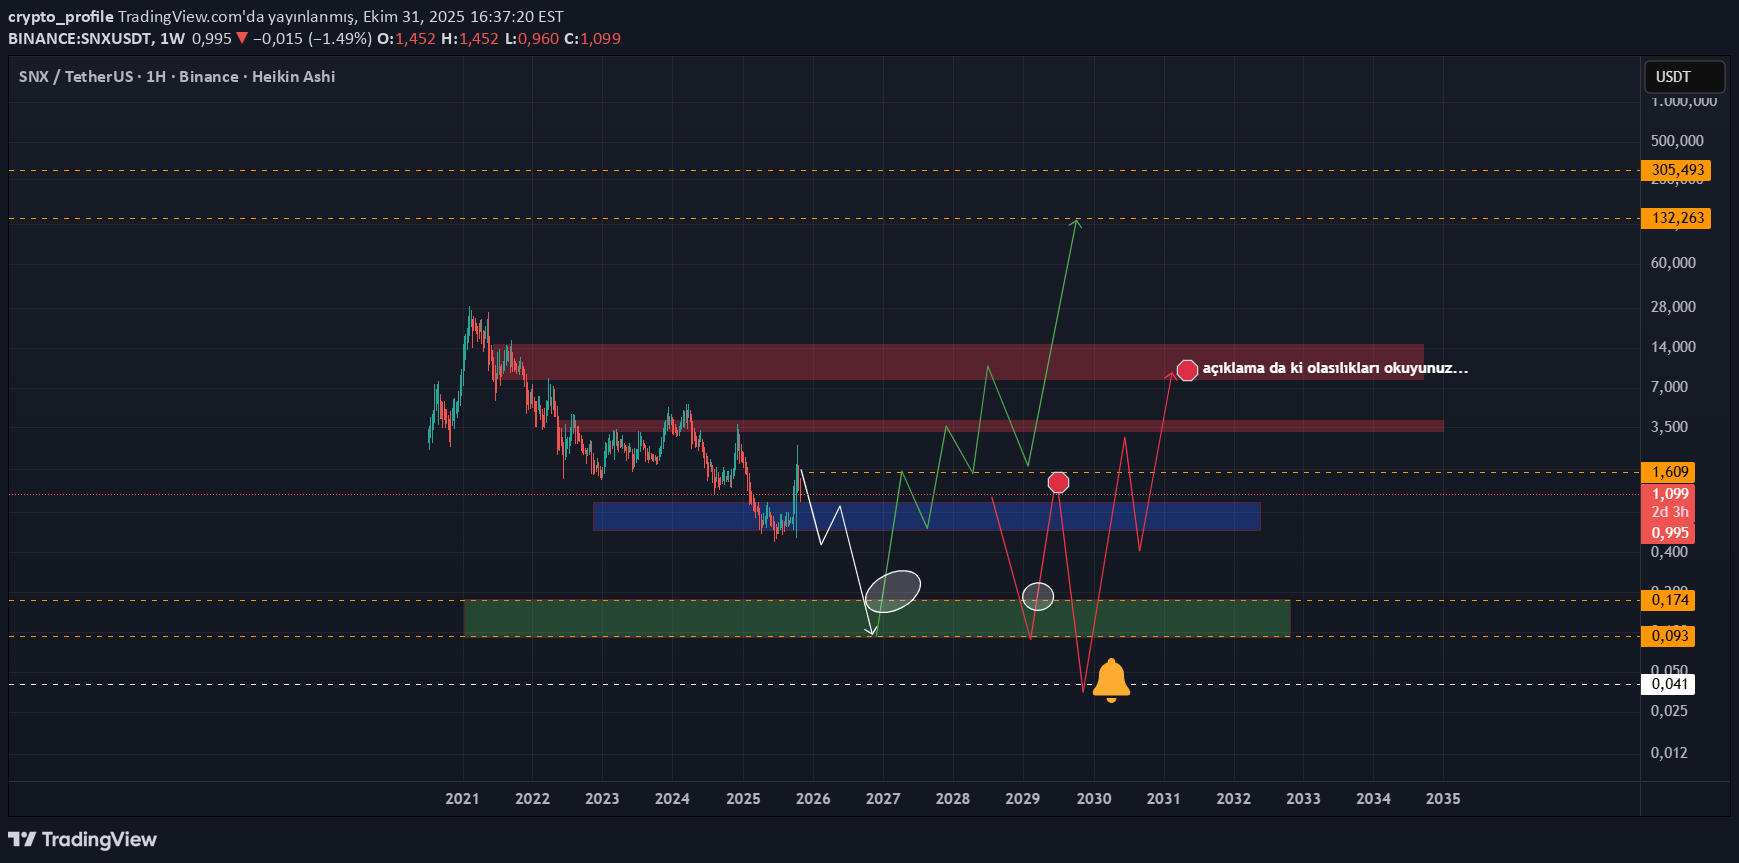
Hello friends, this parity was viewed upon request. First of all, there is an anomaly on the marketcap data side, it is necessary to look at it again with the update because there is an inconsistency on the circulating supply, max supply and total supply side, but after updating the data side, we will see, let's share the graphics for now. If the anomalies CONTINUE when the purchase comes, IT WILL NOT BE A PRODUCT I WILL take action on. NOW The decrease will continue until the range below under the blue area, that is, the range of 0.17-0.09 cents This range may start the rally in this product BUT alt the white dashed area, i.e. 0.041, seems to be a manipulable area. Now you should read this point carefully, from whichever area this type of manipulation comes, where the rally will end, I will tell you this based on my experience. If such a manipulation occurs, I expect it to occur directly with the loss of green area and make a quick return, and when the green area is regained, if the market cap data is correct, I will buy. In this case, my cost would be 0.20 cents and my sequential sales strategy would be as follows. Since there is a hard sell potential at 0.85 dollars after my first profit taking area, I will sell a significant part of my balance in that area and wait for 150 dollars with the remaining small percentage. Whether it comes or not, I don't care since the percentage I will leave inside will be in a range that will not upset me. FAKAAAAAAAAT If a heavy selling pressure occurs as soon as the price checks the green area and tests the $ 1.50-2.00 range and this possible manipulation zone is tested, it seems that the rally in this product will remain at MAX 15 USDT In this case, my cost would be 0.2, a good percentage at 3.50, and then I would take out a very large amount of assets in the range of 8.5-13 USDT and continue with a small rate. Those who do not understand what I mean can understand what the repetition of the structure will do if they look at the NEOUSDT parity daily and weekly. Of course, this is a scenario, but it continues with a high probability. But now, as someone who thinks that the next wave of decline will be the last opportunity while hearing the footsteps of the rally, as someone who wants to evaluate his money by considering the possibilities, I am trying to give you financial literacy, not investment advice. I repeat, if there is a rally before these areas come, I will stay behind by 50% or 100% at most and get involved in the process, but if I buy at the wrong time, I will lose my balance. I am not someone who can afford this. Take care until we meet again

TheHunters_Company
فرصت طلایی خرید SNX در اصلاح قیمت: استراتژی ورود پلهای و اهداف آینده!
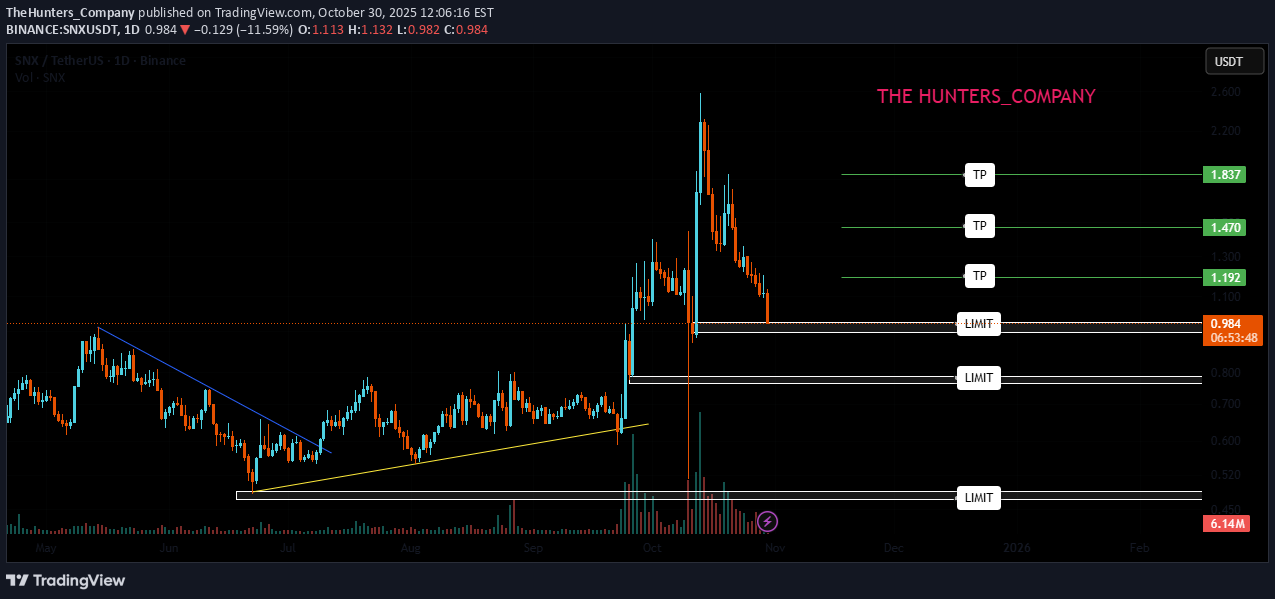
Hello friends Given the good growth we had and the arrival of buyers, now that the price is correcting, there is a good opportunity to buy in steps with risk and capital management and move towards the specified goals. *Trade safely with us*TP 1 REACHED

soheylifar
نوسانات وحشیانه SNXUSDT: رمز ارزی که نباید نادیده بگیرید!
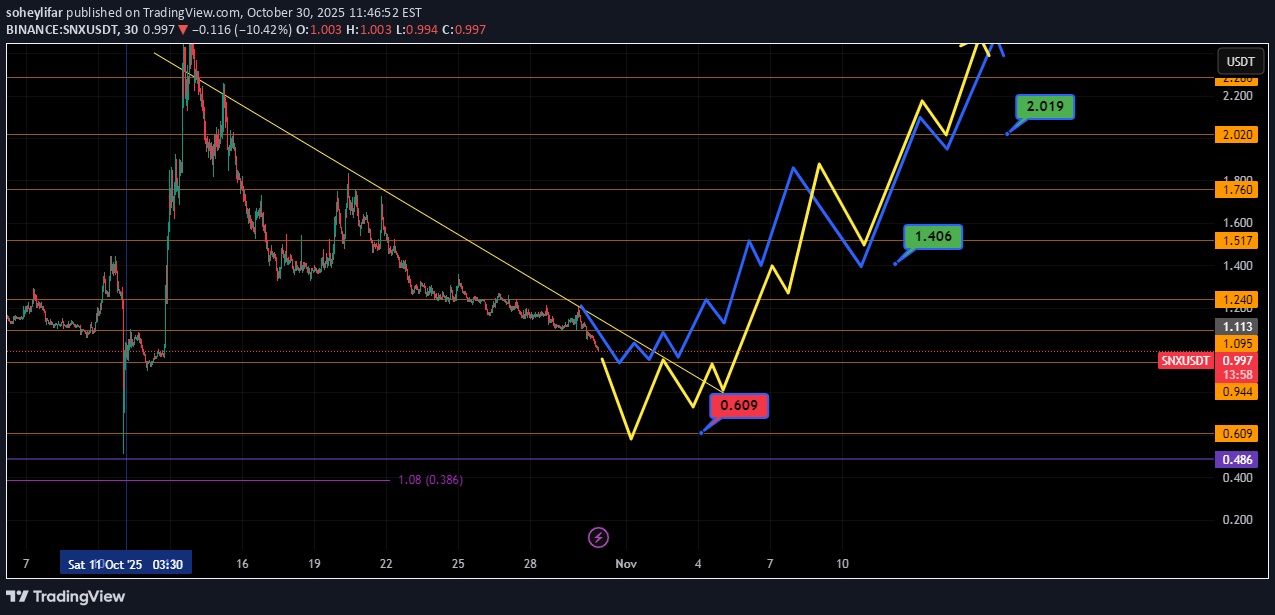
Dear Friends, by reviewing the chart , the trader may be speechless for a while by following candles in bulish and bearish moves. it is really wild. Synthetix is an ERC-20 token created by the Synthetix protocol that serves multiple purposes. In addition to serving as collateral on the protocol, by staking SNX, a holder will receive a portion of trading fees from the network as an incentive to contribute to the liquidity pools. This token is worth having in your wallet in small amounts but wait and buy at the lowest price. this is just my personal idea and please investigate before buying. regrds,
Disclaimer
Any content and materials included in Sahmeto's website and official communication channels are a compilation of personal opinions and analyses and are not binding. They do not constitute any recommendation for buying, selling, entering or exiting the stock market and cryptocurrency market. Also, all news and analyses included in the website and channels are merely republished information from official and unofficial domestic and foreign sources, and it is obvious that users of the said content are responsible for following up and ensuring the authenticity and accuracy of the materials. Therefore, while disclaiming responsibility, it is declared that the responsibility for any decision-making, action, and potential profit and loss in the capital market and cryptocurrency market lies with the trader.