
FX_Professor
@t_FX_Professor

What symbols does the trader recommend buying?
Purchase History
پیام های تریدر
Filter
FX_Professor
Bitcoin Is Still 27% Undervalued — Eyes on the Levels
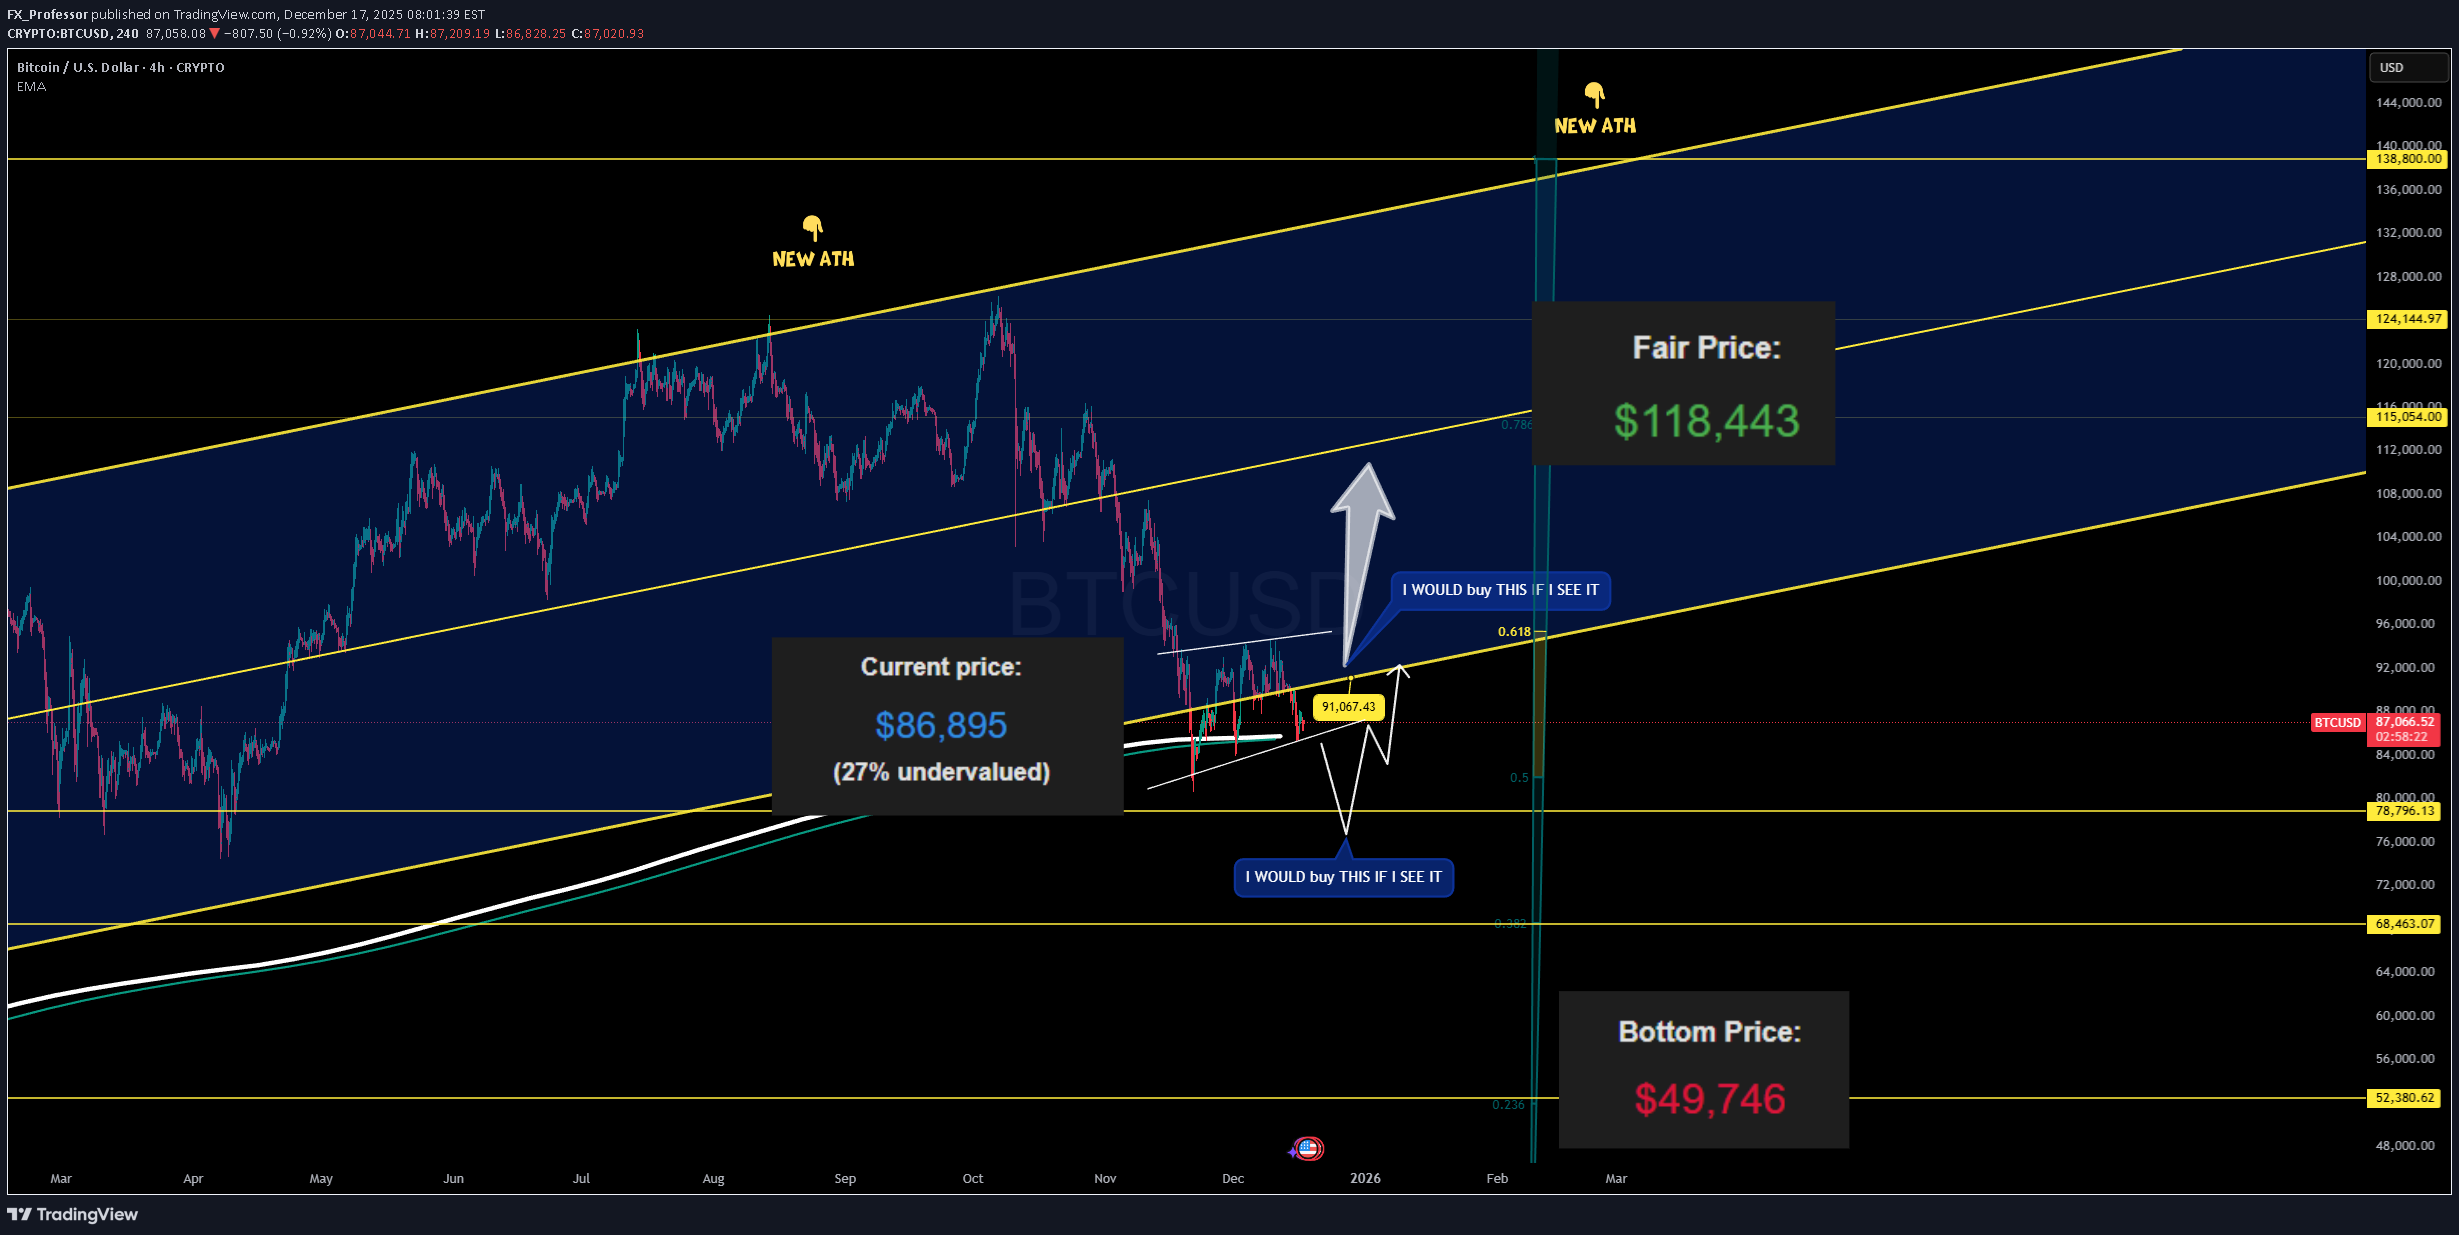
📌 Bitcoin Is Still 27% Undervalued — Eyes on the Levels 📈 Current price: $86,895 Fair price: $118,443 (Power Law Model) Bottom price: $49,746 — historically never violated. We remain in the upward sloping power law channel. As it stands, Bitcoin is 27% undervalued , holding above the dynamic EMA and within range of key decision levels. Main support sits at $78,796 , but expect a quick wick below it — those are the buys I wait for. Main resistance sits at $91,067 — if I see a breakout above, I buy that too. Fair value will be lowered by 29% soon to reflect time spent under the mean — but the formula itself stays unchanged. Bitcoin is still the only asset that fits this curve. 🔒 I never go short on Bitcoin. Why? Because if BTC drops 2%, some alts will drop 20%. I hedge with those instead — not with BTC. Know your tools, protect your capital. DYOR Trading Wisdom 📜 You don’t need to catch the bottom or the top. Just understand the levels and be ready when price comes to them. When you're prepared, you don't chase — you execute. Disclaimer: I'm not a financial advisor — I'm just a trader sharing my chart and opinion. This is how I see the market. Always do your own research and manage your risk accordingly. One Love, The FXPROFESSOR 💙 🧠 Know the Fundamentals Before you trade the levels, understand the asset. Bitcoin isn’t just price action — it’s a response to broken monetary systems, a hedge against inflation, and a protocol for digital scarcity. The more you grasp what problems it solves, the clearer your conviction becomes when volatility hits. And that is the compass to follow..just remember to have patience, persistance and a risk management in place.
FX_Professor
بیت کوین به کانال صعودی برگشت؛ هدف جدید سقف تاریخی بعدی!
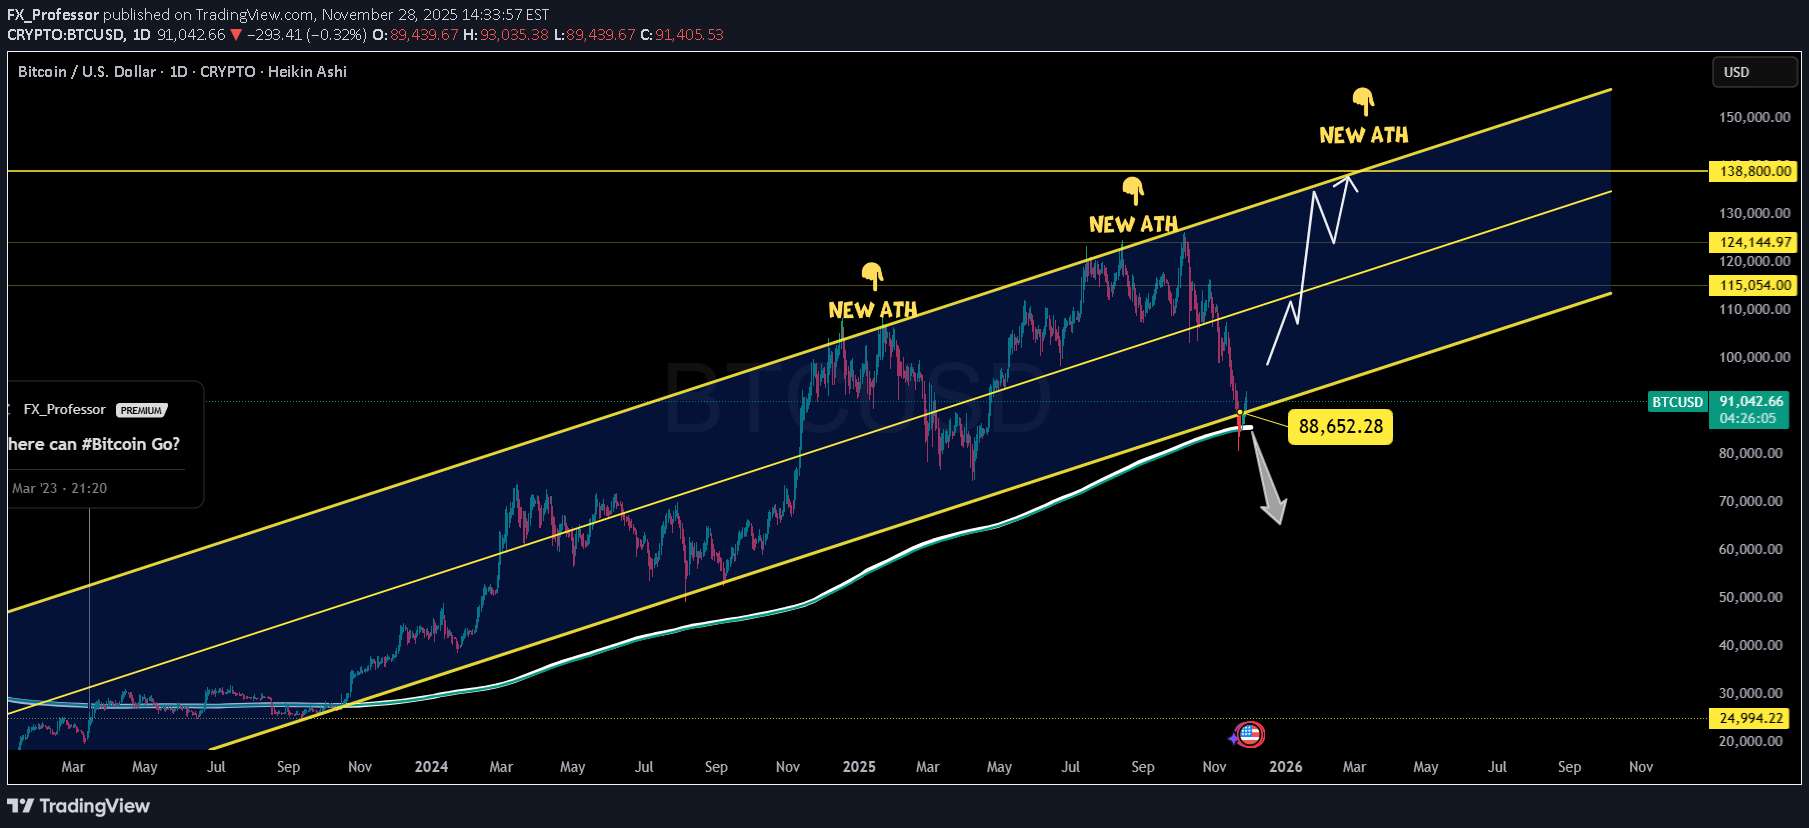
Bitcoin: Back in the Channel – Eyes on New ATHs Ahead 🚀 We're slowly seeing confidence return… and this is not just another bounce. This chart shows BTC reclaiming the massive ascending channel that has governed price action since early 2023. Price just wicked perfectly back into structure — a key reclaim above 88,652 has flipped the narrative back in the bulls' favor. 📈 Three key things stand out: Channel structure is intact — this is a clean re-entry. Support held above 88,652 — major validation point. Targets now shift to 115,054 → 124,144 → 138,800 — each level has history and structure behind it. New ATHs may not come tomorrow, but with this kind of technical structure, early 2026 could bring serious fireworks . If the bulls stay disciplined, this is a textbook reaccumulation setup inside a macro trend. Longs are valid as long as we hold above 88,652. Let price do the talking. Thought of the Day 💡 Respect the structure, not the emotions. Charts like this don’t lie — it's the humans that waver. The higher the timeframe, the stronger the truth. Disclaimer: What you read here is not financial advice — it’s high-level market philosophy from the FXPROFESSOR himself. Risk is real, and your capital is your responsibility. Learn, adapt, evolve. One Love, The FXPROFESSOR 💙 My worries: 79k was NOT checked as support And that is the major support on my chart. There is still over 40% likely that we need to check that 79k level.... but hey: i will be LONG over 88,652 — eyes on 115K → 124K → 138K 🚀 (just remember to play the levels: long over/short under!)updated chart and levelsJust a little update gift to all our friends on tradingview: my intraday levels:
FX_Professor
بیت کوین در کانال صعودی: تحلیل دقیق سطوح کلیدی و هدف ۱۰۰،۶۲۶ دلار!

Yesterday's exit was clean — rejection + Bitcoin dominance on support. Let’s break it down 🔍 📊 Bitcoin Dominance Currently bouncing off key support at ~59.76 . Unless this level is lost, altcoins likely stay weak. Dominance rising = no altseason. When it dumped last time, Ethereum exploded. Today? We're neutral to bullish on BTC. 🪜 Bitcoin Chart Setup Big picture: In a descending macro channel Inside it, a smaller ascending channel = current trade zone 📌 Key Levels for Day Trading: Support: 105,000 Mid-level: 106,261 Resistance: 107,000 Macro Bull Trigger: 109,898 Macro Bear Trigger: 104,405 If we lose 104,405 — short time. If we reclaim 106,261 — stay long. 🧠 Momentum + divergences + my FxProfessor MA combo are pointing higher. So yeah — I expect 106.2K to get tapped today. 📍 Alerts are ON. Precision mode. 💬 Today’s a double day — 11.11. Is 111,111 next? You tell me. Just play your levels. I do. Mindset Check 🧘 If you’re guessing, you’re gambling. I don’t guess. I read structure, I react, I act. Want to survive this market? Play like it’s chess, not roulette. Not sure where it's going? Hedge! Disclaimer Hey — I’m a day trader. I play the levels. I don’t know what you’re doing i just share what I do! One Love, The FXPROFESSOR 💙
FX_Professor
بیت کوین به ۱۱۰ هزار دلار میرسد؟ تحلیل دقیق مسیر صعودی BTC و سطوح کلیدی حمایت و مقاومت

📉 BTCUSD – Perfect Mid-Channel Touch. Eyes on 110K BTCUSD – Perfect Mid-Channel Touch. Eyes on 110K 🔁📈 Price bounced beautifully off Channel Support ~98,986 and is now hovering just above Mid S/R at 104,634 . That’s the make-or-break zone . A move toward Top Channel Resistance ~110,080 seems likely — but watch that interaction closely. No “traps,” no fluff — this is a textbook channel play. 🎯 Targets Above: • Target 1: 120–122K • Target 2: 138.8K 📉 Supports Below: • Mid Channel: 104,634 • Channel Support: 98,986 • Technical Support: 97,389 → 96,281 ⚠️ If BTC breaks below the mid-line again, bears may try to retest the green base. For now — structure holds. Trading Wisdom 📜 You don’t chase Bitcoin. You position around it. Let the structure guide you. The crowd reacts — the Professor prepares. Disclaimer: I’m just sharing wisdom, not instructions. No licenses, no guarantees — just years of trading scars and precision chartwork. Be smart, protect your capital, and don’t copy blindly. One Love, The FXPROFESSOR 💙
FX_Professor
آرویو (Arweave): نگین فراموششده وب 3 که اینترنت را برای همیشه ذخیره میکند!
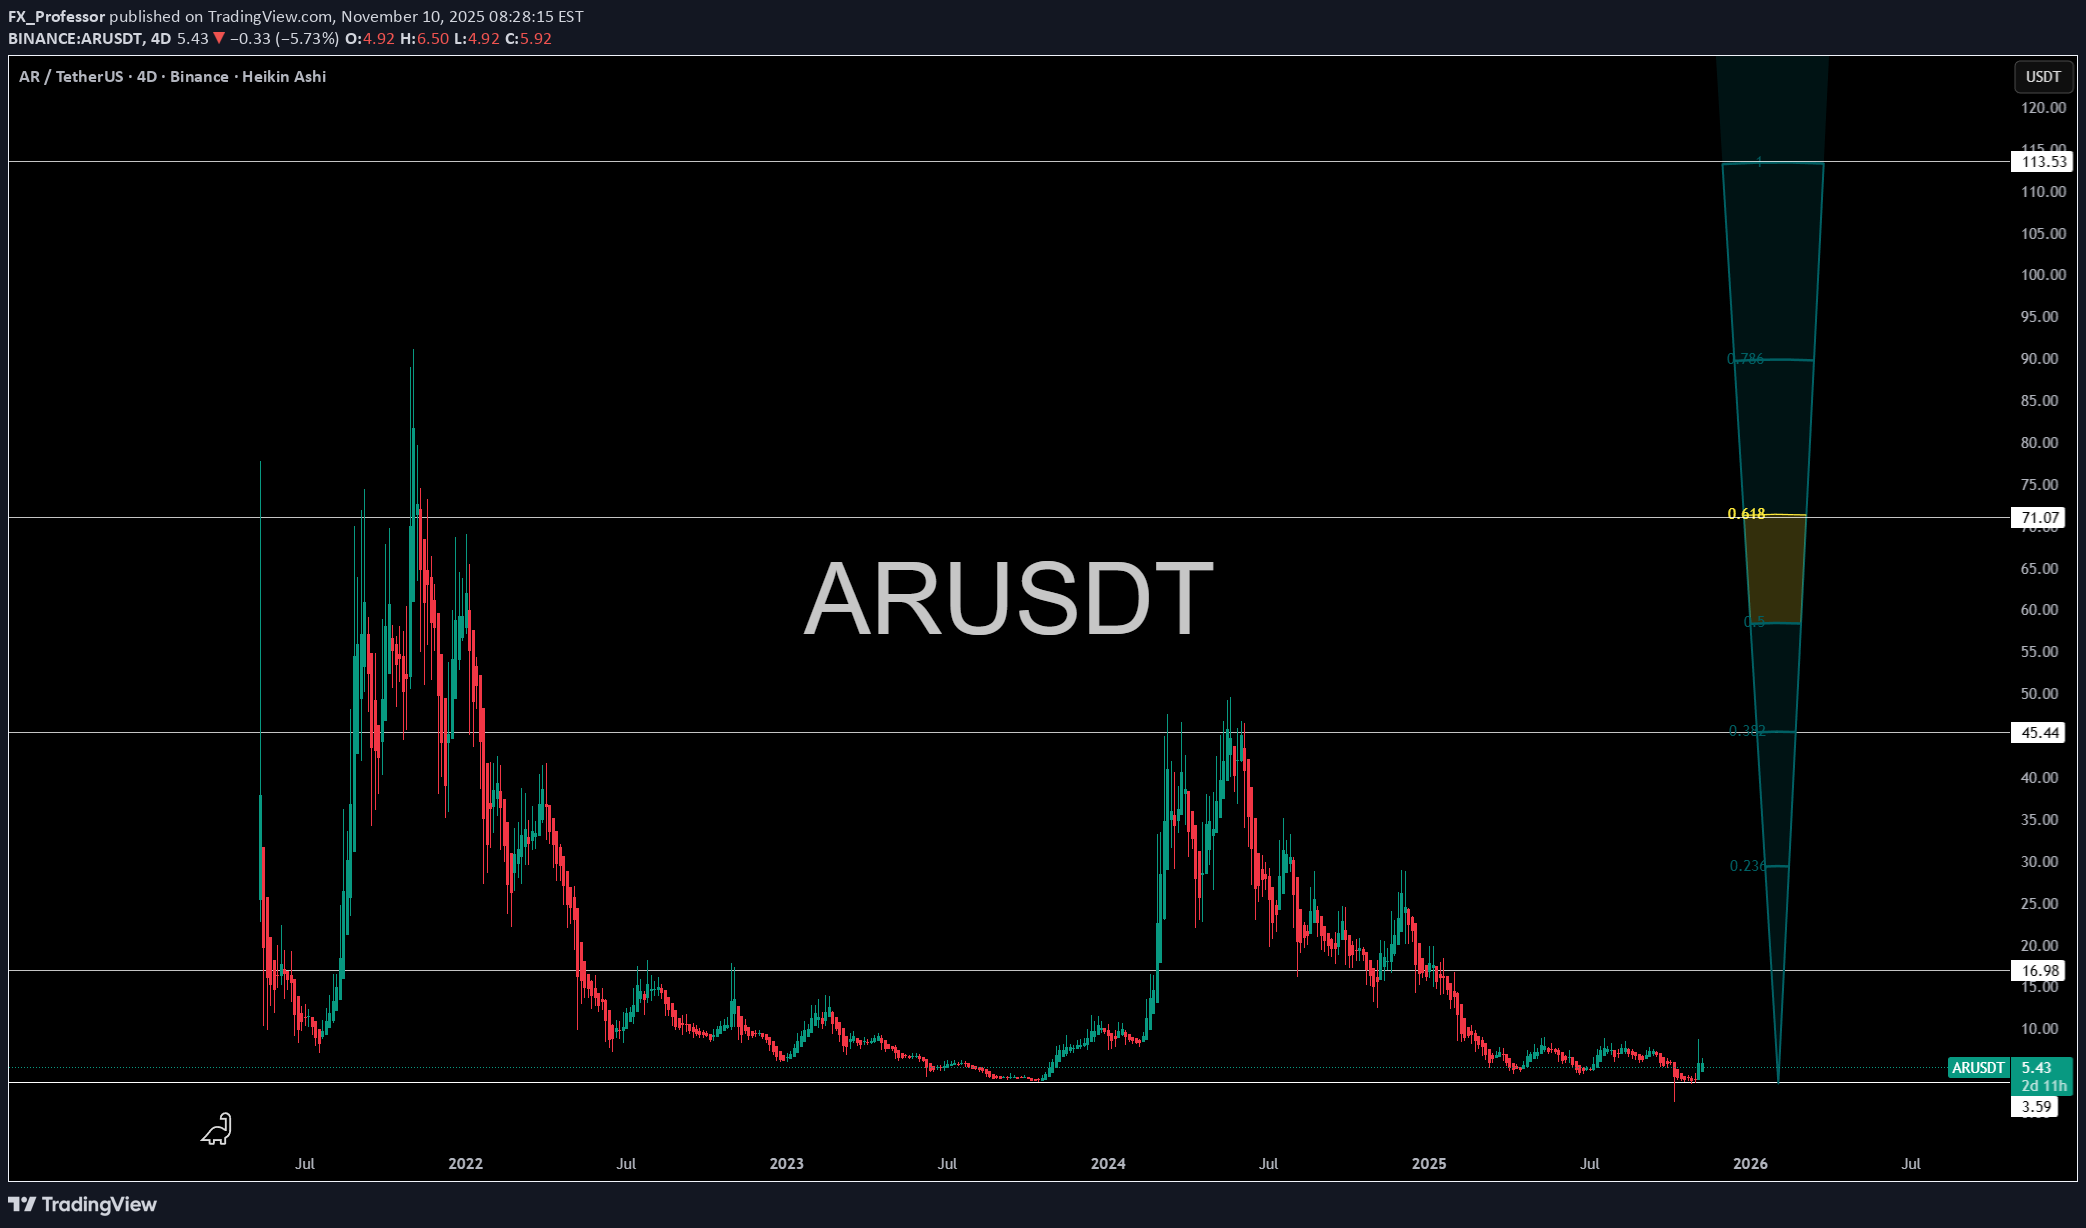
Arweave – The Forgotten Web3 Infrastructure Gem 🌐🧠 ARUSDT just bounced from a brutal multi-year base near $5 — but this isn’t just another altcoin. Arweave powers the permanent web. A decentralized data layer where information lives forever — not 30 days, not 30 years. Forever. It’s Bitcoin for storage, backed by the MIT License (2025) and built for one mission: data immortality . What’s wild? Major chains and dApps already use it to store: NFT metadata On-chain governance archives Front-ends for fully decentralized apps 📊 Chartwise: $5.42 current $16.98 first key resistance $45.44 → $71.07 → $113.53 are the next Fibonacci zones if this cycle fully rotates The rabbit hole is deep. But if the internet ever truly decentralizes, Arweave will be the hard drive it lives on. Perspective Shift 🔄 Most people chase tokens that “do something.” Arweave stores the entire narrative. And in a digital world, storage is everything. Disclaimer: I’m just sharing wisdom, not instructions. No licenses, no guarantees — just years of trading scars and precision chartwork. Be smart, protect your capital, and don’t copy blindly. One Love, The FXPROFESSOR 💙
FX_Professor
توکن SNX (غول دیفای) بیدار شده است؟ فرصت خرید در کف تاریخی!

SNX – The OG DeFi Token Awakens? 🧬🚀 Synthetix (SNX) is back on the radar, trading just above its historic base at $0.78–$0.88 — the same accumulation zone that birthed past monster runs. This isn’t just nostalgia. The OG DeFi protocol is launching a new DEX in the coming weeks, built on L2 Ethereum. And yes — SNX was the first perpetuals DEX on-chain before it was even cool. 📊 Current Setup: Strong base at $0.78–$0.88 Resistance targets: $2.04 → $5.08 → $14.06 Macro extension: $22.04 zone if cycle rotates full DeFi 🔁 You’re looking at a classic bottom formation across both short- and long-term timeframes. Accumulation + news = ignition risk. Synthetix is part of DeFi history — and possibly its future if the new DEX delivers. Mindset Check 🧘 DeFi summer may be long gone, but real builders never left. The best setups are always born in silence. Disclaimer: I'm not a financial advisor, but I am the best prognosis you’ll ever get. Better than AI. Better than the herd. Still, this ain’t advice — it's education. And risk? That’s always yours. One Love, The FXPROFESSOR 💙
FX_Professor
راز نمودارهای حرفهای ZECUSD: چگونه از صفر تا صد نمودار میسازم؟ (آموزش ساخت)

ZECUSD | How I Build Charts From Scratch (Educational Post) 🎓📊 This post is a direct follow-up to the video breakdown I shared earlier — and this chart shows the final result after going through the full FXPROFESSOR process . 🧠 What’s different here? We now see the full level structure come to life . Four main historical zones are layered in. Each level has been respected by price across timeframes — from support flips to breakout launches. It’s all about how memory guides momentum. 🔁 💡 The Fibonacci wedge confirms our structure beautifully, especially the 0.618 zone up at 687.39 — and potentially 773.89 should the move extend. The blue box around 372.31 is where structure broke out and became acceleration. It’s also the zone where anyone trying to chase early probably gave up — and that’s exactly where structure rewards patience. This post isn’t a call — it’s an invitation to learn how to read the story inside the candles . 🎥 Watch the full video to see how I built this chart from the ground up, including: How I pick the best chart version (hint: history wins) Why true support/resistance is timeless How to make Fibonacci confirm your bias (not lead it) 📎 https://www.tradingview.com/chart/ZECUSD/cYDtkwC1-The-FX-Professor-Charting-Process-in-Action/ Trading Wisdom 📜 Anyone can copy levels — few can understand them. You don’t need 10 indicators to chart like a pro. Just structure, context, and memory. Tools serve the method — not the other way around. Disclaimer Disclaimer: What you read here is not financial advice — it’s high-level market philosophy from the FXPROFESSOR himself. Risk is real, and your capital is your responsibility. Learn, adapt, evolve. One Love, The FXPROFESSOR 💙
FX_Professor
راز ساخت نمودار معاملاتی حرفهای: آموزش گام به گام سطوح کلیدی فارکس

The FX Professor Charting Process in Action 🧠📊 In this educational breakdown, I walk you through how I build levels and structure a chart from scratch — FXPROFESSOR style — using ZECUSD as a live example 📉📈 1. The process always starts with selecting the deepest chart history possible — the further back in time, the more reliable the zones. In this case, I favored Kraken's ZEC chart as it gave me data dating back to 2017 versus 2021. That’s a critical edge. 2. From there, we built 4 major levels based on clean support/resistance flips across time — using both daily and 12-hour zooms to confirm. I emphasized that we: Don’t chase pumps (this isn’t a trade setup, it’s a lesson) Layer in levels from the oldest clean structure possible Validate using Fibonacci wedge confirmations 🔍 As seen on the chart: Breakouts came after respecting legacy zones 3, Fibonacci aligned near perfectly with my second level, confirming 0.618 golden zone projections and showing confluence into 687 as a potential upside target (should continuation happen) Most traders slap fibs high to low — I use it differently. Structure first. Fibs second. This chart is not a signal — it’s a masterclass in technical charting logic and how to anchor your analysis around real price memory and reaction zones. 4. Alerts. Thank God there is Tradingview. 5. Food for Thought 🍃 Most traders skip history and jump into price action with no memory. But a chart without memory is a trade without a thesis. Structure beats speed. Every. Single. Time. 📚 Disclaimer: I’m just sharing wisdom, not instructions. No licenses, no guarantees — just years of trading scars and precision chartwork. Be smart, protect your capital, and don’t copy blindly....Remember to PLAY the LEVELS One Love, The FXPROFESSOR 💙
FX_Professor
بیت کوین در آستانه انفجار؟ حمایت حیاتی ۱۰۰ هزار دلاری و هدف بعدی بیتکوین کجاست؟

📉 BTC at Double Channel Support — Next Impulse Loading? 🎯 Bitcoin is currently testing a double channel confluence support near $100,211 , a level that’s been both technically and psychologically relevant across the 15m, 1H, and 4H views. The left pane shows the descending red channel, where price just wicked below support and reclaimed — a signal we’ve seen in prior reversals. The right pane highlights the broader blue/green support — creating a high-probability reaction zone. 🔹 Technical Support: $100,211 🔹 Local Resistance: $105,161 → $110,596 🔹 Major Target: $122,955 - $138,888 zone The bullish case strengthens if BTC flips $105,161 on strong volume. But failure to hold $100K opens doors to $97,389 and $96,821 next. Zooming out: this is a classic inflection zone — the reaction here could define BTC's next multi-thousand move. 🛠️ Smart traders aren't guessing — they’re preparing for both outcomes. Trading Wisdom 📜 Inflection points > predictions. In markets, it’s not about being right — it’s about being ready. If this is the bottom, let the chart prove it before the ego jumps in. 🎯 Disclaimer Disclaimer: I’m just sharing wisdom, not instructions. No licenses, no guarantees — just years of trading scars and precision chartwork. Be smart, protect your capital, and don’t copy blindly. 138k remains my target for the year guys..let's see! One Love, The FXPROFESSOR 💙 A lot of people ask how I trade — truth is, it’s pretty simple. I have a daily budget, and I enjoy trading. I’ve moved away from getting married to altcoins, so you’ll notice I post less of them lately. But I still trade every day. I buy dips around key support/resistance levels and exit just below if invalidated. Sometimes it takes more than one attempt, but patience is part of the game. Yes, I use high leverage — that’s my style, and it keeps me engaged. The real secret? Take some profit when it works. That’s it. 💙
FX_Professor
سطوح حیاتی بیت کوین برای این جمعه: آماده نوسان بزرگ CPI باشید!

It’s Friday Again — BTC Levels to Watch Closely 📊 Last Friday was wild, but today’s setup is different. We’re approaching resistance (111,948) , and that means patience is key. CPI data is coming, and that will guide the short-term move — not predictions, just reactions. Here are the levels I’m watching: 🔹 Resistance: 111,948 🔹 Possible breakout: 115,600 🔹 Support zone: 110,649 → 108,000 → 107,204 No need to overthink it — trade the levels, not emotions. Fridays are for discipline, not drama. Trading Wisdom 📜 The best traders don’t chase breakouts — they prepare for both outcomes. Balance your bias with patience. Disclaimer: Disclaimer: I’m not a financial advisor — I’m a master of Prognosis. These are my personal views. I read charts like a poet reads the stars. You still gotta trade at your own risk. 🧠💥 One Love, The FXPROFESSOR 💙
Disclaimer
Any content and materials included in Sahmeto's website and official communication channels are a compilation of personal opinions and analyses and are not binding. They do not constitute any recommendation for buying, selling, entering or exiting the stock market and cryptocurrency market. Also, all news and analyses included in the website and channels are merely republished information from official and unofficial domestic and foreign sources, and it is obvious that users of the said content are responsible for following up and ensuring the authenticity and accuracy of the materials. Therefore, while disclaiming responsibility, it is declared that the responsibility for any decision-making, action, and potential profit and loss in the capital market and cryptocurrency market lies with the trader.