
RVN
Ravencoin
| تریدر | نوع سیگنال | حد سود/ضرر | زمان انتشار | مشاهده پیام |
|---|---|---|---|---|
No results found. | ||||
Price Chart of Ravencoin
سود 3 Months :
سیگنالهای Ravencoin
Filter
Sort messages by
Trader Type
Time Frame
Silvio_TraderskyZahvat
rvn ready to tern ?
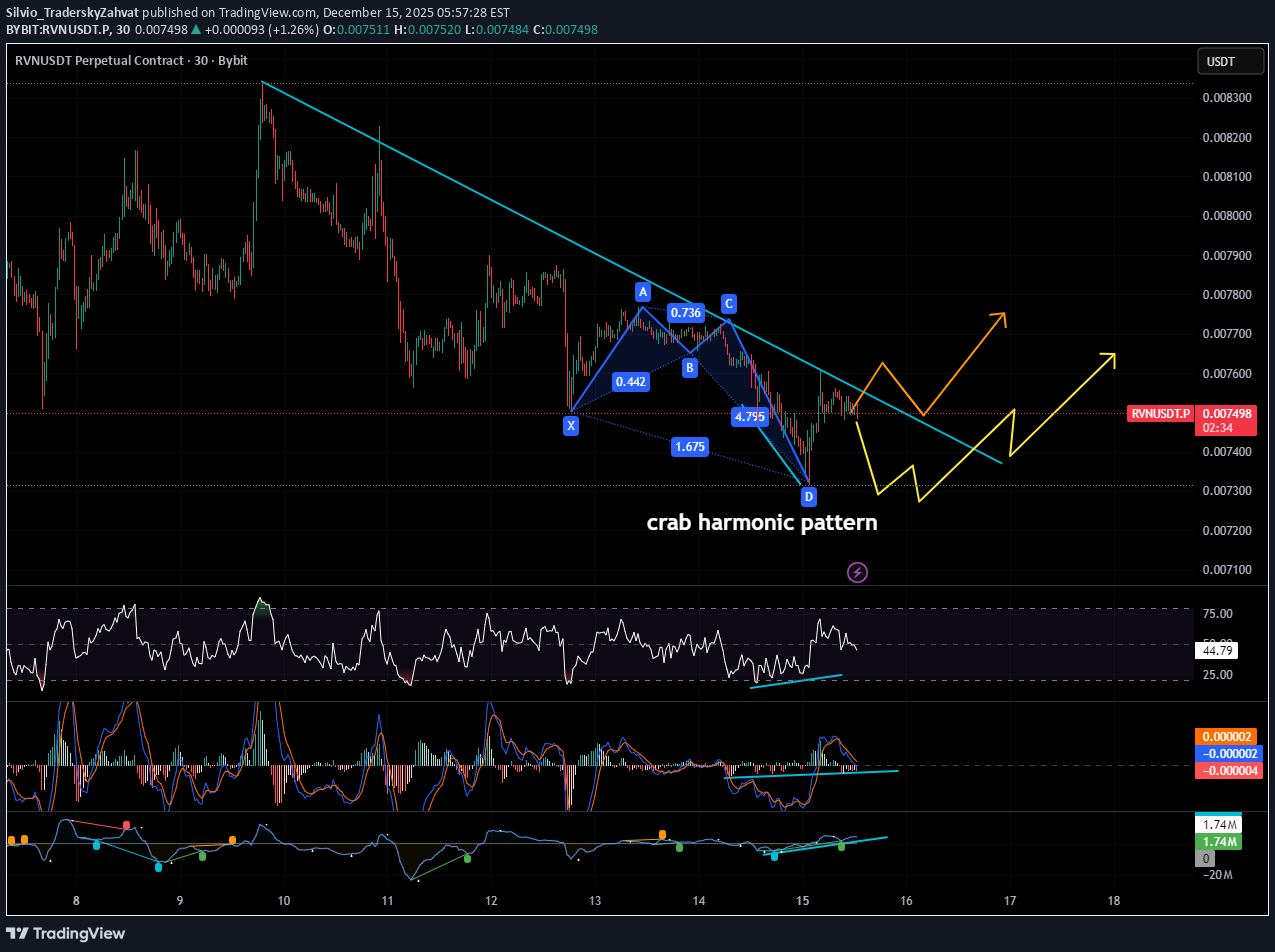
A divergence is forming, along with a harmonic reversal pattern (Crab) below the trendline. A potential entry can be considered on a trendline breakout as price continues to move lower. A safer approach is to wait for a retest after the breakout.

sakicasignals
تشکیل گوه صعودی در RVN/USDT: هفته آینده رمز ارز رِوِن صعودی میشود؟

Bullish wedge is forming good to rvn Next week it will show is it strong sign or no

Bithereum_io
رایزون (RVN) شکسته شد: اهداف قیمتی هیجانانگیز برای ترید روزانه!

#RVN has broken above the falling wedge resistance and the daily SMA50 with strong volume — looking promising. The upside targets are: 🎯 $0.01340 🎯 $0.01495 🎯 $0.01650 🎯 $0.01870 🎯 $0.02151 ⚠️ Always remember to use a tight stop-loss and maintain proper risk management.

asilturk
تحلیل شگفتانگیز RVN: آیا این ارز دیجیتال آماده جهش بزرگ است؟
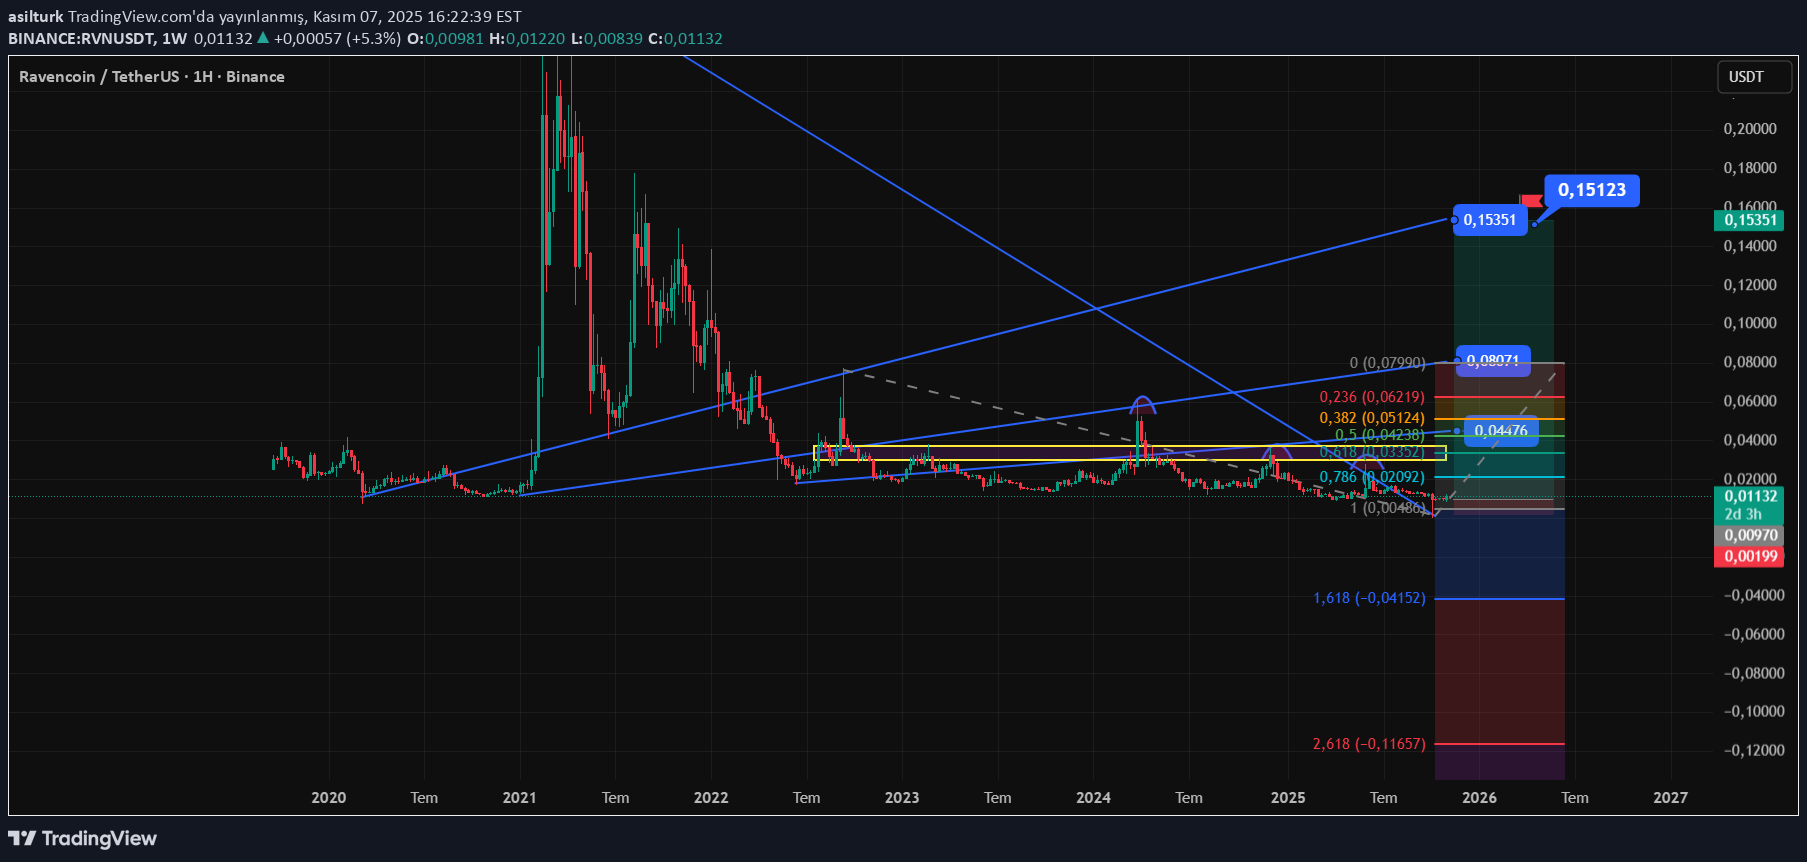
Another alt coin that we will share today and add to the portfolio is Raven Market value is 237 Million dollars. It has a maximum supply of 211 billion units in total, but there are 16 million units in circulation. The platform concentration value is 2.86. It should be noted that the market dominance weight is 0.0051%. Technically speaking, RVN Ravencoin, which is currently in the price band of 0.01136$, currently has a transaction volume of 20 Million dollars. RVN It seems to have completed the correction with a weekly rising trend in the pow group. I believe that the sequential targets specified in the chart for RVN in the pow group, such as ZEC-ZEN-DASH-DCR-XVG in the pow group we shared before, will be realized in the medium and long term. As a result, while we are waiting for an exciting process for RVN spot investors in the coming days, the serious volume increases and percentage changes in alt coins, as we stated and predicted in the graphs we shared last month, have once again shown that we were right about our predictions about the volume increases and new price targets in alt coins. I wish you pleasant spending...

BandForBands
آلتکوین پتانسیل ۵۵۰٪ رشد: رازهای پنهان RVN و کف قیمتی تاریخی!
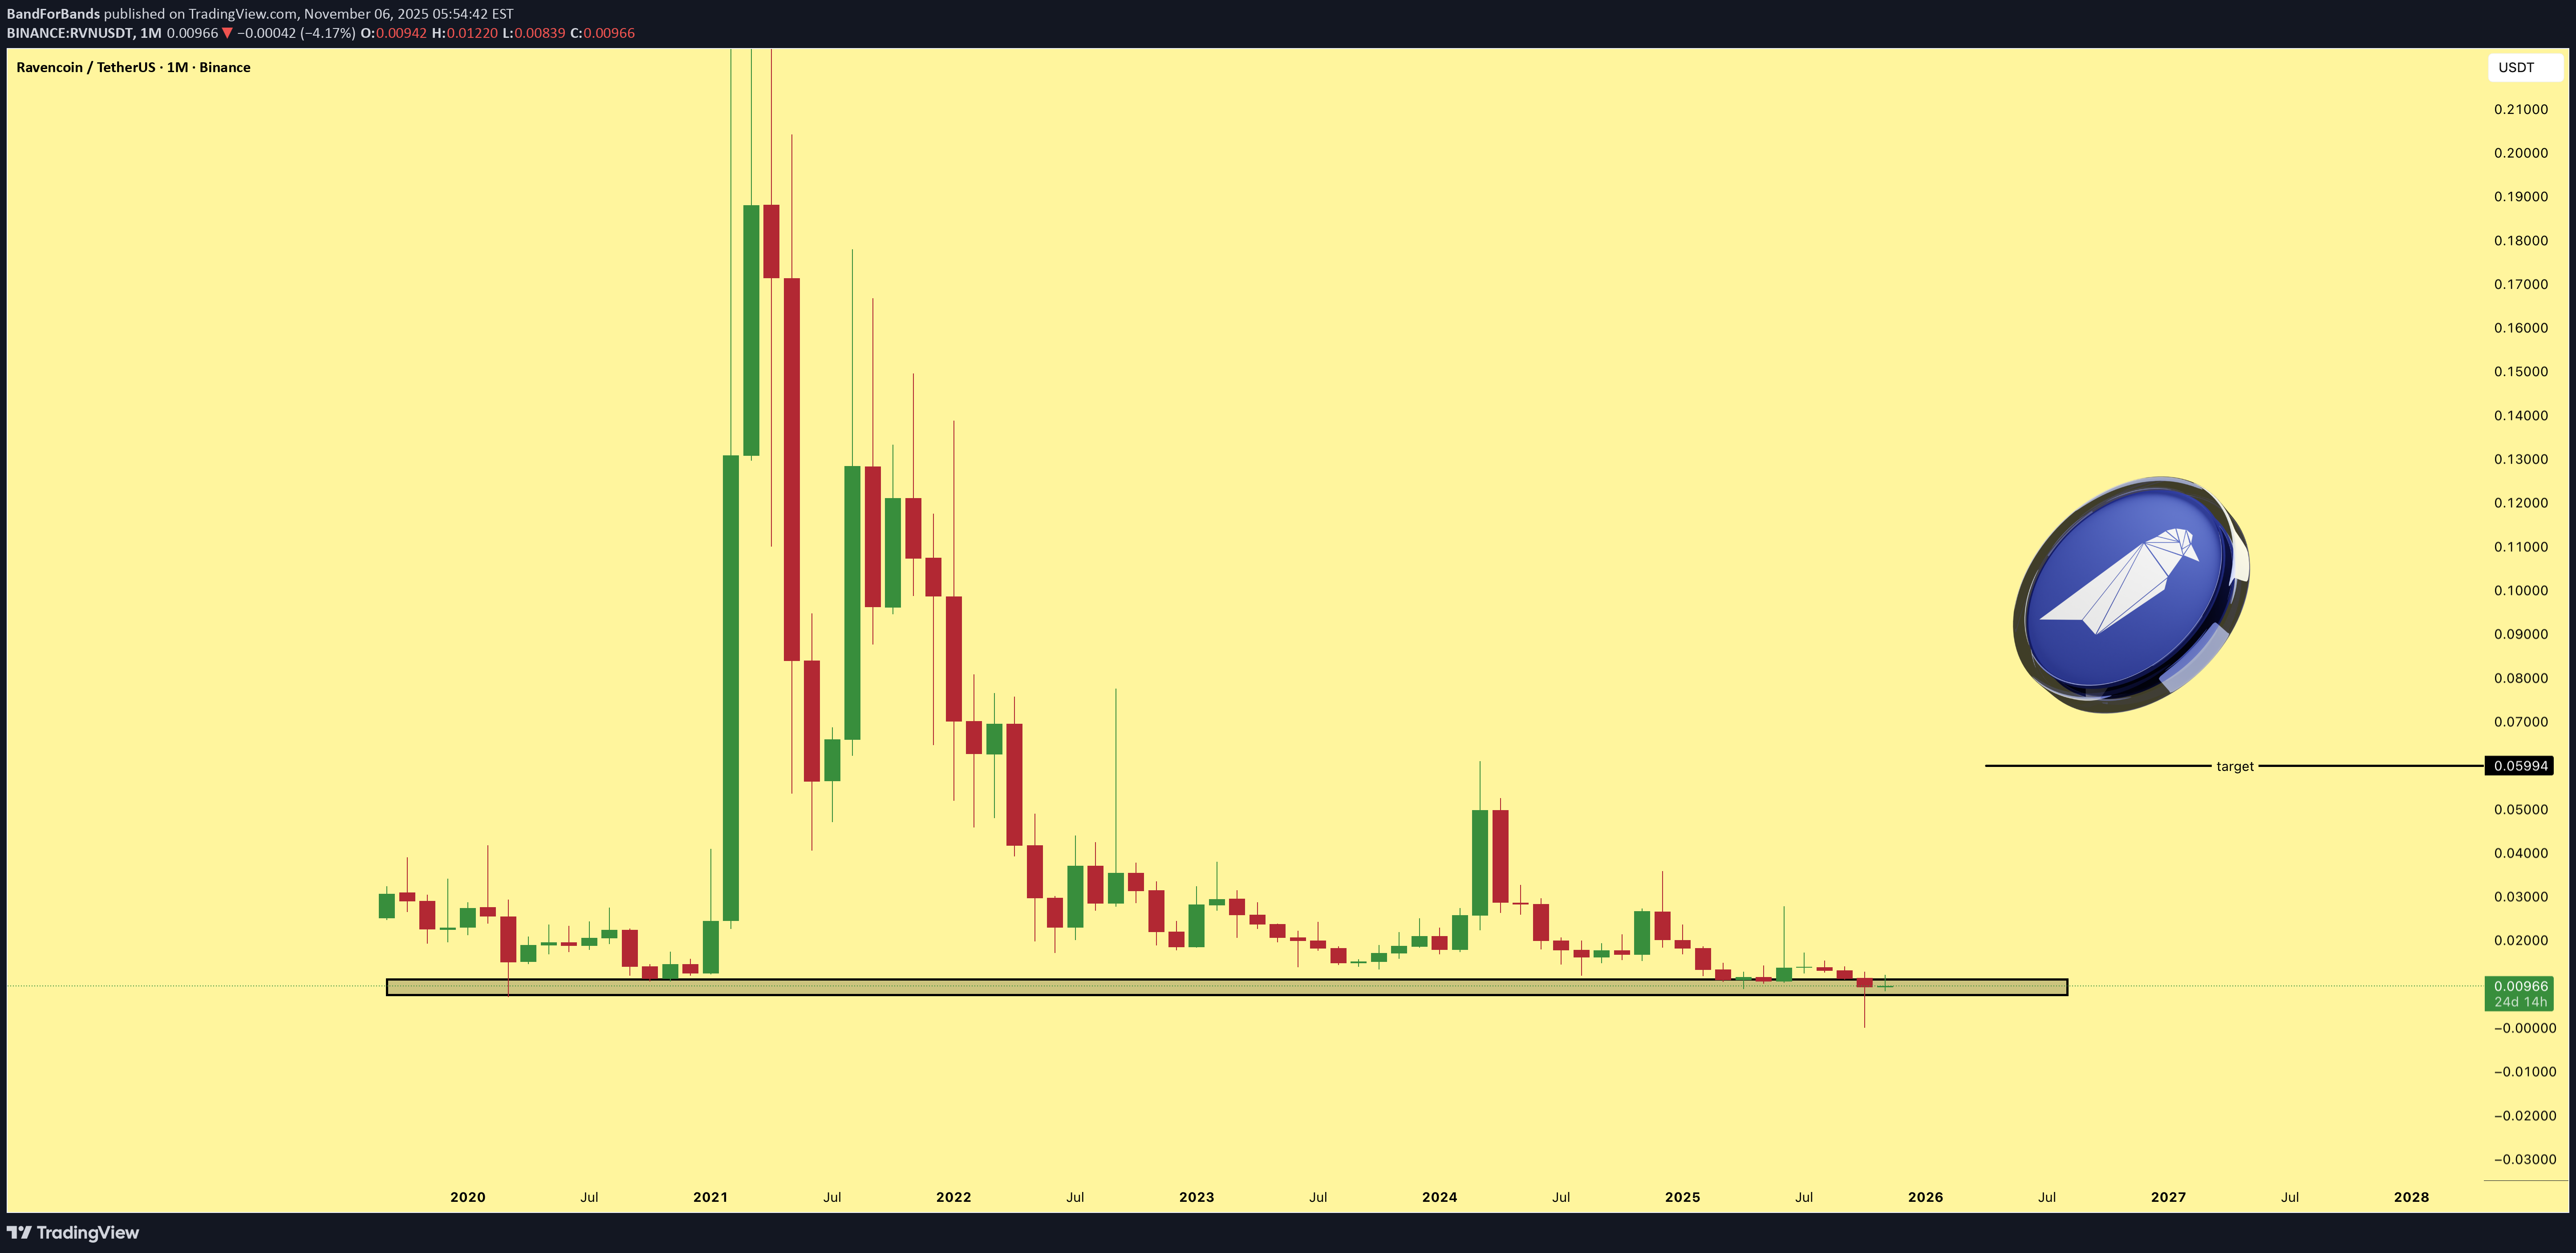
RVN is an old school coin that has built a solid floor over the years. Historically, it has shown strong reactions each time price returned to this level. From the current range, there’s a potential 550% gain on the table. Structure and history both support the setup.

Arthur_de_Vrome
راونکوین (RVN): کفشکنی، پاکسازی و بازگشت بزرگ! آیا این پایان خروج و شروع صعود است؟

Summary Fantastic action from Ravencoin! Ravencoin (RVN) just delivered the kind of move that often marks true capitulation — a sharp flush that cleared leveraged positions, followed by an equally impressive recovery. Analysis Capitulation confirmed: The vertical drop washed out weak hands and excessive leverage. Volume spikes and long lower wicks are classic signs of exhaustion. Structure intact: Despite the volatility, RVN remains within its broader wedge formation. Support held, and the price rebounded fast — a strong technical sign. Momentum reset: RSI and Stoch RSI have reset from overheated levels, giving room for a sustainable upside push. This kind of “wash and recover” pattern often appears right before trend reversals, when leveraged traders are forced out and real accumulation begins. Outlook If follow-through continues and the price closes back above the midline of the channel, the next move could target the upper wedge resistance — potentially the start of a new leg upward. The market just flushed the leverage; now it may be time for the real move.
Bithereum_io
تحلیل فنی RVN: آیا کوین رابنوس در حال آماده شدن برای شکست سقف است؟ (با اهداف قیمتی!)

#RVN is trading within a falling wedge pattern on the daily chart. In case of a breakout above the wedge resistance, the potential targets are: 🎯 $0.01336 🎯 $0.01468 🎯 $0.01575 🎯 $0.01681 🎯 $0.01833 🎯 $0.02026 ⚠️ Always remember to use a tight stop-loss and maintain proper risk management.

MyCryptoParadise
آماده جهش انفجاری؟ تحلیل کامل و سطوح کلیدی صعودی #RVN (روی کوین)

Yello Paradisers! #RVN just broke out of the descending channel exactly as we expected... but will it hold this time, or is this another fakeout? Let’s break down this #Ravencoin setup: 💎#RVNUSDT has been trading inside a well-respected falling wedge since July. After multiple rejections from the descending resistance, the price is about to break out and close above the structure. This move will also reclaim the 50EMA, which will act as support. If this EMA continues to hold, it will increase the probability of continuation to the upside. 💎The key bullish confirmation here is not just the breakout, but the structure of support forming right above the previously broken resistance line. This creates a possible bullish flip, turning old resistance into new support — one of the cleanest continuation patterns we look for. 💎If the current breakout holds, the next target for #RVNUSD to watch is at 0.015. A clean daily close and hold above that level would open the door for a stronger move toward 0.018, which is the next major resistance zone based on the volume profile. 💎Price is now holding above the strong support at 0.01052, and as long as we remain above the demand zone between 0.01052 and 0.00943, the bullish setup is valid. This area is now our invalidation level. A break below this zone would invalidate the structure and open up further downside. Strive for consistency, wait for clear confirmations, and remember that discipline always beats chasing quick profits. MyCryptoParadise iFeel the success🌴
Arthur_de_Vrome
الگوی رازآلود رِیوِنکوین: چرا شکست قریبالوقوع است؟

https://www.tradingview.com/x/vBmMSdXu/ Ravencoin (RVN) continues to move inside the same structural rhythm we’ve seen before. The wedge timing, price compression, and sentiment all echo early-2021 conditions — and despite recent hesitation, the fractal remains intact. Context Structure: Price is still respecting the falling-wedge boundaries. No clean breakdown below support has occurred. Timing: The current pattern aligns with the 0.702 Fibonacci time ratio projected for this cycle. Sentiment: Just like January 2021, the market feels apathetic and doubtful — precisely when reversals tend to start. Invalidation: The thesis only fails if RVN wobbles for weeks inside the red zone or loses structure altogether. So far, that hasn’t happened. Conclusion The market can always surprise, but until the wedge support is clearly broken and time invalidates the 0.702 projection, the fractal is not falsified. Silence, doubt, and compression — the same ingredients that preceded RVN’s past breakout — are all still present. Until proven otherwise, the setup stands.

MasDem616
RVNUSDT - 1 SAAT
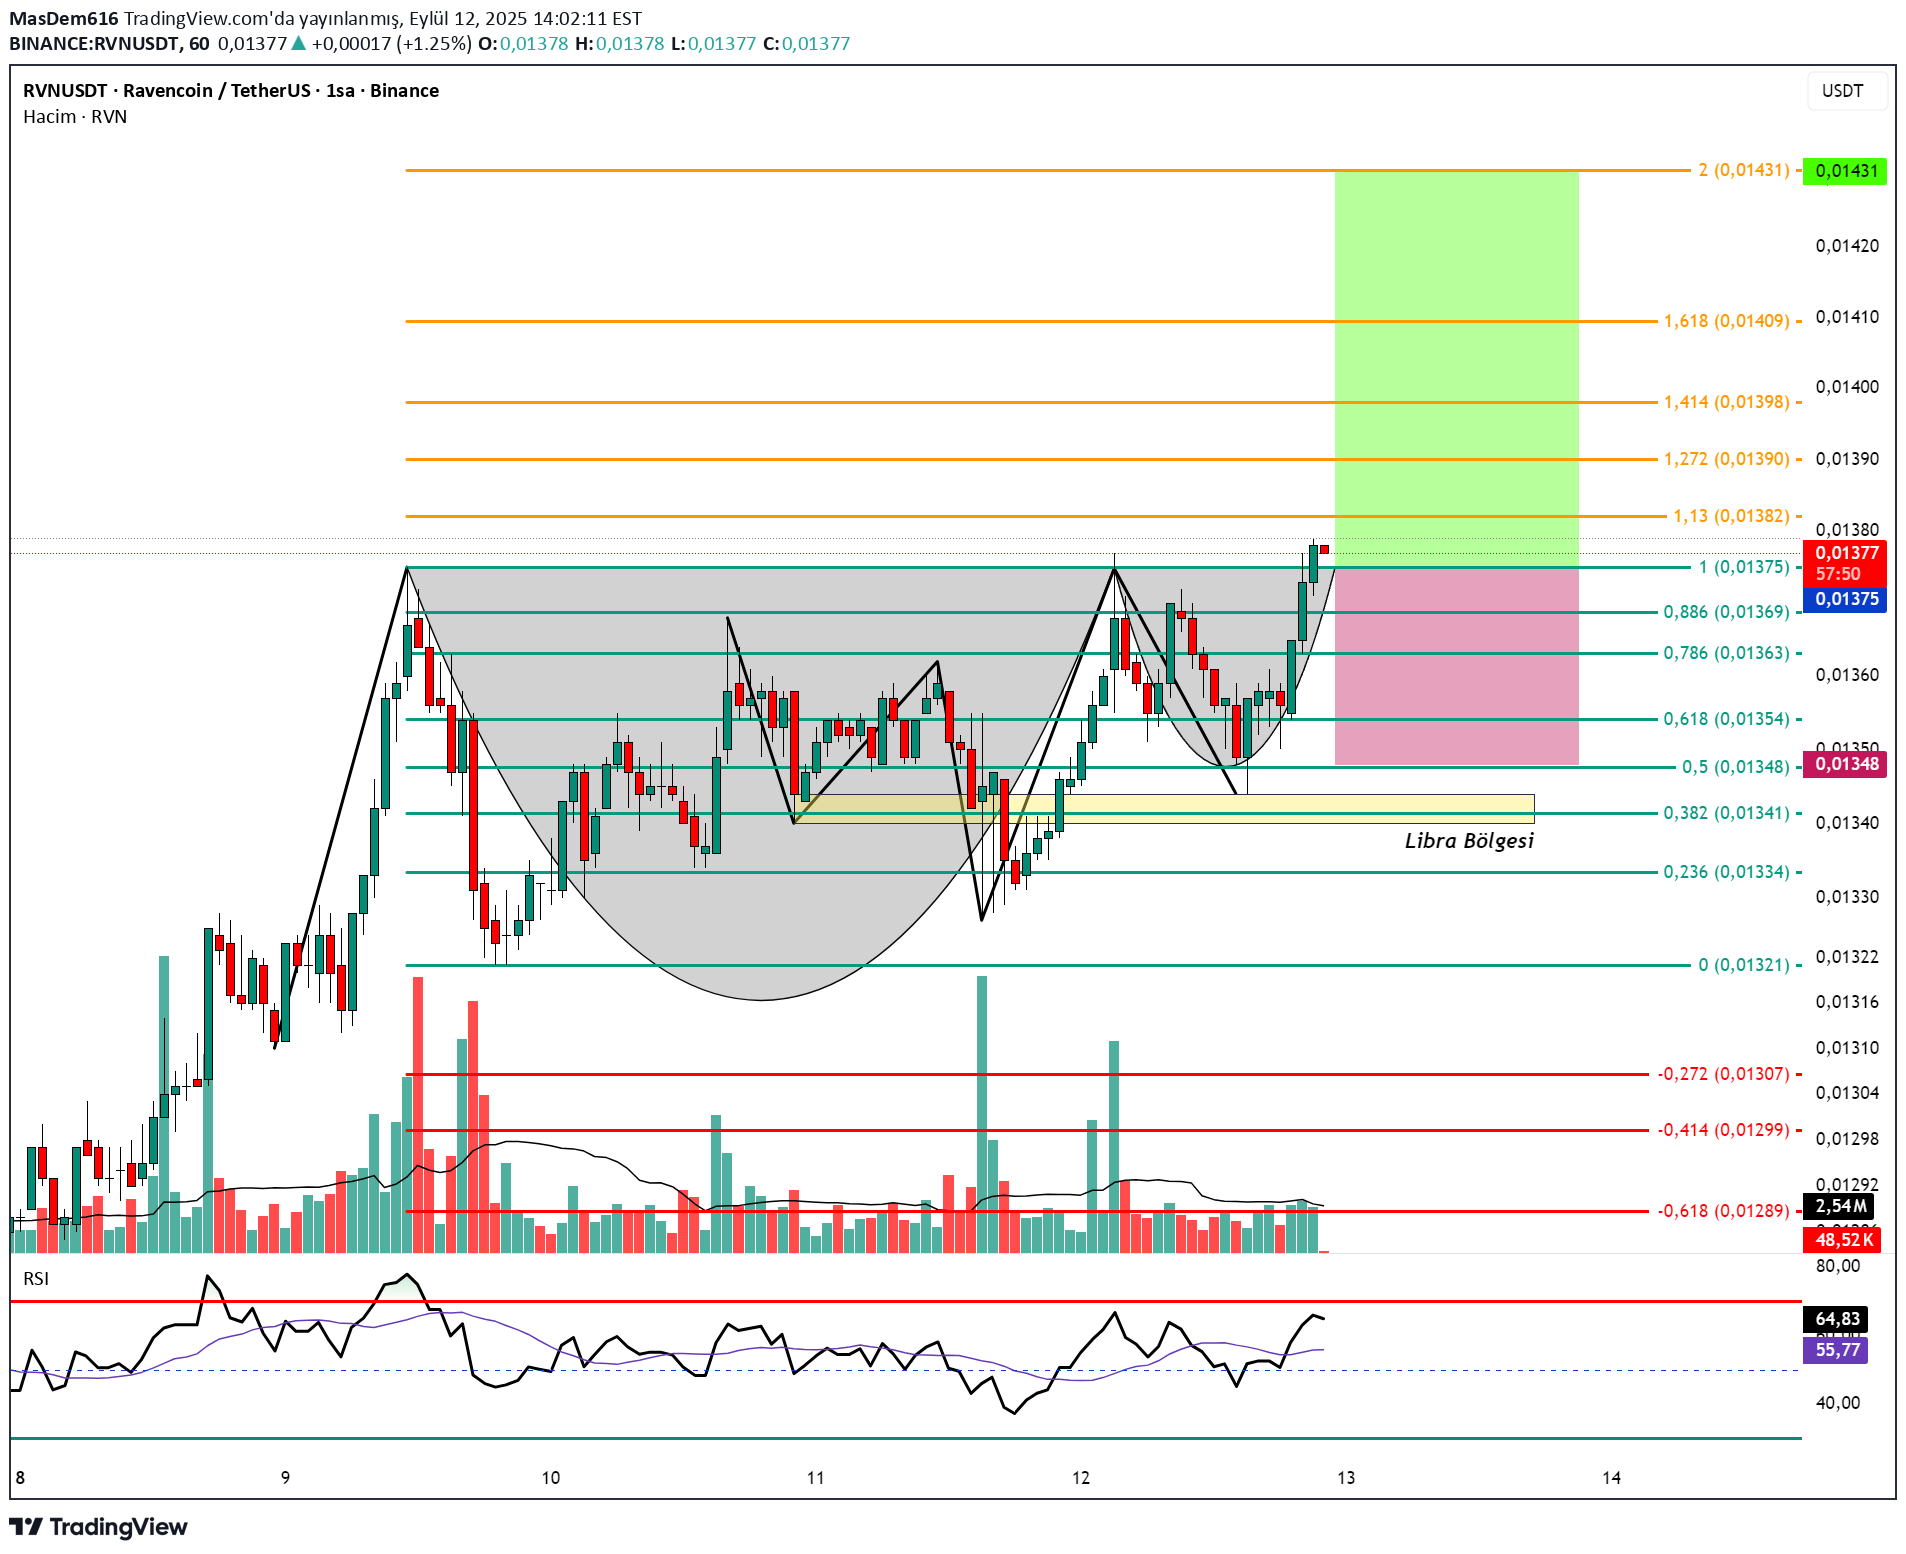
Cup Formation of Cup. The breakdown took place.
Disclaimer
Any content and materials included in Sahmeto's website and official communication channels are a compilation of personal opinions and analyses and are not binding. They do not constitute any recommendation for buying, selling, entering or exiting the stock market and cryptocurrency market. Also, all news and analyses included in the website and channels are merely republished information from official and unofficial domestic and foreign sources, and it is obvious that users of the said content are responsible for following up and ensuring the authenticity and accuracy of the materials. Therefore, while disclaiming responsibility, it is declared that the responsibility for any decision-making, action, and potential profit and loss in the capital market and cryptocurrency market lies with the trader.