
REZ
Renzo
| تریدر | نوع سیگنال | حد سود/ضرر | زمان انتشار | مشاهده پیام |
|---|---|---|---|---|
No results found. | ||||
Price Chart of Renzo
سود 3 Months :
سیگنالهای Renzo
Filter
Sort messages by
Trader Type
Time Frame

CryptoAnalystSignal
تحلیل تکنیکال REZ/USDT: آماده برای موج صعودی قدرتمند (ورود، تارگتها و حد ضرر)
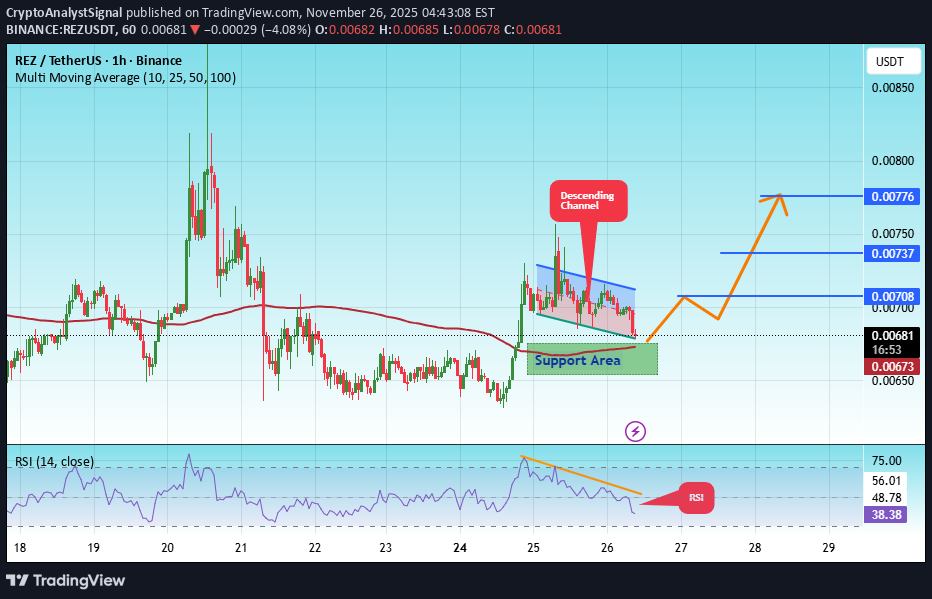
#REZ The price is moving within an ascending channel on the 1-hour timeframe and is adhering to it well. It is poised to break out strongly and retest the channel. We have a downtrend line on the RSI indicator that is about to break and retest, which supports the upward move. There is a key support zone in green at 0.00663, representing a strong support point. We have a trend of consolidation above the 100-period moving average. Entry price: 0.00683 First target: 0.00708 Second target: 0.00737 Third target: 0.00776 Don't forget a simple money management rule: Place your stop-loss order below the green support zone. Once you reach the first target, save some money and then change your stop-loss order to an entry order. For any questions, please leave a comment. Thank you.

BandForBands
سود نجومی ۳۰۰۰ درصدی REZ: آیا کفسازی تمام شد و انفجار قیمتی در راه است؟


CryptoSkullSignal
رمز ارز REZ در آستانه انفجار قیمتی؟ مثلث هماندازه، سطوح کلیدی برای رصد!
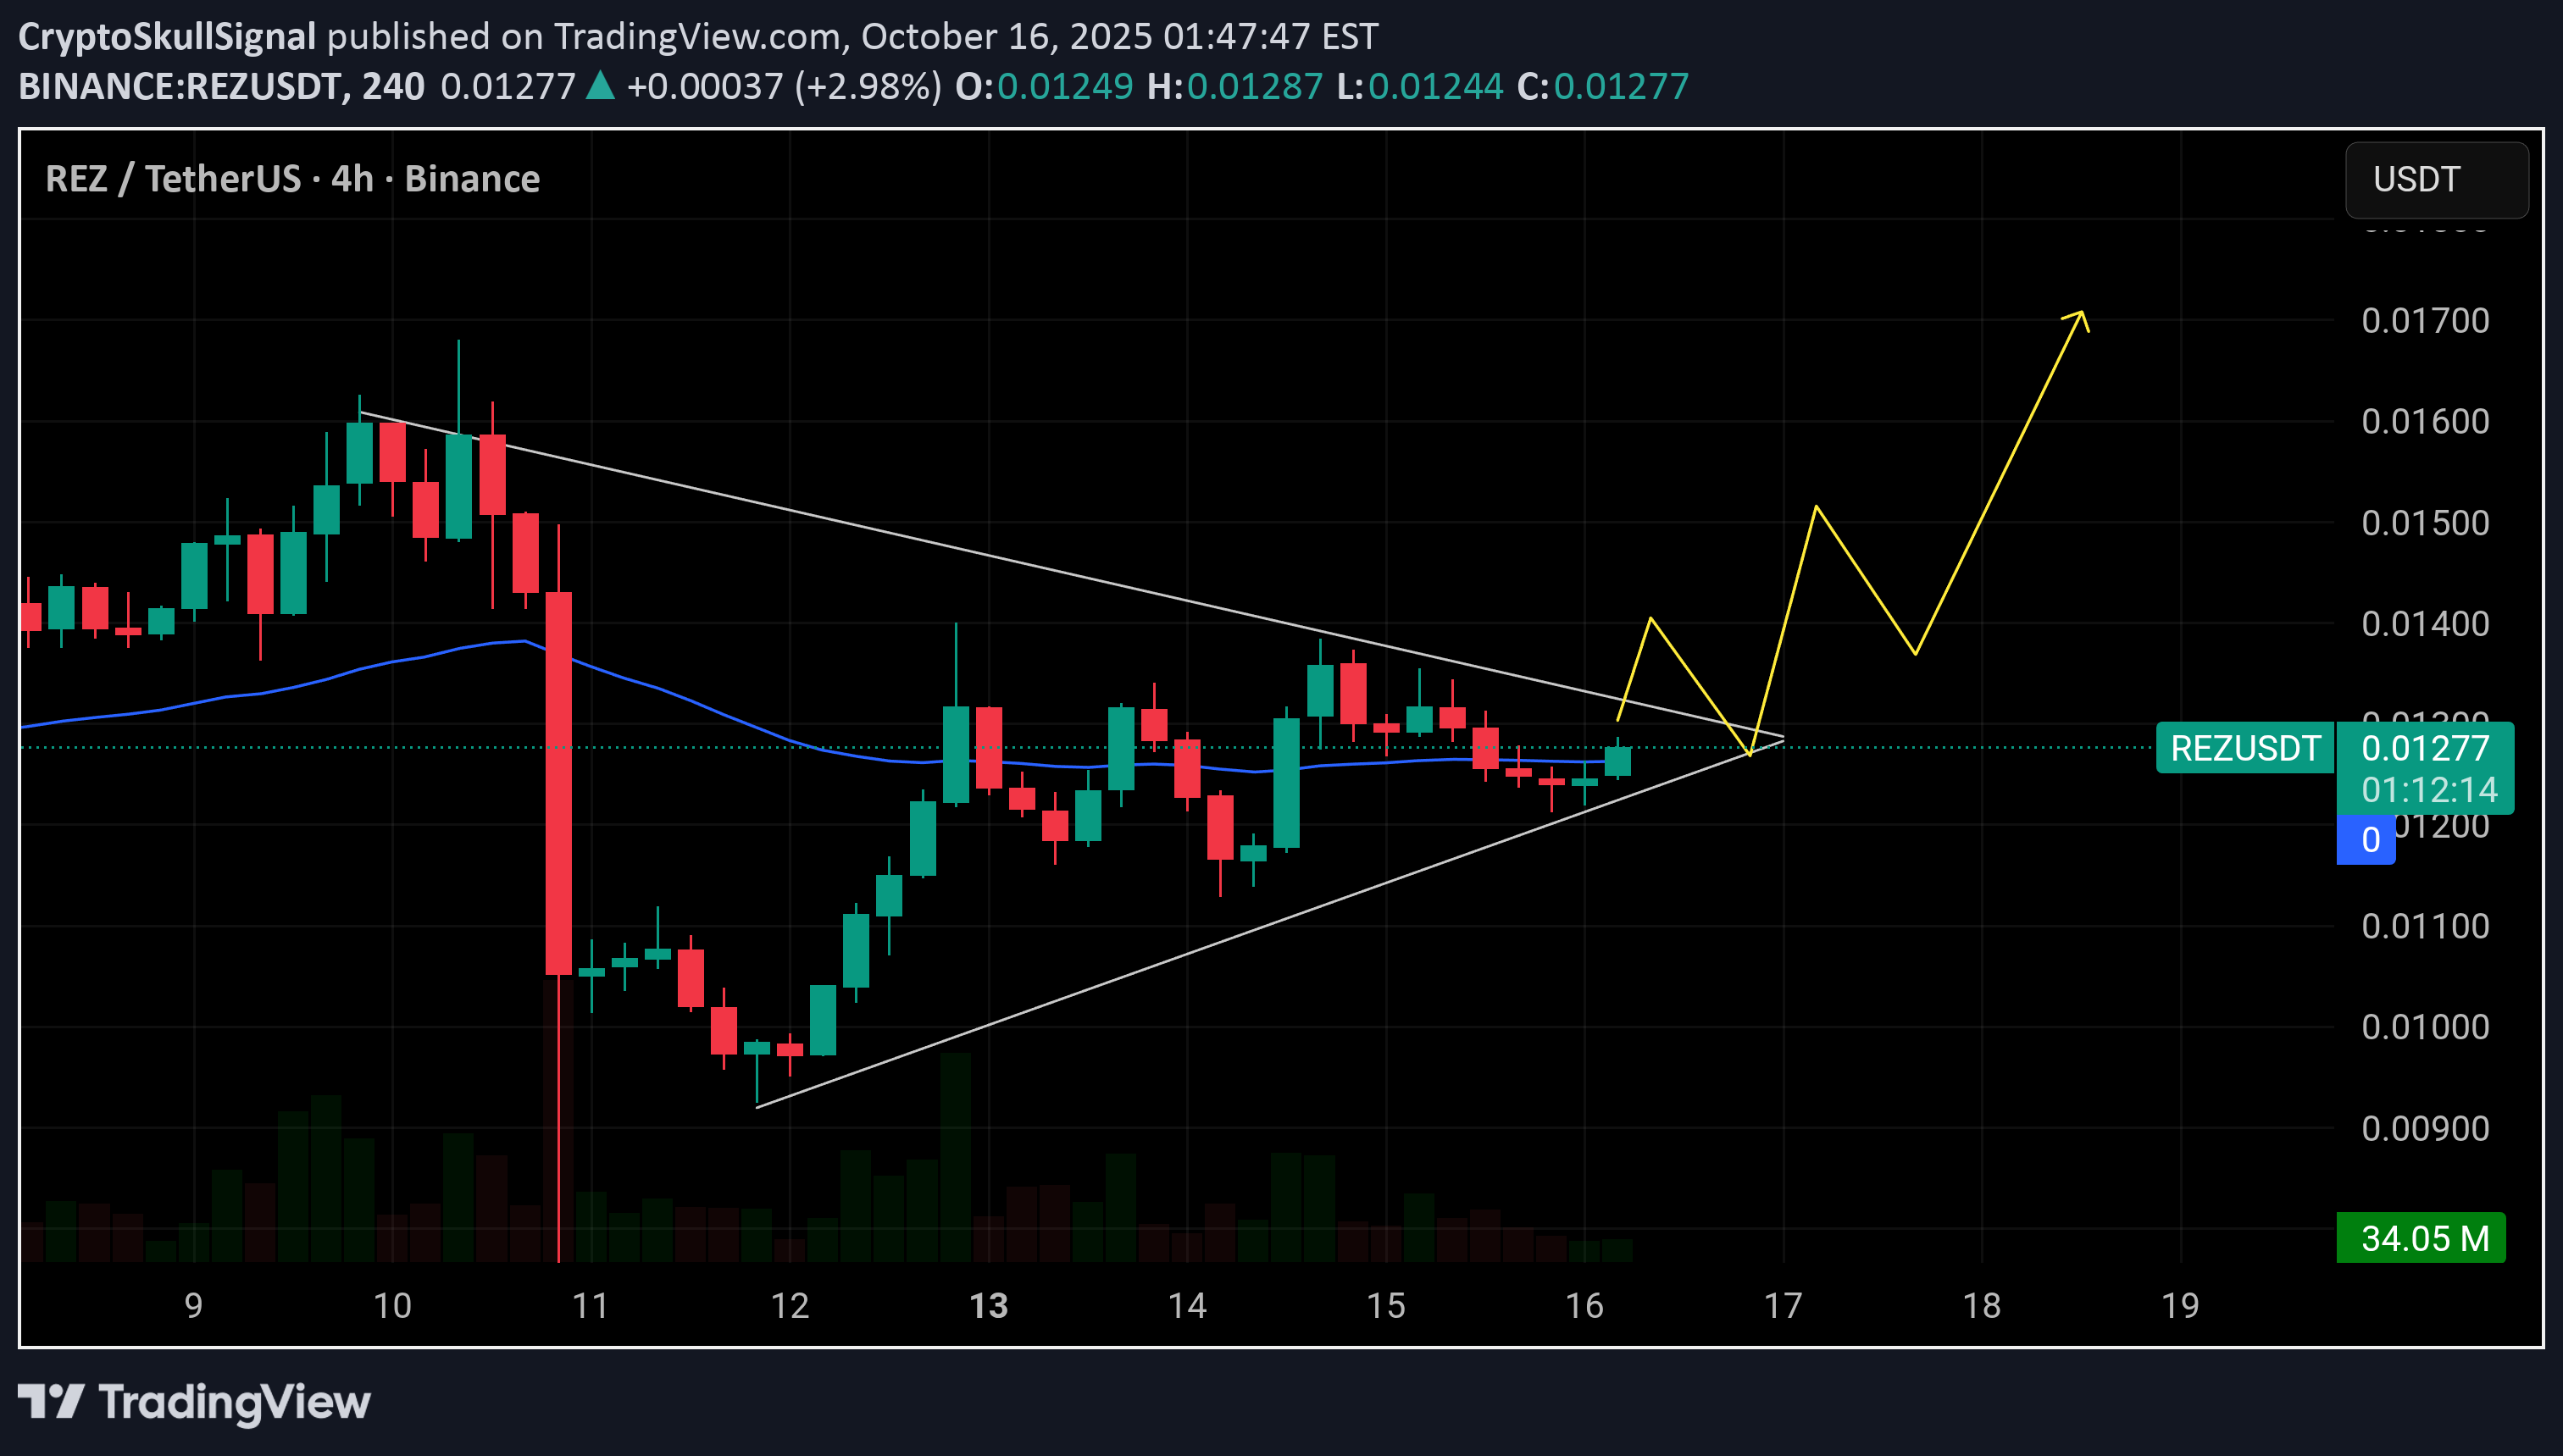
R REZ/USDT 4H CHART UPDATE: #REZ is currently consolidating inside a symmetrical triangle, showing clear signs of compression before a possible breakout. A move above the upper trendline around $0.0132 could trigger bullish momentum toward $0.015–$0.017. As long as REZ holds above $0.012 support, the structure remains positive. Watch for volume confirmation on the breakout that’s when the real move begins.

Cryptojobs


Morningtsar
ذخیره کامل داراییها: راز پشت اعتماد در ترید هیبریدی!

Quanto is committed to maintaining 100% asset reserves across all user deposits and positions. Transparency is foundational to trust, especially in a hybrid trading environment that blends the performance of centralized systems with the verifiability of decentralized protocols.

Crypto-by-PRIME
سقف مقاومت REZ/USDT نزدیک است: آیا رشد انفجاری 60 درصدی در راه است؟

REZ / USDT is approaching trend line resistance with strong potential. A successful breakout from this level could trigger a bullish rally of 50–60% in the short term. Keep a close watch and always wait for confirmation before entering. Manage risk wisely.

CryptoWithJames
تحلیل تکنیکال REZ: سیگنال صعود 55 درصدی با شکست الگوی گُوِه نزولی!

#REZ UPDATE REZ Technical Setup Pattern: Bullish falling wedge pattern Current Price: $0.037 Target Price: $0.057 Target % Gain: 55.12% REZ is breaking out of a falling wedge pattern on the 1D timeframe. Current price is $0.037 with a target near $0.057, showing about 55% potential upside. The breakout signals renewed bullish momentum with structure favoring further continuation. Always use proper risk management. Time Frame: 1D Risk Management Tip: Always use proper risk management.

MyCryptoParadise
Is REZUSDT About to Explode or Collapse?

Yello Paradisers! Have you been paying attention to REZUSDT lately? If not, you could be missing out on a major move that may catch many traders off guard. The pair has recently shown signs of manipulation following a clear accumulation phase, which significantly increases the probability that a distribution phase is now underway. 💎Price is currently sitting at a crucial support level, and before the manipulation occurred, we observed a clear Change of Character (CHoCH) on both the Daily and lower timeframes. This is a strong signal that most early buyers have been taken out, which often sets the stage for the real move to begin. 💎We’re also seeing strong bullish confluence across multiple indicators. The MACD, RSI, and Stochastic RSI are all showing divergence, which further supports the bullish thesis. On top of that, a key daily resistance trendline lies just above the current price and could act as a magnet, drawing the price higher in the short term. This setup is being supported by a double bottom structure forming on the higher timeframe, which we are actively trading from the lower timeframes in order to capture a higher risk-to-reward ratio. The alignment across multiple timeframes increases the probability of a sustained bullish move. 💎If you're looking for an entry, the current price zone offers a solid setup with a risk-to-reward of more than 1:2. A smart approach here would be to secure partial profits early and leave a small position running in case the price accelerates toward higher targets. However, if the price breaksdown & closes candle below our key invalidation level, the bullish scenario will be invalidated. In such a case, it’s better to step aside and wait for stronger confirmation rather than forcing a low-probability trade. 🎖Make sure you play it smart, Paradisers; the next 6–9 months will be juicy for some and painful for others. Discipline, patience, robust strategies, and trading tactics are the only ways you can make it long-term in this market. MyCryptoParadise iFeel the success🌴Yello, Paradisers! Did you catch the textbook bounce from our REZUSDT support zone like we planned? 📈 But now… things are taking a turn — and fast. So, what’s the move? 💎REZUSDT gave us a clean reaction from our support zone, delivering a solid 2.95RR gain just as expected. That was the high-probability setup we were waiting for. 💎However, the momentum has shifted… 💎Price has now returned to Break Even (BE) 💎The structure is turning bearish again 💎And the broader market environment is flashing warning signs That’s why the smartest play right now is to close this position at BE and step aside. We’re not here to force trades — we’re here to protect capital and wait for precision setups.

Bithereum_io
REZUSDT 3D
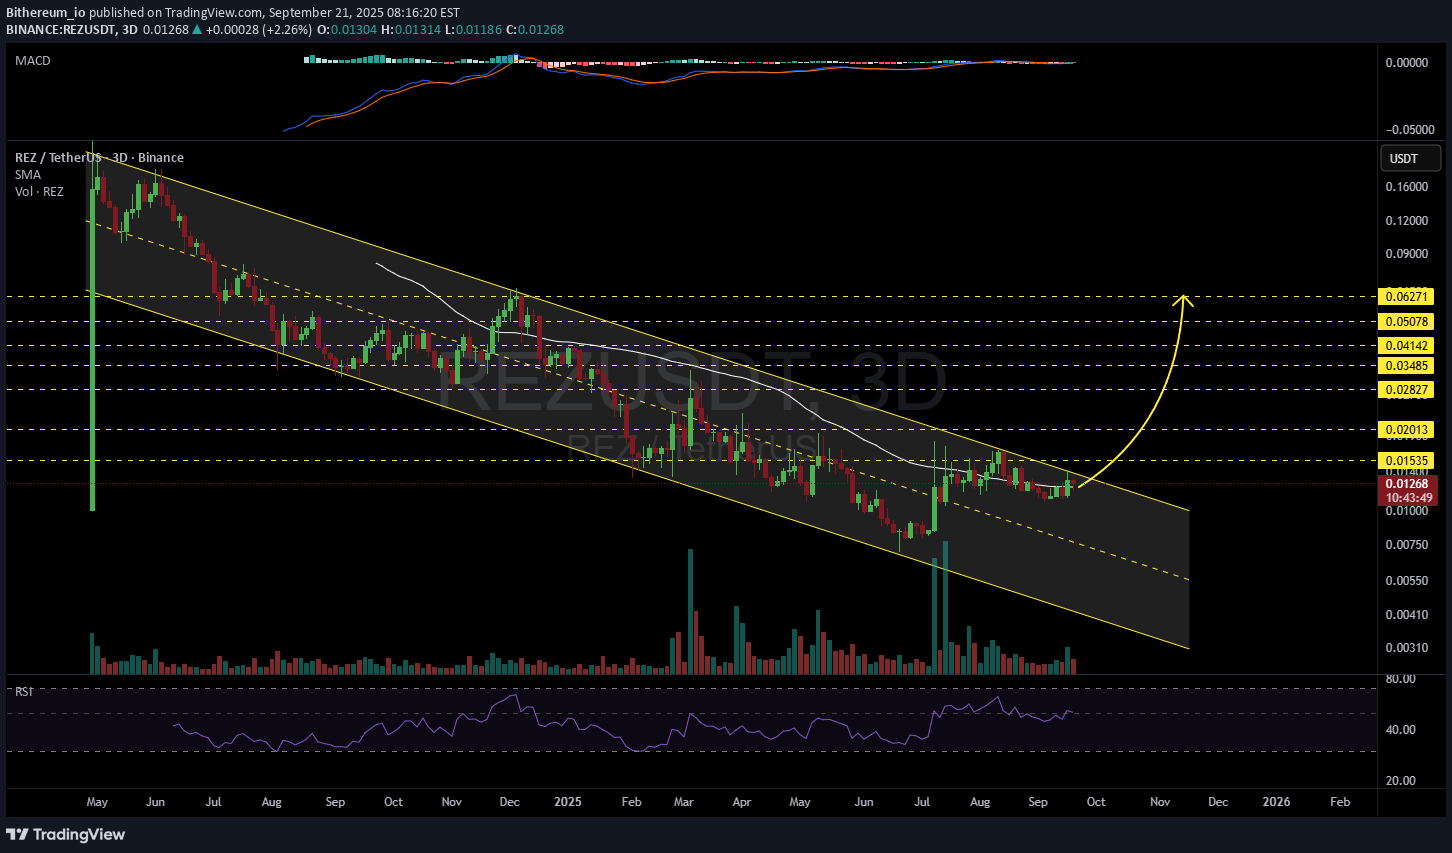
Keep an eye on the #REZ 3-day timeframe chart. It has formed a descending channel and is on the verge of breaking out above it. In case of a breakout, the potential mid-term targets are: 🎯 $0.01535 🎯 $0.02013 🎯 $0.02827 🎯 $0.03485 🎯 $0.04142 🎯 $0.05078 🎯 $0.06271 ⚠️ Always remember to use a tight stop-loss and follow proper risk management.

CryptoNuclear
REZ/USDT — Major Crossroads: Breakout New Trend or Drop to Lows?
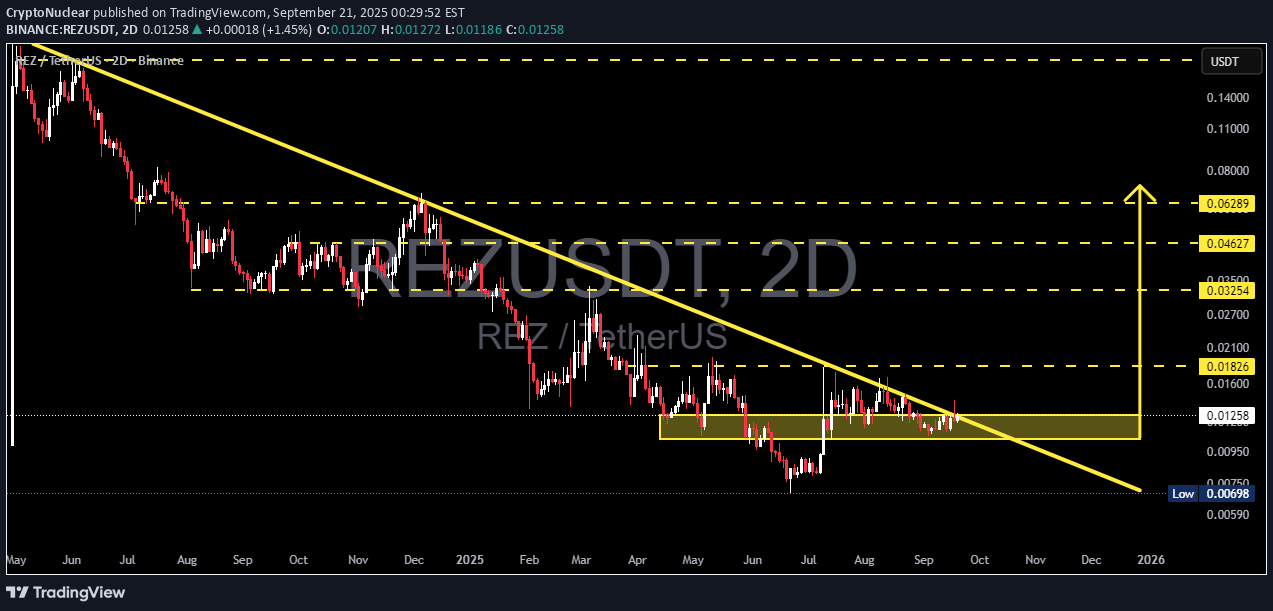
🔎 Overview REZ/USDT on the 2D timeframe is at a critical stage. For months, price has been capped by a long-term descending trendline that has rejected every rally attempt since 2024. Now, the price is once again testing this trendline while holding inside the accumulation zone (0.010 – 0.013). This zone has acted as a strong battleground between buyers and sellers. The next move will likely define the larger direction: will we see a bullish breakout or a continuation of the bearish trend? --- 📐 Technical Pattern Long-Term Downtrend Line: consistent lower highs since mid-2024. Accumulation Base: the yellow box shows strong demand where price repeatedly bounced. Potential Breakout Setup: price is attempting to break out of the downtrend + accumulation base — often the start of a trend reversal if confirmed. --- 🟢 Bullish Scenario 1. A confirmed breakout requires a 2D candle close above the trendline and a move beyond 0.01826 resistance. 2. If confirmed, upside targets are: 🎯 Target 1: 0.01826 → +43% 🎯 Target 2: 0.03254 → +156% 🎯 Target 3: 0.04627 → +264% 🎯 Target 4: 0.06289 → +395% 3. Breakout strength will be validated if supported by high volume and a successful retest of the breakout zone turning into support. --- 🔴 Bearish Scenario 1. Failure to break the trendline may lead to another rejection and sideways movement inside the box. 2. A breakdown below the 0.010–0.009 range would trigger stronger downside pressure. 3. Extreme bearish target sits at the historical low of 0.00698 (≈ −45% from current price). --- 🎯 Trading Approach Conservative: wait for a 2D close above 0.01826 + successful retest → safer entry with stronger confirmation. Aggressive: enter on initial breakout above the trendline, stop loss below the accumulation zone (~0.009). Higher risk, higher reward. Risk management: keep position sizes controlled. R:R to the 0.03254 target could reach 5:1, meaning much greater reward potential if the breakout is valid. --- 📝 Conclusion REZ/USDT is at a crossroads. A valid breakout could end the long downtrend and open the path toward a major rally. However, failure here could drag the price back to historical lows. This is the ultimate “wait for confirmation” setup: patience for 2D candle closes, volume signals, and retests will determine whether this is a false breakout or the start of a new trend. --- #REZ #REZUSDT #CryptoAnalysis #BreakoutTrading #SupportResistance #Trendline #CryptoSignals #Altcoin
Disclaimer
Any content and materials included in Sahmeto's website and official communication channels are a compilation of personal opinions and analyses and are not binding. They do not constitute any recommendation for buying, selling, entering or exiting the stock market and cryptocurrency market. Also, all news and analyses included in the website and channels are merely republished information from official and unofficial domestic and foreign sources, and it is obvious that users of the said content are responsible for following up and ensuring the authenticity and accuracy of the materials. Therefore, while disclaiming responsibility, it is declared that the responsibility for any decision-making, action, and potential profit and loss in the capital market and cryptocurrency market lies with the trader.