
PNUT
Peanut the Squirrel
| تریدر | نوع سیگنال | حد سود/ضرر | زمان انتشار | مشاهده پیام |
|---|---|---|---|---|
 BandForBandsRank: 32095 | خرید | حد سود: تعیین نشده حد ضرر: تعیین نشده | 11/25/2025 |
Price Chart of Peanut the Squirrel
سود 3 Months :
سیگنالهای Peanut the Squirrel
Filter
Sort messages by
Trader Type
Time Frame

CryptoWithJames
PNUTUSDT UPDATE
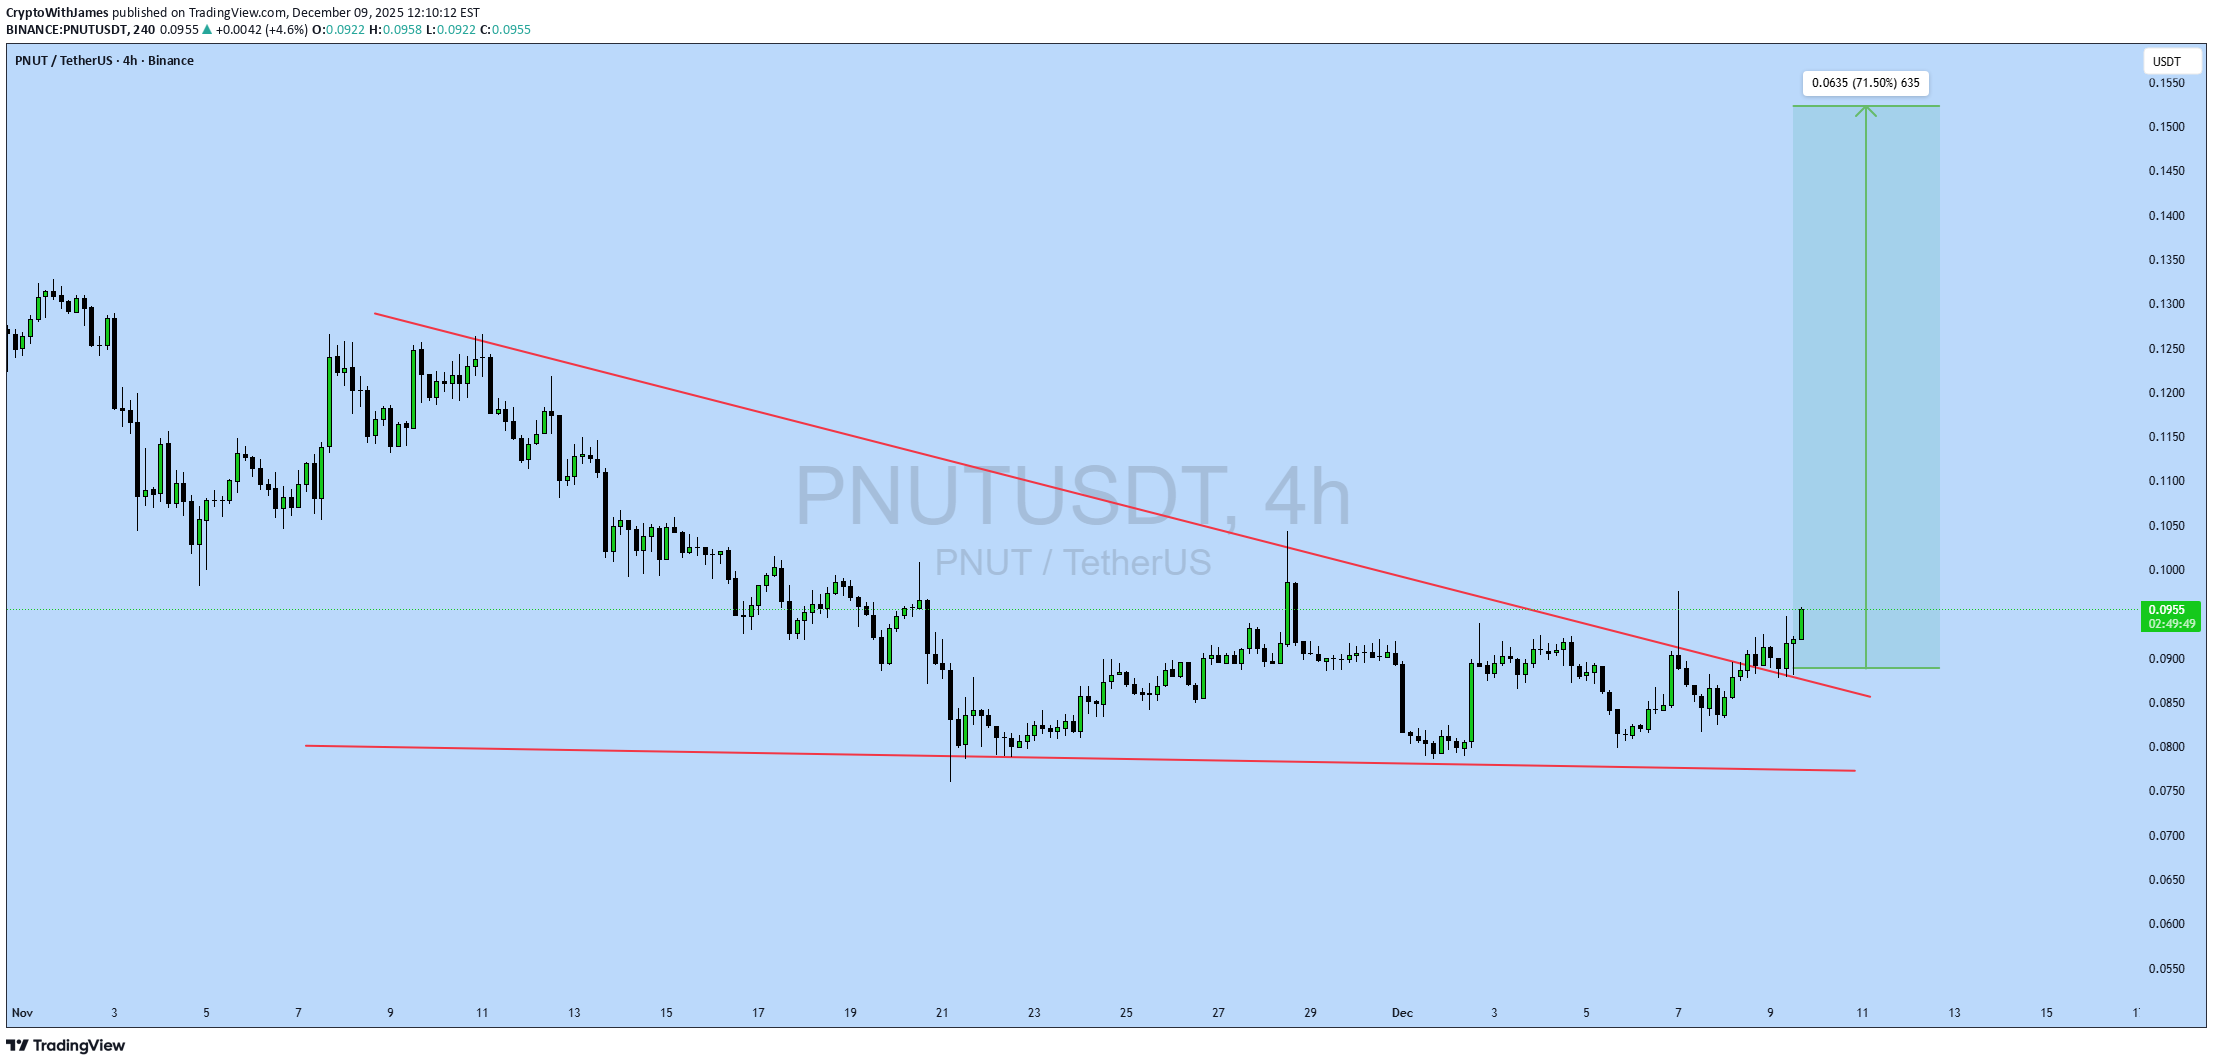
PNUT UPDATE PNUT Technical Setup Pattern: Falling Wedge Pattern Current Price: $0.0944 Target Price: $0.1616 Target % Gain: 70.20% Technical Analysis: PNUT is showing a breakout from the falling wedge pattern on the 4h chart, indicating potential bullish momentum. The price has surged above the resistance trendline, supported by an increase in trading volume. This setup is becoming more reliable as the price approaches key resistance areas. Time Frame: 1D Risk Management Tip: Always apply proper risk management.
BandForBands
آلتکوین مرموز $PNUT: آیا رشد انفجاری ۵۰۰ درصدی در ۴۰ روز آینده در راه است؟
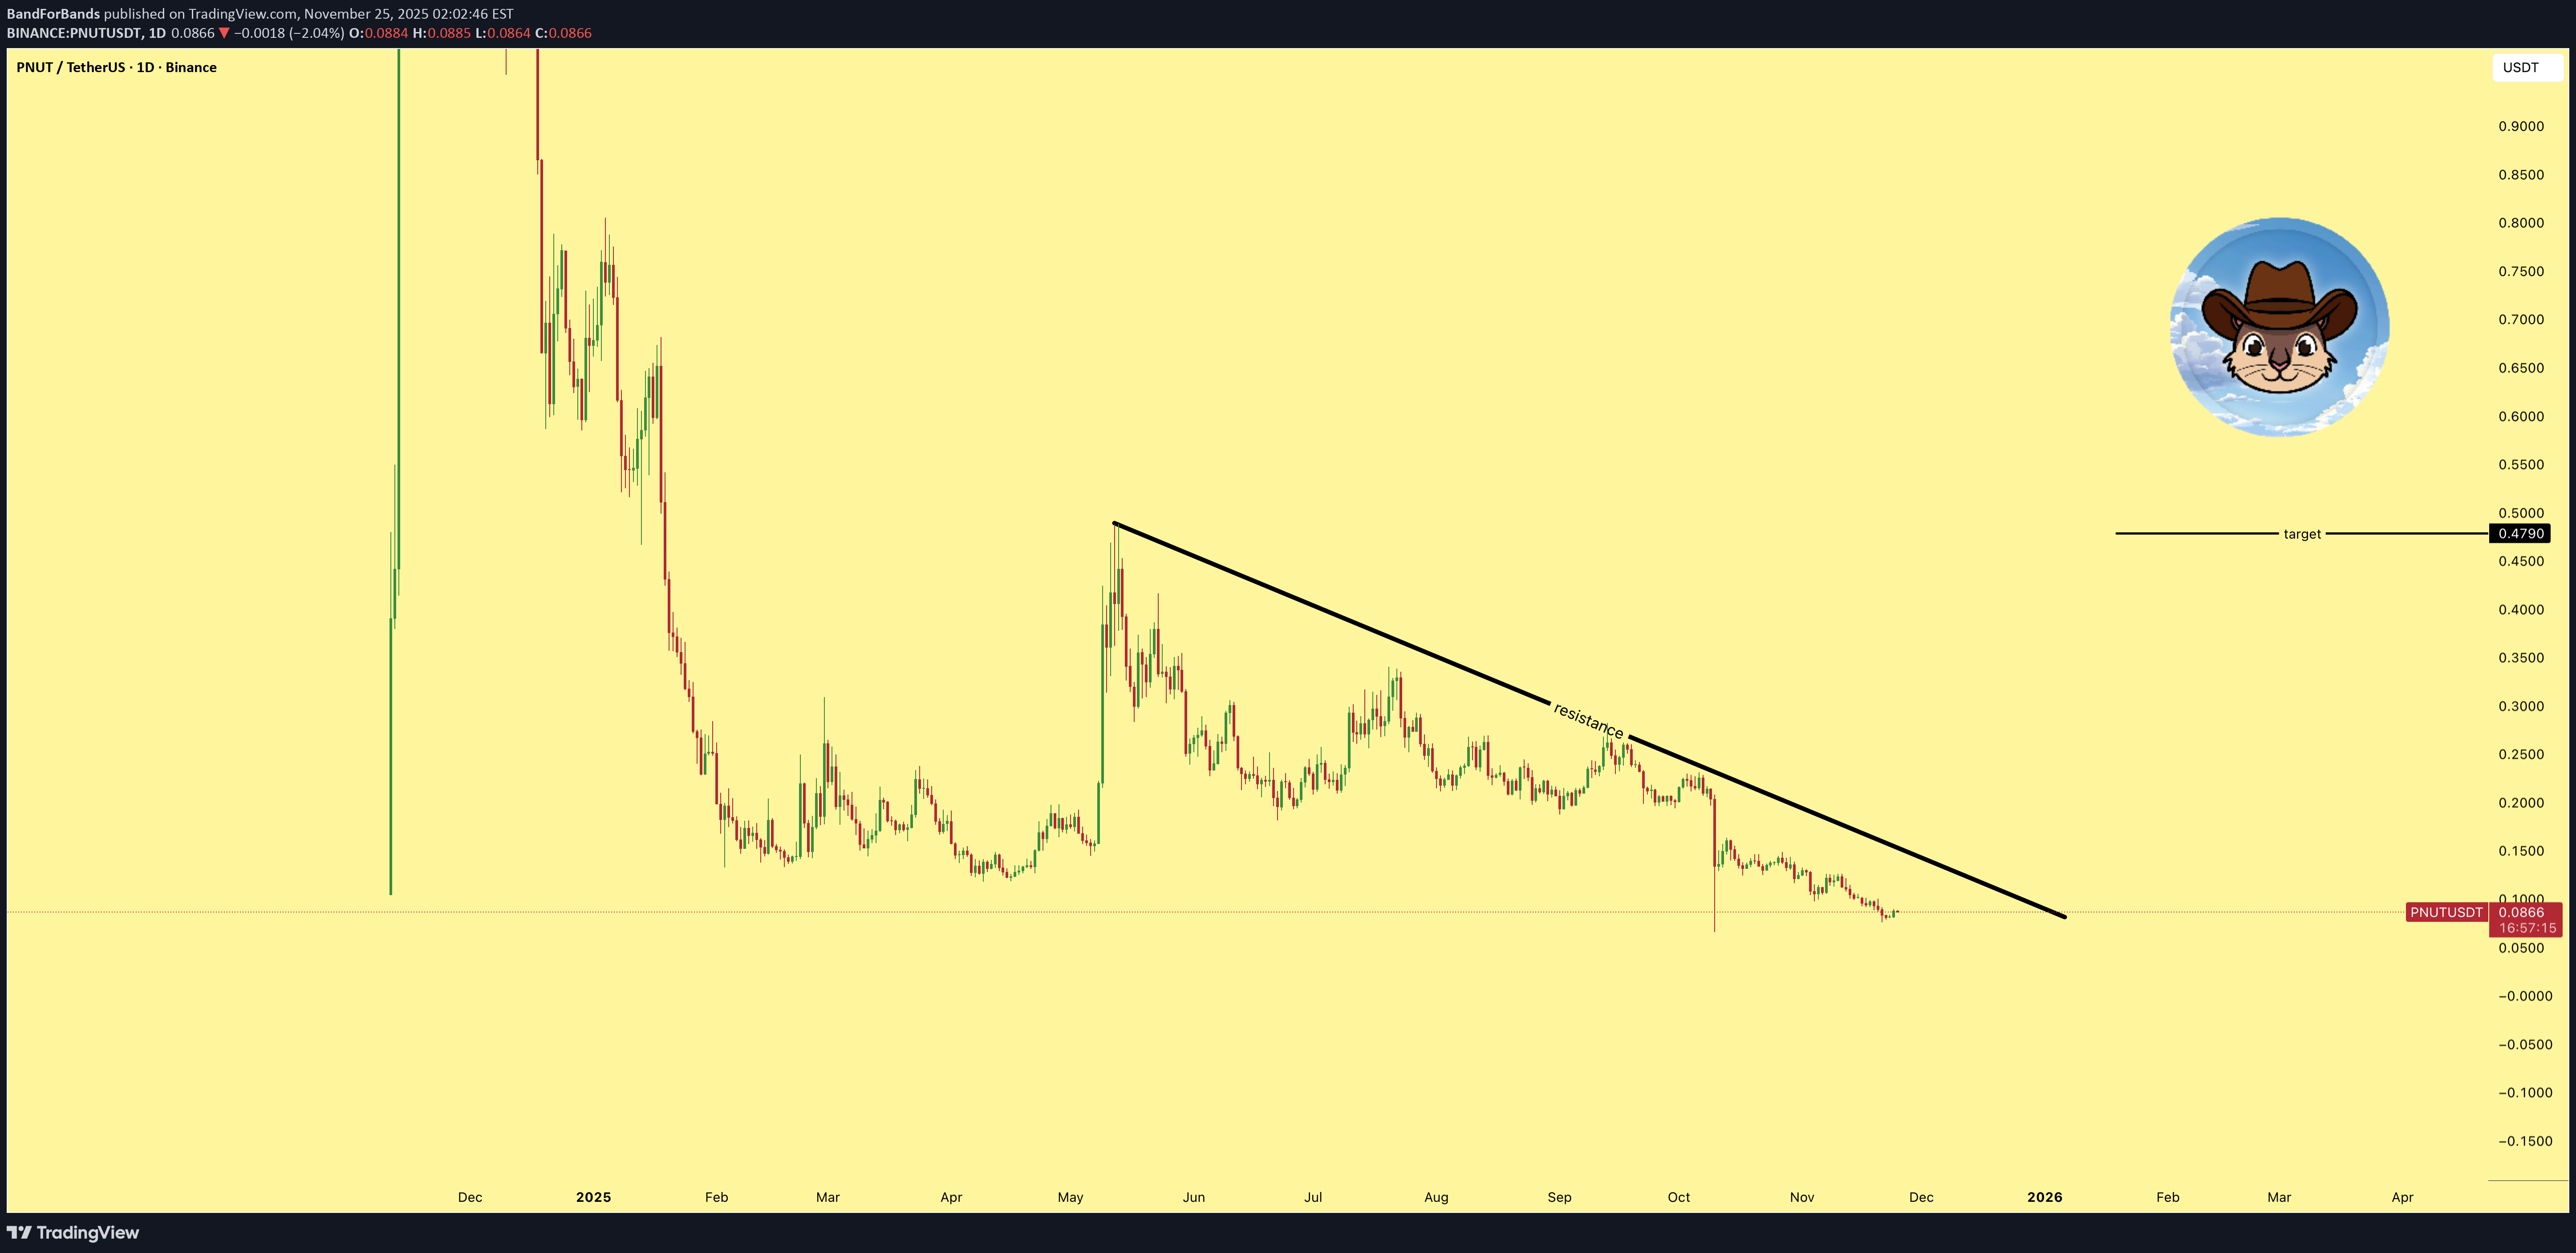
$PNUT looks like it can break out within the next 40 days. The structure is tight, accumulation is clear, and the setup supports a potential 500 percent move to the upside once momentum kicks in. This chart is heating up fast.

Crypto-by-PRIME
شکست کانال PNUT/USDT: آیا رالی صعودی قوی در راه است؟
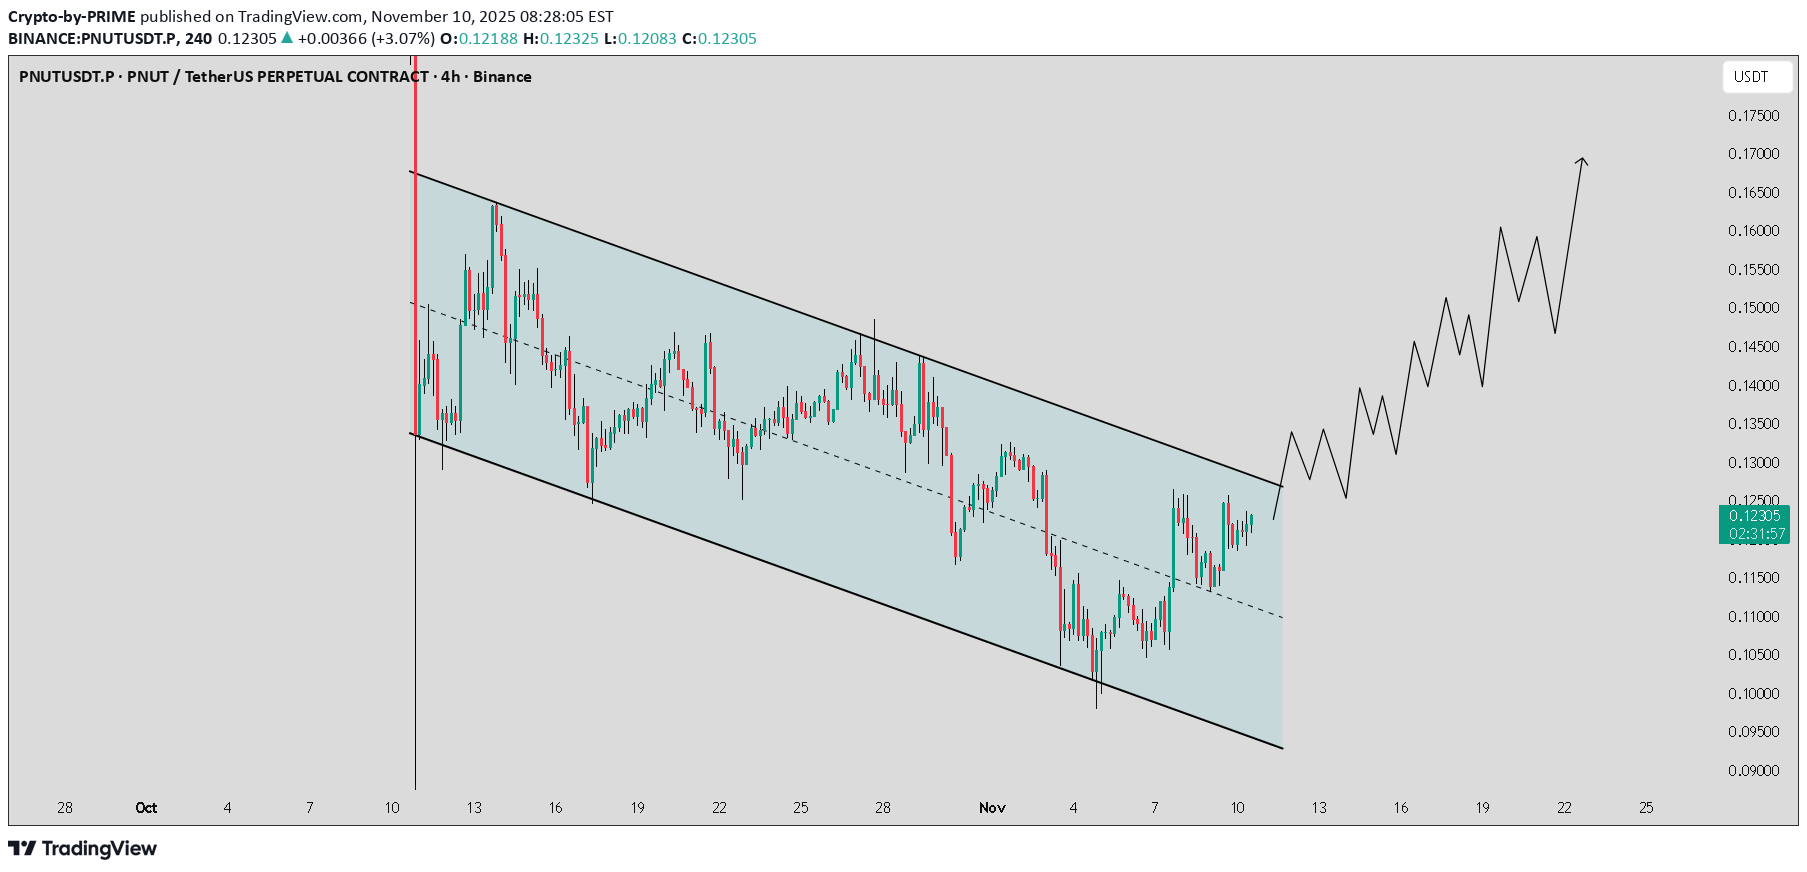
PNUT / USDT is moving cleanly within a descending channel and has now bounced from the mid-zone, heading towards the upper resistance line. A confirmed breakout with volume could trigger a strong rally towards $0.18 - $0.22 in the coming days. Watch for confirmation and manage risk wisely.

Bithereum_io
سیگنال صعودی PNUT: آیا موج صعودی در راه است؟ سطوح کلیدی قیمت و اهداف بزرگ
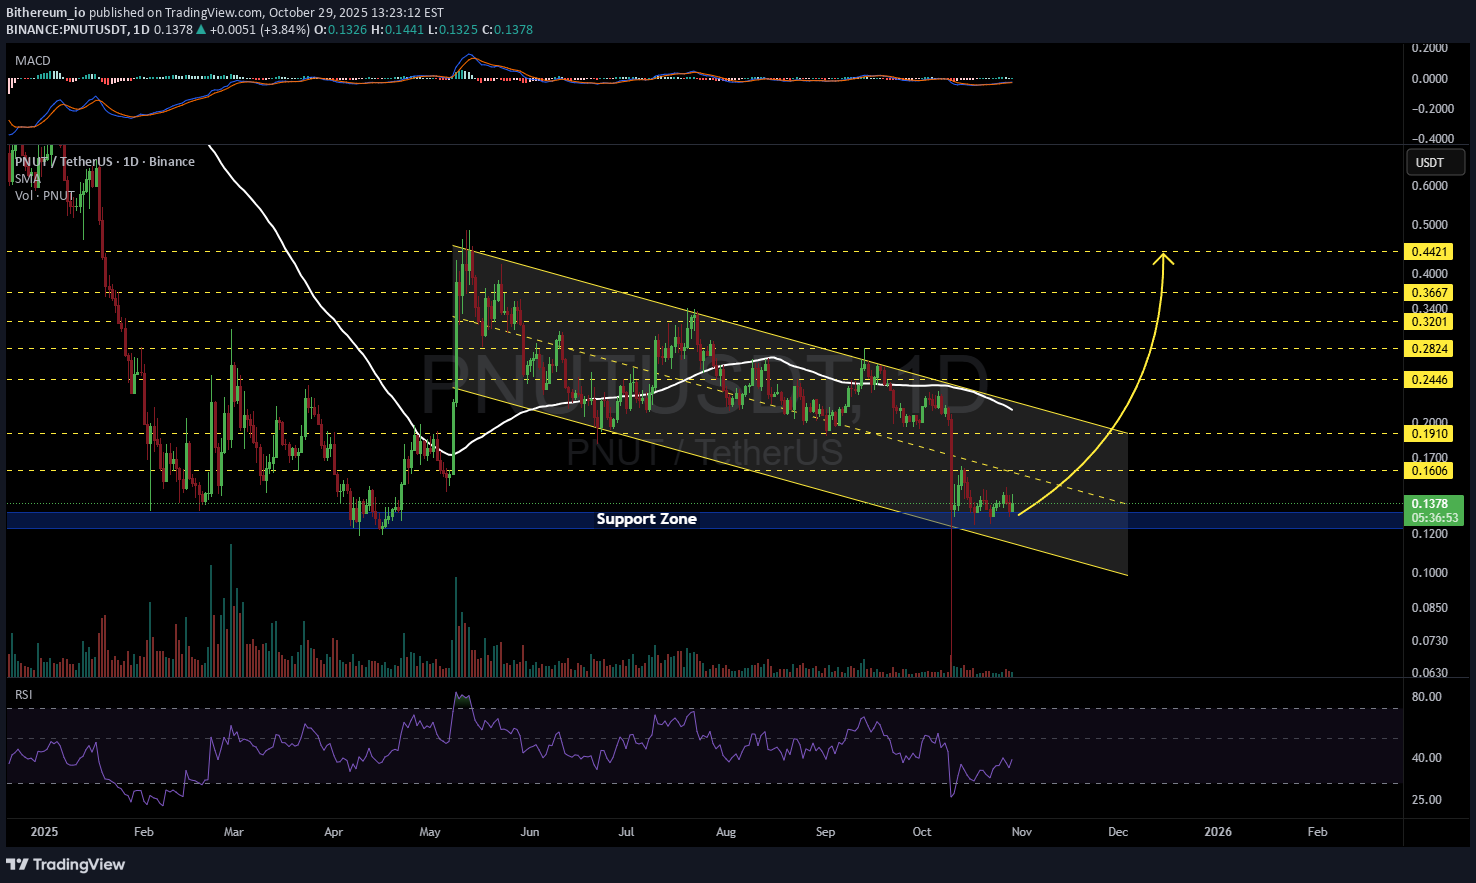
#PNUT is currently trading within a descending channel on the daily timeframe. It’s moving above the support zone, and a bullish wave may start soon. The short-term targets are: 🎯 $0.1606 🎯 $0.1910 If a breakout occurs above the daily SMA100 and the channel resistance, the potential upside targets are: 🎯 $0.2446 🎯 $0.2824 🎯 $0.3201 🎯 $0.3667 🎯 $0.4421 ⚠️ Always remember to use a tight stop-loss and maintain proper risk management.

CryptoNuclear
آیا کف قیمت PNUT زده شد؟ راز بزرگ خریداران در این سطح حمایتی کلیدی!

📊 Overview The PNUT/USDT (2D) chart is entering a critical phase after a long downtrend followed by a retest of a strong demand zone (yellow box). Current price stands at 0.1503 USDT, after forming an extreme wick down to 0.0660, then pulling back strongly — a clear sign of aggressive buyer reaction (liquidity sweep) from the same demand area seen in March–May earlier this year. This structure often represents a major market turning point: it could either be a temporary bounce or the early stage of a medium-term reversal, depending on how price reacts within this zone. --- 📐 Structure and Key Pattern 1. Formed Pattern: A potential Double Bottom is developing around 0.11–0.15. The long lower wick indicates strong absorption of selling pressure. Price remains in a horizontal accumulation phase after a sharp decline since late 2024. 2. Main Zone (Yellow Box): Area between 0.11–0.17 serves as macro support and historical demand base. It has been tested multiple times without a major breakdown candle. This means buyers are still defending this level aggressively. 3. Key Signal: Volume spiked during the liquidity sweep, followed by a strong close above support — a sign of a false breakdown or liquidity grab. Such setups often become the early stage of an impulsive bullish move if confirmed by structure and volume. --- 🚀 Bullish Scenario (Potential Reversal) Main condition: price must stay inside or above the yellow box and form a higher low on the 2D structure. A 2D close above 0.1945 would confirm early reversal signs. Momentum will strengthen if price breaks above 0.2629–0.3233, opening the path toward 0.4045–0.5000. A breakout beyond these levels would mark the start of a new expansion phase after prolonged accumulation. 🎯 Bullish Targets: 1. 0.1945 → 0.2629 (minor breakout) 2. 0.3233 → 0.4045 (mid-term rally zone) 3. 0.5000+ (macro reversal confirmation) Note: Strongest confirmation occurs when a 2D candle closes with full body and high volume above the first resistance. --- ⚠️ Bearish Scenario (Extended Breakdown) If price fails to hold the yellow box, the bearish case remains valid. A 2D close below 0.110 signals a loss of structural demand. Downside targets lie at the 0.0660 wick low, with further risk toward 0.05 psychological zone if selling continues. This would extend the downtrend and potentially lead to a final capitulation phase. 🎯 Bearish Targets: 1. 0.110 (breakdown confirmation) 2. 0.066 (wick low retest) 3. <0.05 (macro capitulation zone) --- 🧭 Conclusion Currently, PNUT sits at a historical turning point. Selling pressure appears exhausted, as shown by the deep wick and rapid buyer reaction. However, without a confirmed breakout above 0.1945, a reversal cannot yet be declared. The yellow zone remains the line between survival and collapse for the macro structure. In other words: > If PNUT holds the yellow zone, the market could witness one of the sharpest mid-cap altcoin rebounds. But if this support fails, the next drop could be brutal — and fast. --- 🔖 Key Technical Levels Current Price: 0.1503 Demand Zone (Strong Support): 0.11 – 0.17 Resistance 1: 0.1945 Resistance 2: 0.2629 Resistance 3: 0.3233 Resistance 4: 0.4045 Extreme Low: 0.0660 Historical High: 2.5000 --- #PNUT #PNUTUSDT #CryptoAnalysis #Altcoin #TechnicalAnalysis #SupportAndResistance #LiquiditySweep #ReversalZone #SwingTrade #CryptoTrading #MarketStructure #PriceAction #CryptoSetup

darksignal
PNUT/USDT: سیگنال صعود قوی! سود ۵۰ درصدی با شکست مقاومت کلیدی

On the Peanut the Squirrel / USDT 4-hour chart, after a prolonged downtrend, the price has stabilized around the $0.19 level, forming a solid support zone. Since then, the market has been gradually recovering, creating higher lows, which suggests a shift in sentiment from bearish to moderately bullish. The moving averages are converging, and the shorter one is attempting to cross above the longer one — a classic signal indicating the possible start of an upward move. Currently, the price is trading around $0.22, holding above local support and the short-term moving average, which shows that buyers are regaining control. The RSI, after a recent decline, is turning upward without reaching overbought territory, leaving room for further growth. If bulls manage to maintain the price above $0.21 and break the nearest resistance at $0.23, it could open the way for a continuation toward $0.25 and then $0.28. In the longer term, if the positive momentum holds, the market has the potential to rise toward the $0.32 area, which marks a strong resistance from previous highs. In summary, the chart structure and technical indicators suggest an increasing likelihood of a continued upward trend, with a potential target around $0.32, as long as the key support at $0.21 remains intact. Potential TP: 0.32 USD

satooshi1242
Million dollars analyzing

I checked all the timeframes, and from now on, the price is set to increase by 800% strongly. Don't miss this opportunity.Best chart for making money!
satooshi1242
Above 20%
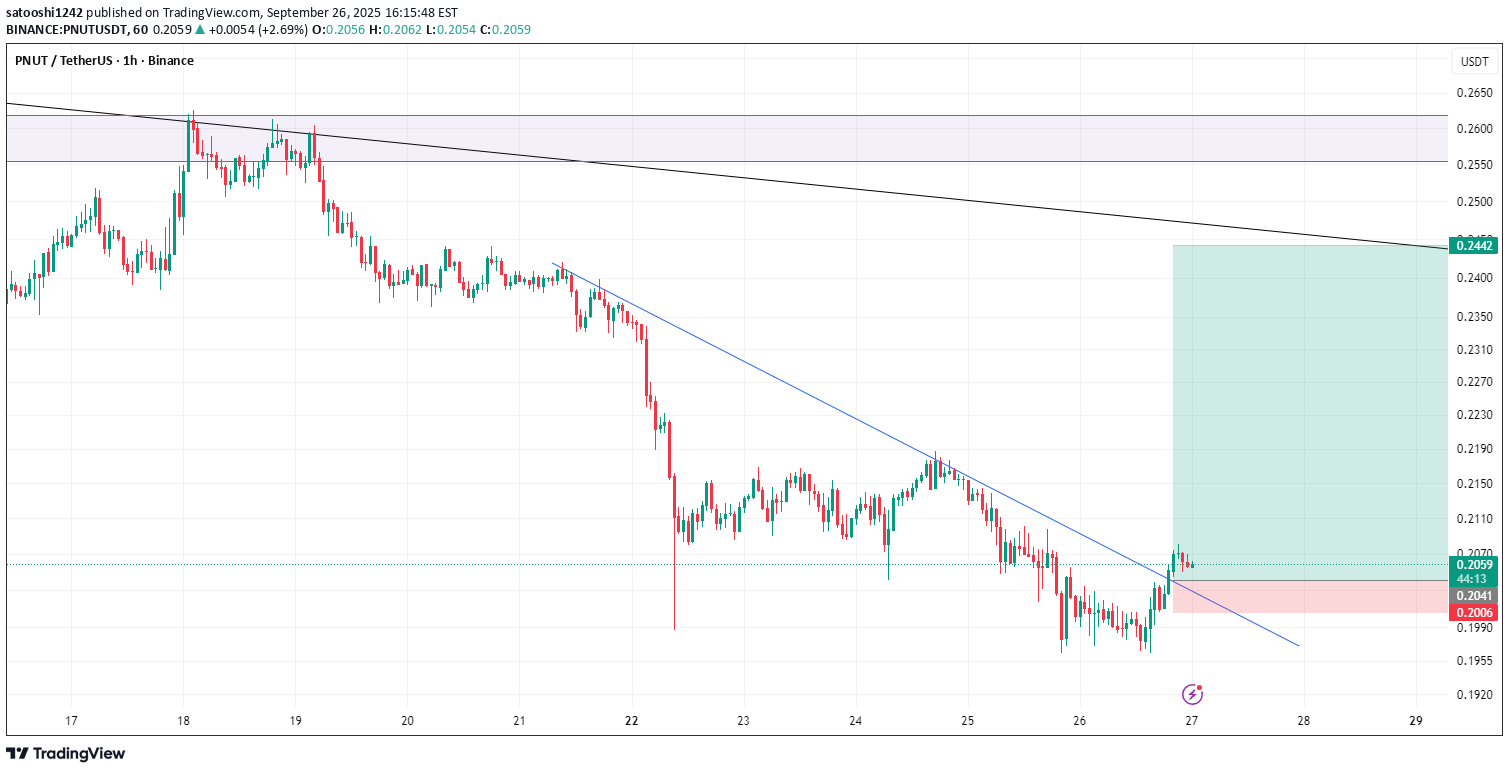
PNUUSDT is setting up for an interesting move. If the price can manage to hit a 20% gain for a long position, it could indicate strong bullish momentum. Furthermore, if it breaks above the trend line resistance, we might see a significant rally that could push the gains well above 300%. It's essential to keep an eye on the market sentiment and volume as we approach these key levels.
CryptoNuclear
PNUUSDT — Descending Triangle Accumulation Zone: Major Breakout?
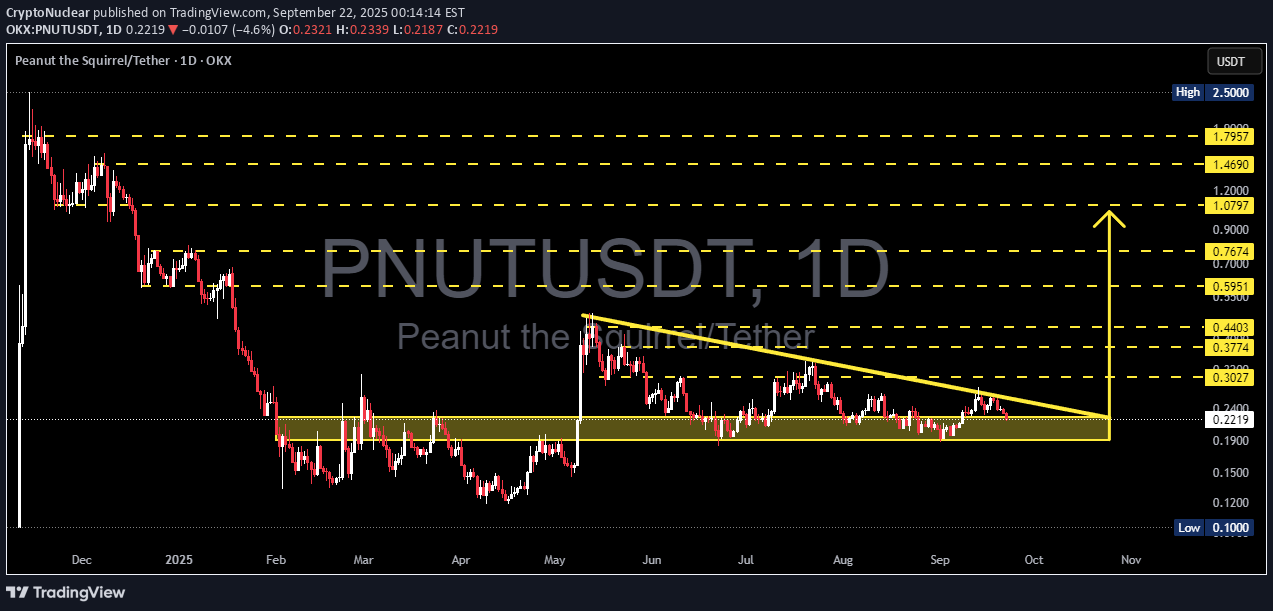
🔎 Full Analysis The PNU/USDT (1D) chart shows a clear Descending Triangle pattern that has been forming since May 2025. Price is currently trading around 0.2216 USDT, moving closer to the apex of the pattern — a sign that a big move is likely approaching. ⚙️ Pattern Details Strong Support (Accumulation Zone): 0.19 – 0.24 This area has been tested multiple times and continues to attract buyers. Descending Resistance: A downward sloping trendline from May’s high is pressing price lower, forming consecutive lower highs. Characteristics: While this pattern is typically seen as a bearish continuation, it can also turn into an accumulation base if buyers step in with strong volume. --- 🚀 Bullish Scenario Confirmation: Daily close above 0.3027 with strong volume. Step-by-step targets: First breakout level: 0.3027 Next targets: 0.3774 → 0.415 → 0.4403 Extended target if momentum accelerates: 0.5951 Measured Move Potential: A confirmed breakout projects a move toward 0.415 – 0.44 USDT. Bullish Narrative: A breakout above the descending trendline could signal the start of a major reversal from long-term accumulation. Buyers regaining control may drive PNU/USDT back toward the 0.40 – 0.60 zone. --- 📉 Bearish Scenario Confirmation: Daily close below 0.19 with high volume. Step-by-step targets: Conservative target: 0.10 USDT (chart low label) Aggressive measured move target: 0.08 USDT Bearish Narrative: If 0.19 fails as support, the descending triangle would act as a continuation pattern of the previous downtrend, potentially triggering a deeper breakdown toward 0.10 or even lower. --- 📌 Conclusion PNU/USDT is at a critical decision point: Bullish case: Breakout above the trendline could unlock a reversal and rally toward 0.40+. Bearish case: Breakdown below 0.19 could extend the downtrend to 0.10 or lower. With price approaching the apex, volatility is expected soon. Traders should wait for daily close + volume confirmation before committing to a position and apply strict risk management to avoid false breakouts. --- ⚡ Key Levels to Watch Support zone: 0.19 – 0.24 Critical resistance: 0.3027 Breakout targets: 0.3774 → 0.415 → 0.4403 → 0.5951 Breakdown targets: 0.10 – 0.08 --- #PNUT #PNUTUSDT #PeanutTheSquirrel #TechnicalAnalysis #DescendingTriangle #CryptoAnalysis #Altcoin #Breakout #BearishOrBullish #CryptoTrading

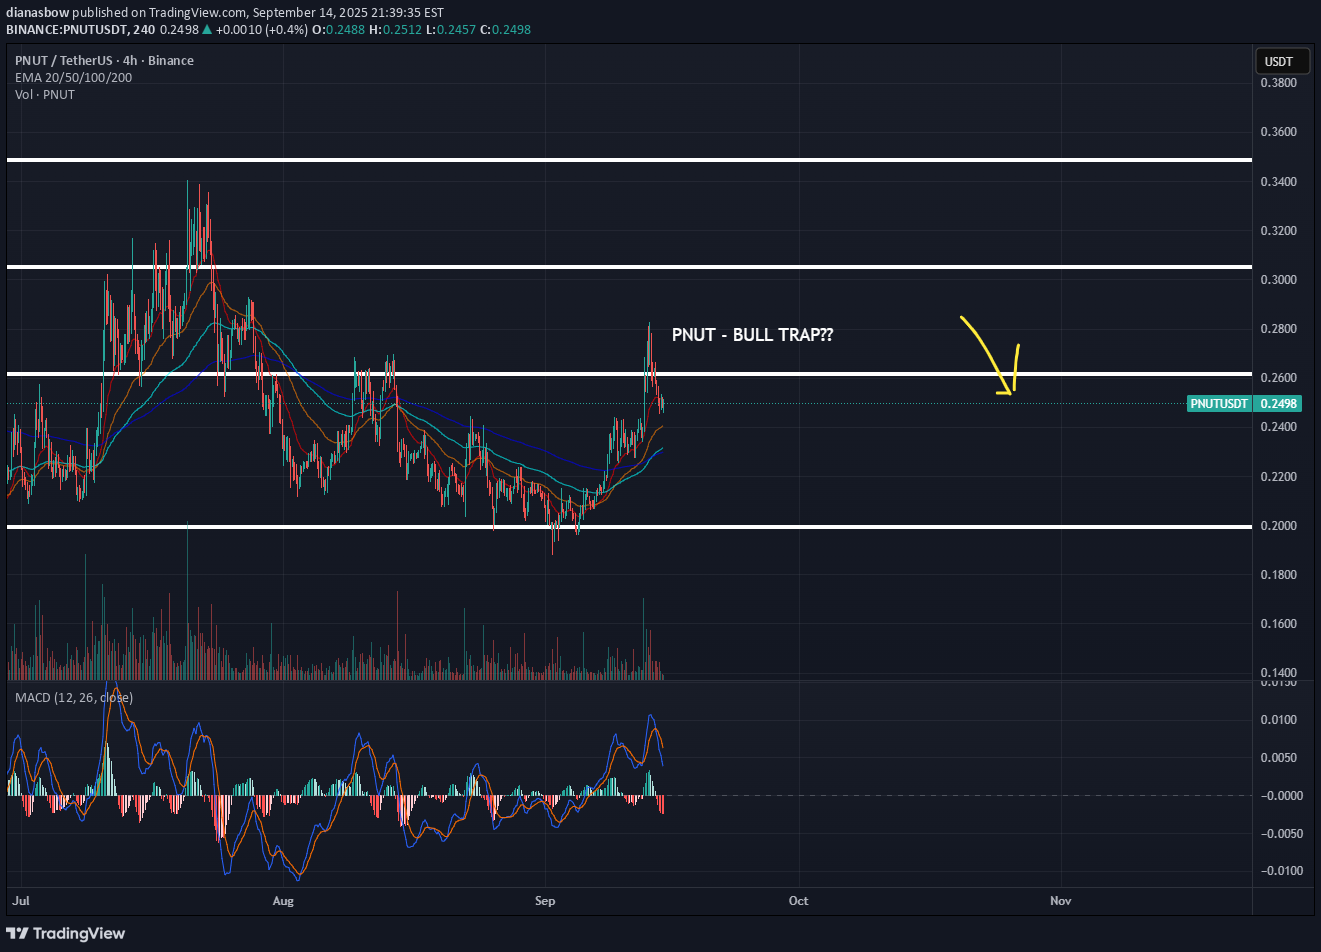
dianasbow
PNUT BULL TRAP - to 1880 ??????
this analysis reflects only my personal views and is not financial advice. Any profit or loss from actions taken based on this content is solely your own responsibility.
Disclaimer
Any content and materials included in Sahmeto's website and official communication channels are a compilation of personal opinions and analyses and are not binding. They do not constitute any recommendation for buying, selling, entering or exiting the stock market and cryptocurrency market. Also, all news and analyses included in the website and channels are merely republished information from official and unofficial domestic and foreign sources, and it is obvious that users of the said content are responsible for following up and ensuring the authenticity and accuracy of the materials. Therefore, while disclaiming responsibility, it is declared that the responsibility for any decision-making, action, and potential profit and loss in the capital market and cryptocurrency market lies with the trader.