
ONT
Ontology
| تریدر | نوع سیگنال | حد سود/ضرر | زمان انتشار | مشاهده پیام |
|---|---|---|---|---|
No results found. | ||||
Price Chart of Ontology
سود 3 Months :
سیگنالهای Ontology
Filter
Sort messages by
Trader Type
Time Frame

CryptoAnalystSignal
#ONT/USDT Could switch sides soon. Be ready

#ONT The price is moving in a descending channel on the 1-hour timeframe. It has reached the lower boundary and is heading towards a breakout, with a retest of the upper boundary expected. We are seeing a bearish trend in the Relative Strength Index (RSI), which has reached near the lower boundary, and an upward bounce is expected. There is a key support zone in green at 0. The price has bounced from this level several times and is expected to bounce again. We are seeing a trend towards stabilizing above the 100-period moving average, which we are approaching, supporting the upward trend. Entry Price: 0.0632 First Target: 0.0652 Second Target: 0.0676 Third Target: 0.0714 Place your stop-loss order below the green support zone. Remember a simple principle: Money Management. For any questions, please leave a comment. Thank you.#ONT First Target: 0.0652 Reached Second Target: 0.0676 Reached Third Target: 0.0714 Reached

راز پولدار شدن با سرمایهگذاری: از کف قیمت بخرید و منتظر ثروت بمانید!

buy at the lowest price ever buy and hold for make a furtune

FalconLineTrading
Ontology (ONT): آیا این کوین به کف قیمتی رسیده؟ استراتژی خرید پلهای برای سود ۳۰۰٪!
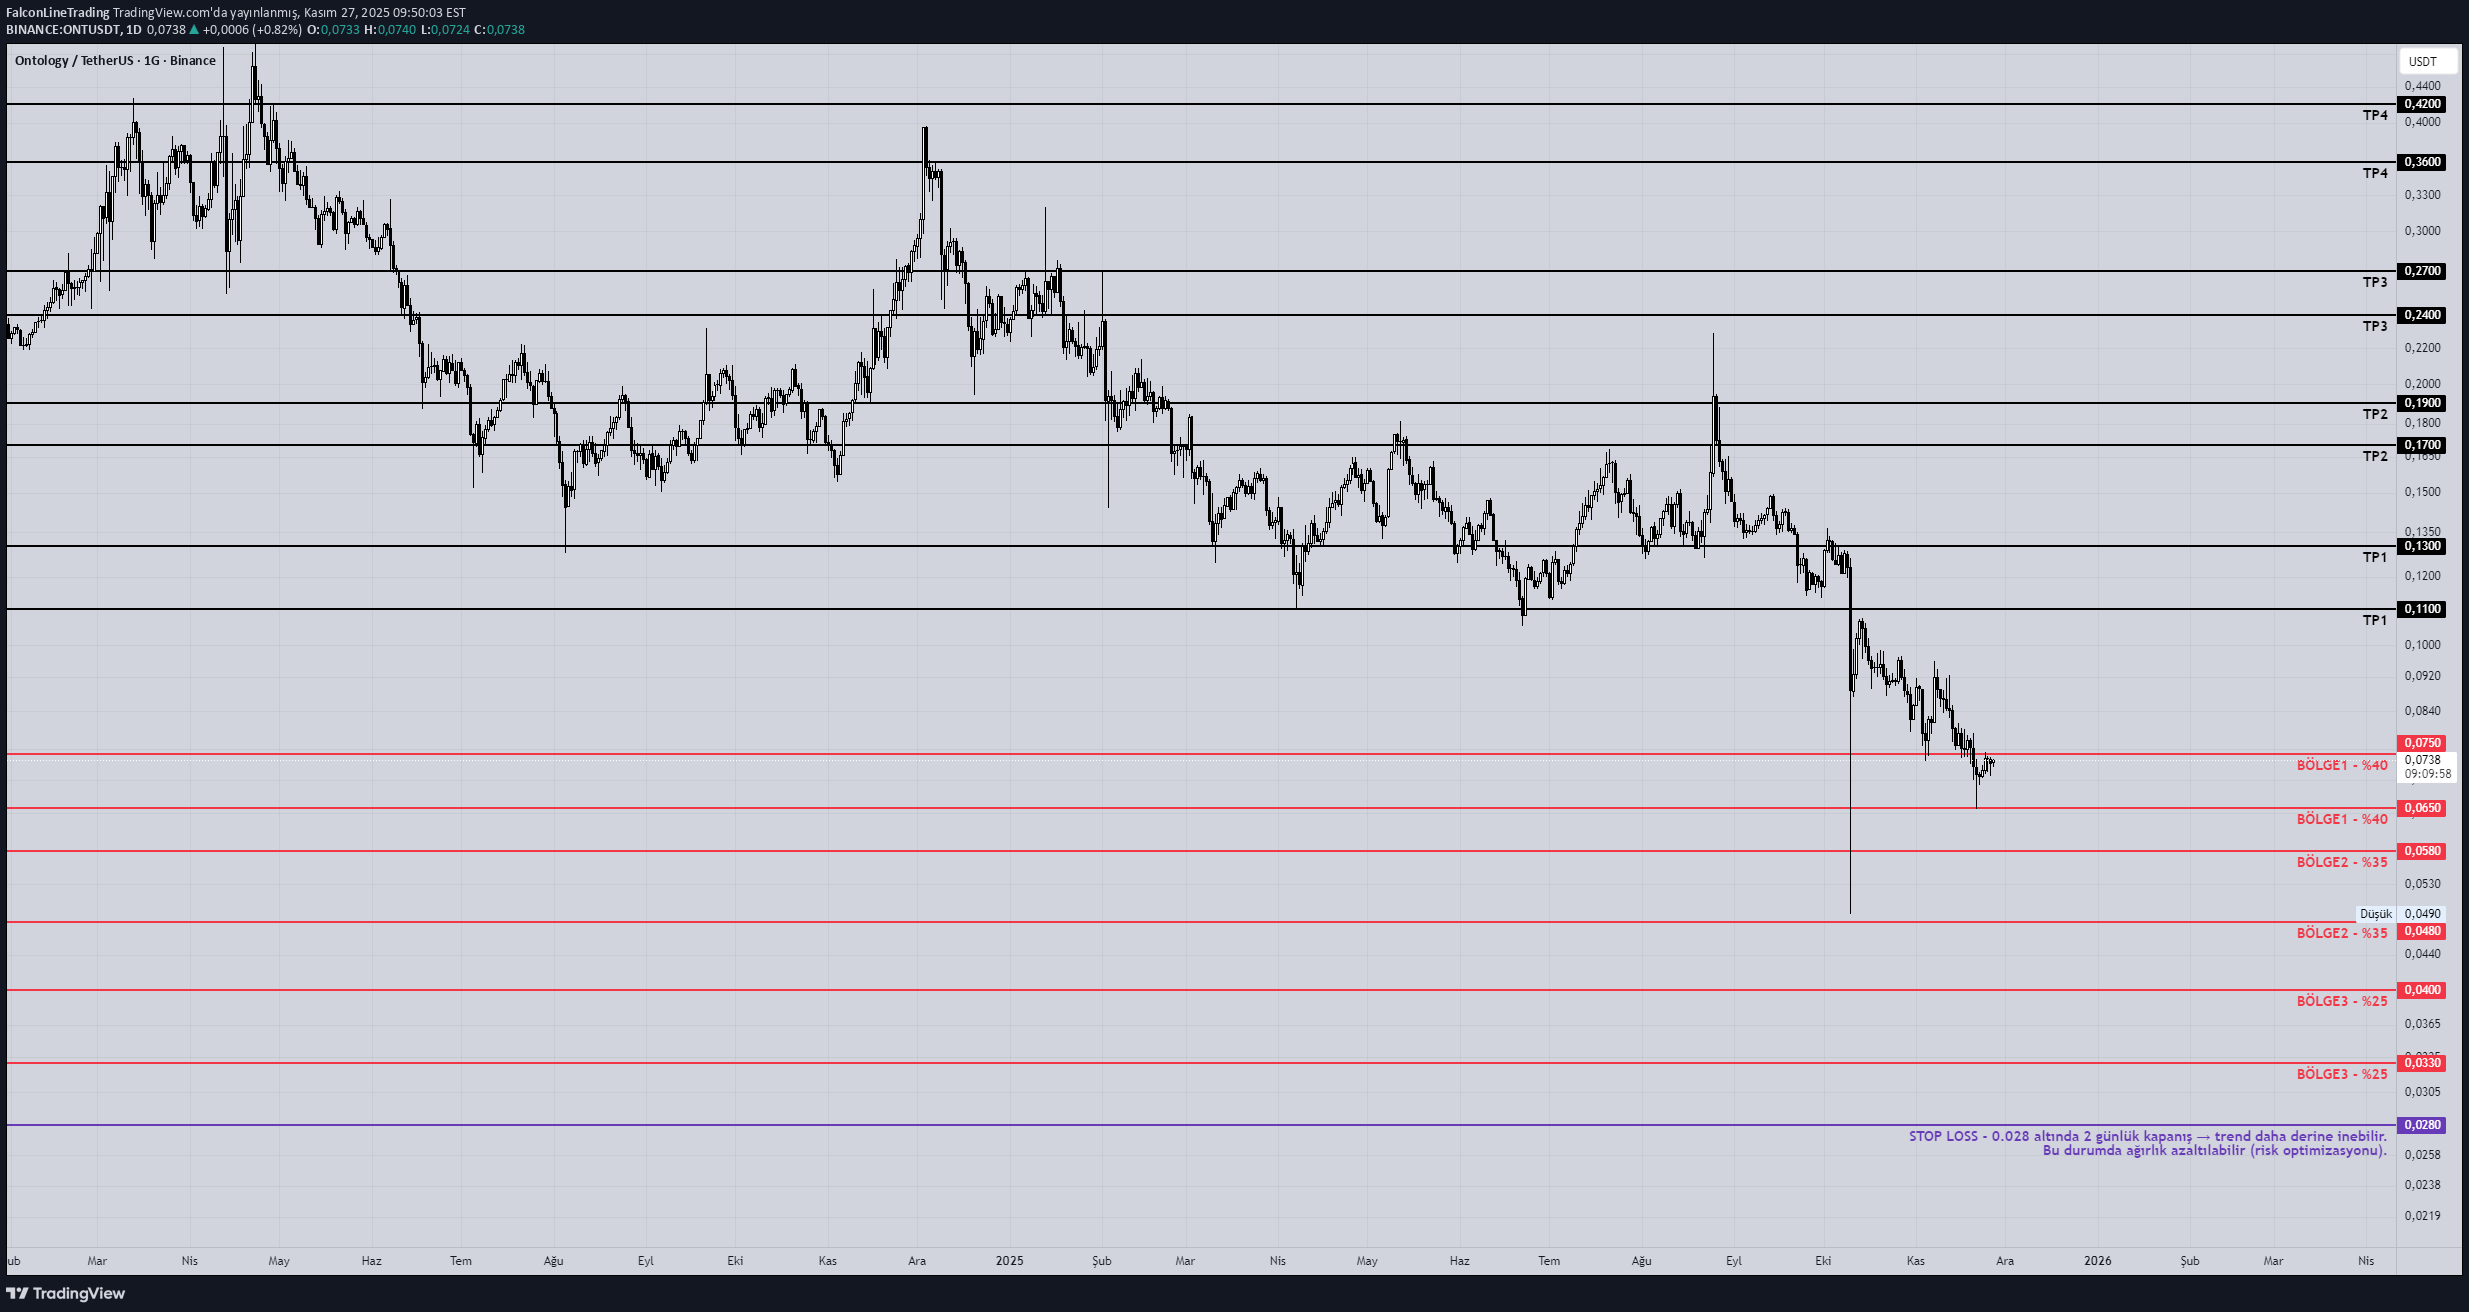
Ontology (ONT) — December 1, 2025 MainNet V3.0.0 Confidence: 100% Impact Analysis •New tokenomics + locked liquidity •This type of updates reduces supply pressure → positive Market Impact •Minor rise before the event •Not large cap → Pump/dump risk is high ----------------------------------------------- ONT – Multi-Term Trend Diagnosis 1M (Monthly) – Macro Trend It has been in a persistent downtrend since 2018. All highs are lower → all lows are lower. Monthly candles have long shadows and weak bodies → aggressive seller pressure. Volatility has decreased in recent months → bearish fatigue + signal of an upcoming bottom. Monthly outlook: Strong bear trend but approaching the bottom zone. 1W (Weekly) – HTF Yapı There has been a descending channel and a stable downward flow in the weekly for the last 2 years. There was a liquidity “flush” in two places: 0.06 region 0.05–0.045 region These wicking areas are typical fundraising bottoms. Weekly → bottom range: 0.045 – 0.065 1D (Daily) – Midterm Trend Every lower high broken on the daily → seller strength prevails. RSI, vol and market structure tell the same story: The trend is down but the momentum is weakening. 0.07–0.08 region is minor resistance. celebrity view: Reactions come, but the trend has not returned. 4H (Operation Time) – LTF Entry Fields In 4H, the range between 0.06 and 0.065 has been defended over and over again. LTF bullish market structure but there is no continuation. The rising trend does not start → this region is in the “accumulation under distribution” class. 4H: The best entry area is only in the bottom areas. ONT – Spot Strategy (Gradual, Professional) Classic retail mistake: “Will he return from here?” To buy from the middle. StrategyM: Low risk + multi-time confirmation + event aware dip buying. PURCHASE ZONES (Spot Accumulation) 1) Zone A – 0.065 – 0.075 Uptake: 40% 4H demand area Where daily bounces begin First liquidity return happens here 2) Zone B – 0.048 – 0.058 Uptake: 35% Weekly bottom pool Corporate long-term collection Strongest historical support 3) Zone C – 0.033 – 0.040 Purchase: 25% Monthly liquidity clearing Capitulation zone If it returns from here, it gives a cycle reversal with 300–500% potential. STOP-LOSS Logic (For Spot) I do not recommend hard SL in spot strategy, but: 2-day close below 0.028 → trend may go deeper. In this case, the weight can be reduced (risk optimization). TP Levels (Professional Exit Plan) TP1 – 0.11 – 0.13 4H+1D main distribution line First realization zone TP2 – 0.17 – 0.19 2024–2025 horizontal resistance zone TP3 – 0.24 – 0.27 Midterm range top In-cycle mini hills TP4 – 0.36 – 0.42 Main bullish scenario major wick filling area after 2021 Critical Note (Event Aware Strategy) Bro, this ONT strategy I gave you was optimized to be compatible with the event grids you sent: Risk-on event: Buying from Zone A is made aggressive. Risk-off event: It makes sense to wait in Zones B and C and target deeper bottoms. High-volatility macro trigger: HTF points to the bottom regions (0.048–0.055). Summary: ONT What Does It Say? In macro bear trend, Close to the bottom area, Trend reversal has not started yet, But it has become the area of interest of large funds. Coins from this structure generally have cycle returns between +200% and +600%. The main thing is to take it gradually and be patient.

Bithereum_io
تحلیل تکنیکال ONT/USDT: آیا کفسازی برای جهش بزرگ آغاز شده است؟ (اهداف صعودی تا ۰.۲۶ دلار)
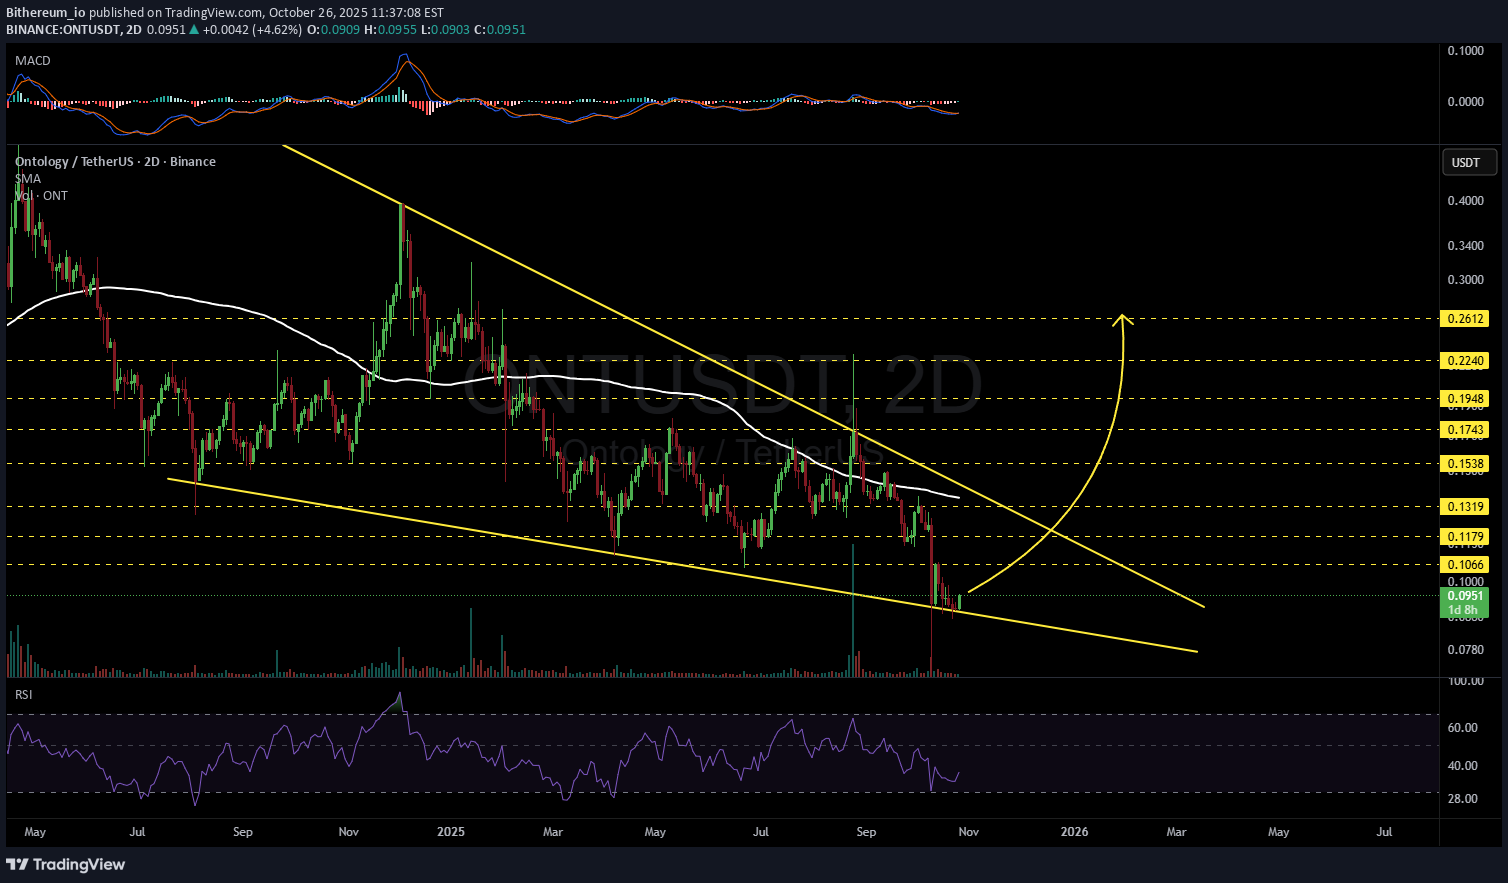
#ONT is moving inside a falling wedge pattern on the 2-day timeframe chart and is currently sitting on the wedge support line. In case of a successful bounce, we can expect a bullish move toward: 🎯 $0.1066 🎯 $0.1179 In case of a breakout above the wedge resistance and the 2-day SMA100, the potential targets are: 🎯 $0.1319 🎯 $0.1538 🎯 $0.1743 🎯 $0.1948 🎯 $0.2240 🎯 $0.2612 ⚠️ Always remember to use a tight stop-loss and maintain proper risk management.

pullbacksignal
ONTUSDT için İşlem Sinyali
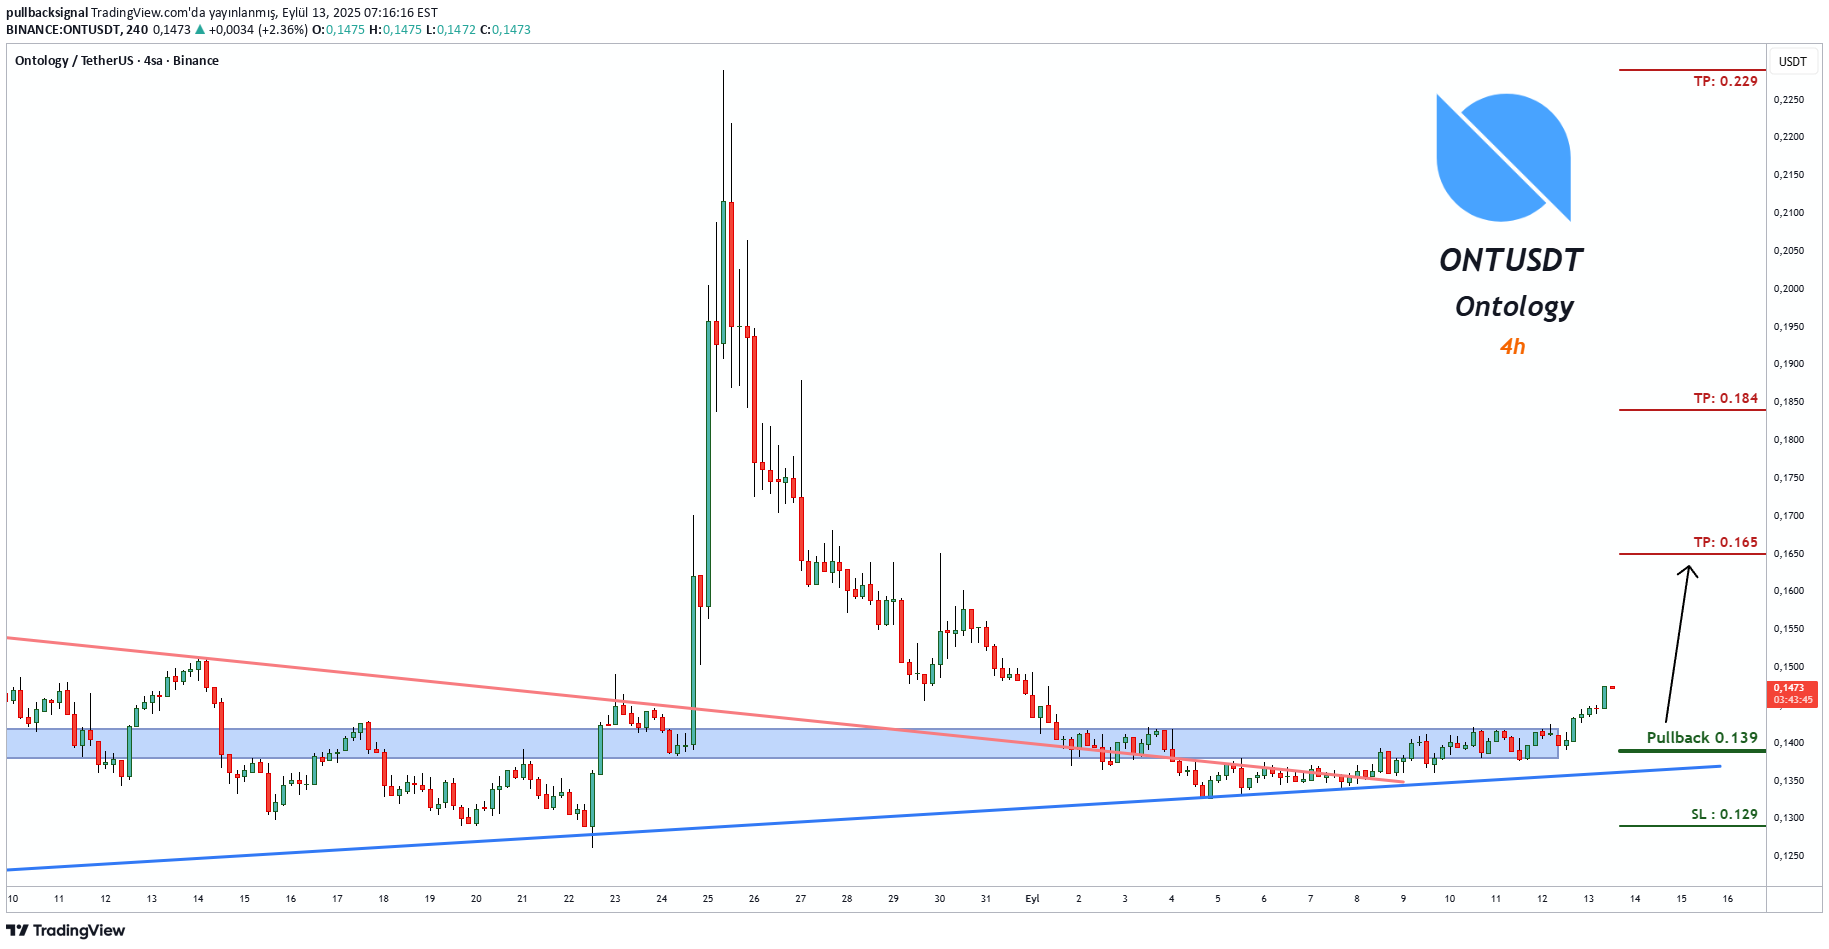
İşlem Kurulumu: ONTUSDT Ontolojisinde bir İşlem Sinyali görülmektedir (4 saat) İşlemciler ŞİMDİ Alım İşlemlerini açabilirler. ⬆️Şimdi Al veya 0,139'dan Al ⭕️SL @ 0,129 🔵TP1 @ 0,165 🔵TP2 @ 0,184 🔵TP3 @ 0,229 Bu sinyaller neye dayanmaktadır? Klasik Teknik Analiz Fiyat Hareketi Mum Grafikleri Fibonacci RSI, Hareketli Ortalama, Ichimoku, Bollinger Bantları Risk Uyarısı Forex, CFD, Kripto, Vadeli İşlemler ve Hisse Senetleri ticareti kayıp riski içerir. Lütfen bu tür işlemlerin sizin için uygun olup olmadığını dikkatlice değerlendirin. Geçmiş performans, gelecekteki sonuçların göstergesi değildir. Fikirlerimizi beğendiyseniz, lütfen beğenileriniz 👍 ve yorumlarınızla bizi destekleyin.
pullbacksignal
Trading Signal For ONTUSDT
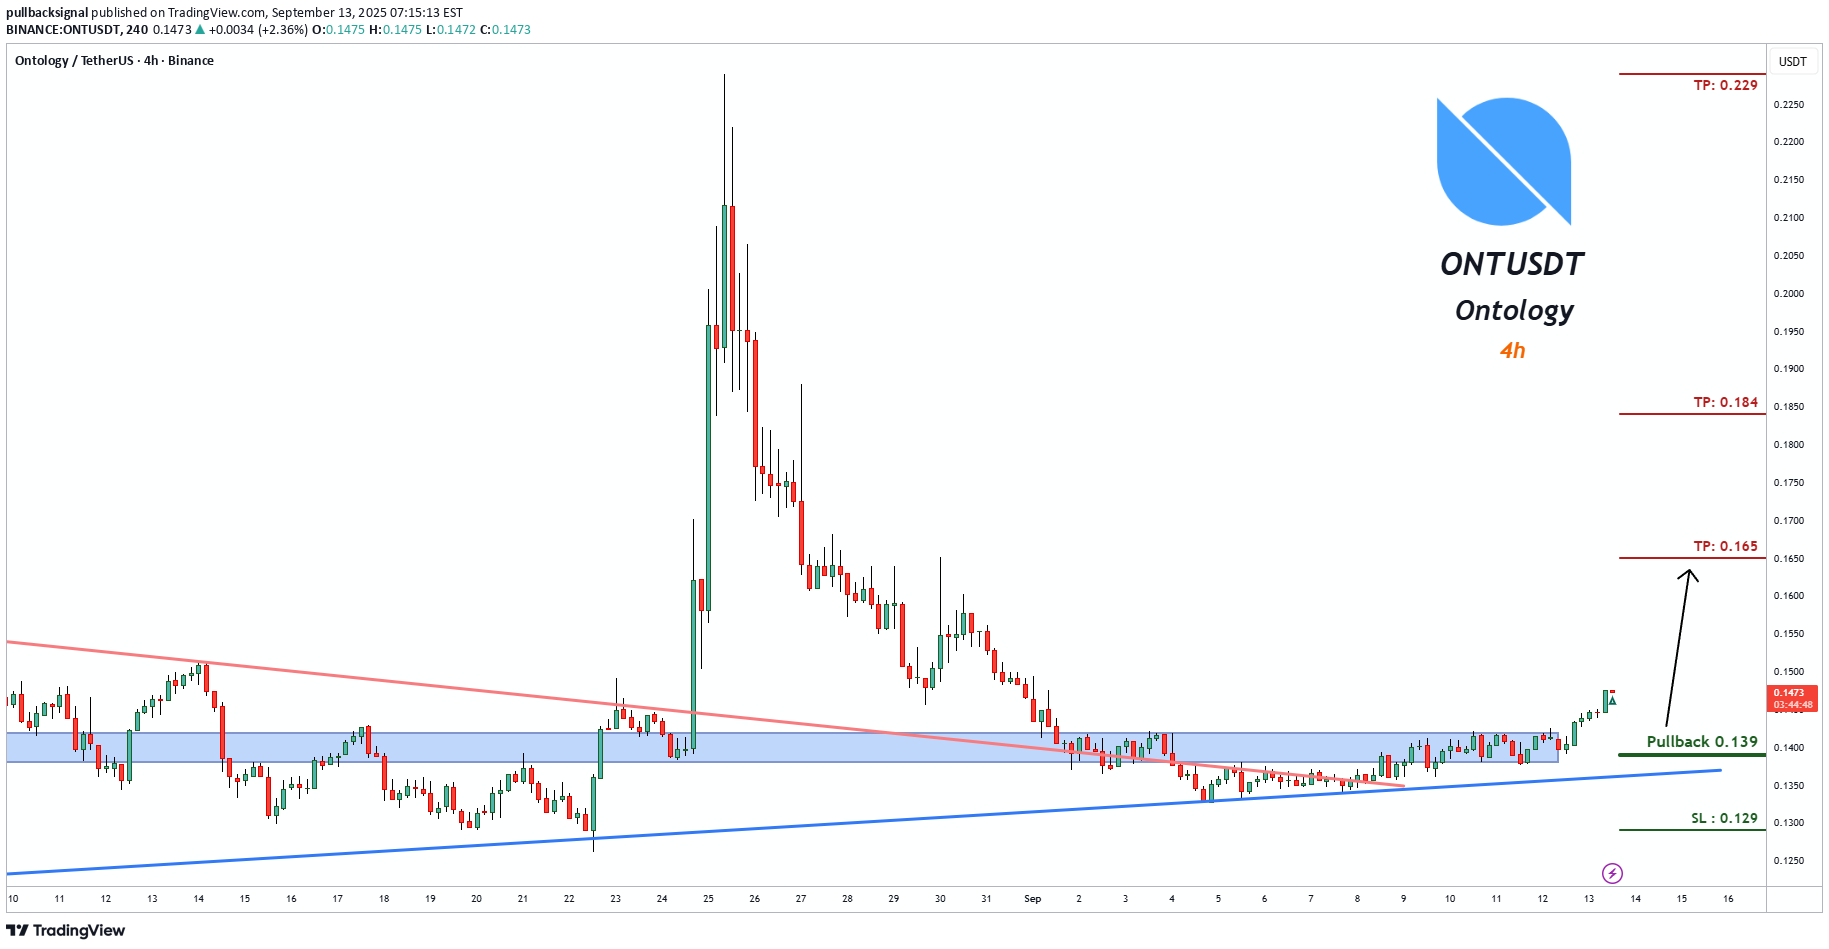
Trading Setup: A Trading Signal is seen in the ONTUSDT Ontology (4h) Traders can open their Buy Trades NOW ⬆️Buy now or Buy on 0.139 ⭕️SL @ 0.129 🔵TP1 @ 0.165 🔵TP2 @ 0.184 🔵TP3 @ 0.229 What are these signals based on? Classical Technical Analysis Price Action Candlesticks Fibonacci RSI, Moving Average , Ichimoku , Bollinger Bands Risk Warning Trading Forex, CFDs, Crypto, Futures, and Stocks involve a risk of loss. Please consider carefully if such trading is appropriate for you. Past performance is not indicative of future results. If you liked our ideas, please support us with your likes 👍 and comments .

CryptoNiche
Can Ontology Print USDT for Us?
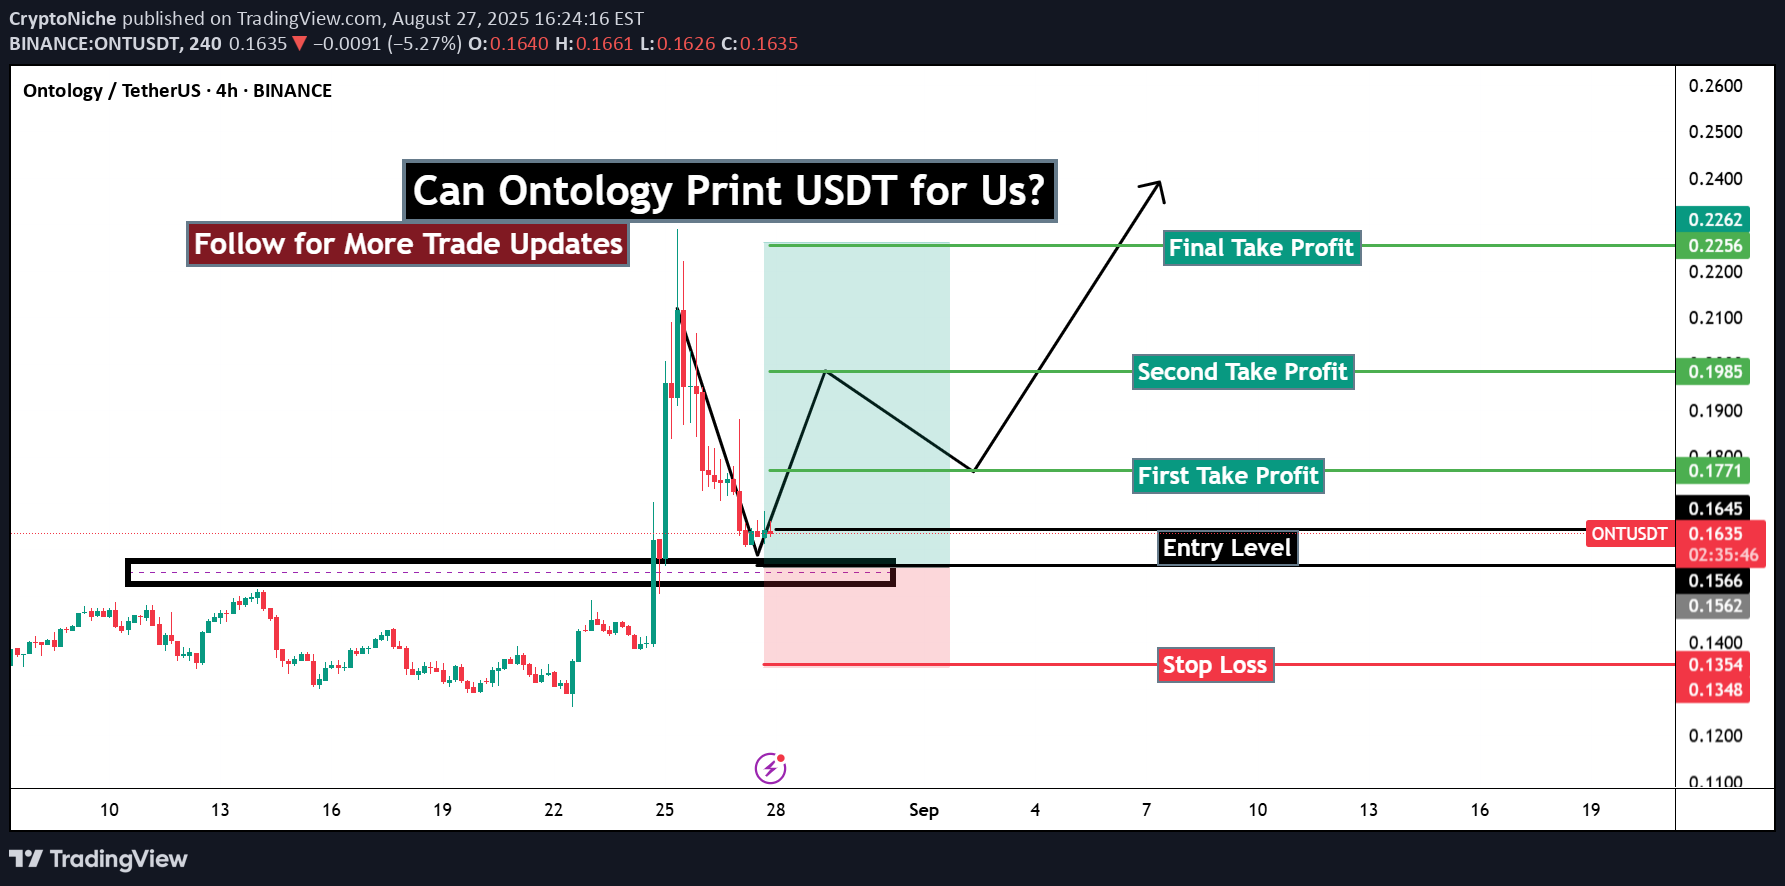
This is my thesis on ONTUSDT It is due for a new pump; this is not a hit-and-run trade. It may take a few weeks before we reach our targets. Be patient. ONT is an OG coin; it may print. What do you think about this trade? Let me know your thoughts in the comment box. If you like my analysis, please like it and follow me for more.Let us see how far we can go on this.

Alpha-GoldFX
ONTUSDT Forming Bullish Momentum
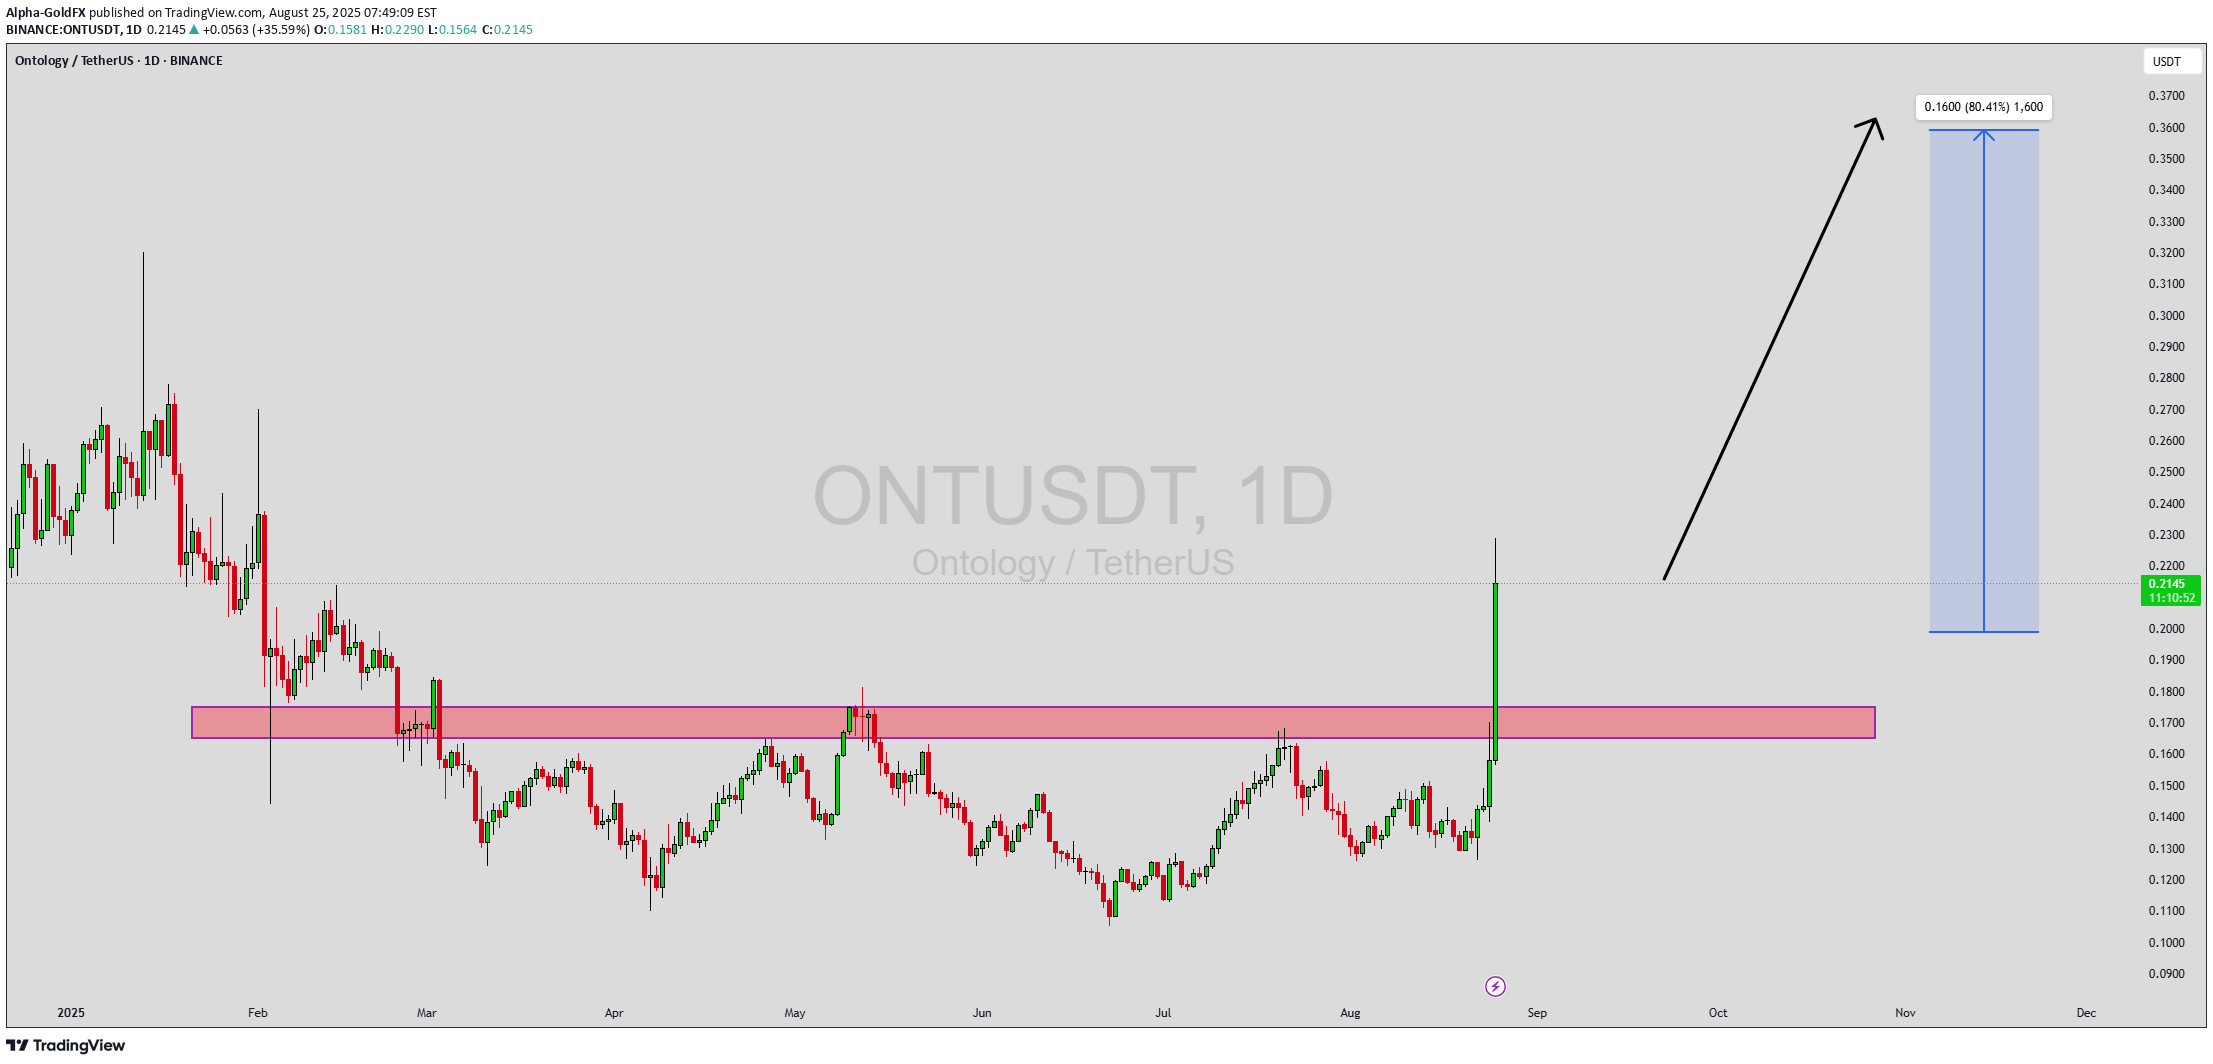
ONTUSDT has recently shown a strong breakout move with impressive momentum, pushing above a key resistance zone that previously acted as a ceiling for months. This breakout, supported by strong volume, is a strong indicator of renewed bullish sentiment and growing market participation. Such aggressive moves often set the stage for further continuation, especially when buyers step in to defend the breakout levels. The chart suggests that ONTUSDT has cleared a major consolidation phase, which signals the end of market indecision. With bulls in control, the next target zone projects a potential 70% to 80% gain from current levels. This aligns with the broader momentum shift seen across mid-cap altcoins, where strong technical setups are attracting fresh investor interest. Sustaining above the breakout level will be crucial to confirming further upside potential. Investor interest in ONT is clearly increasing as the breakout highlights a renewed trend direction. With market confidence building and momentum indicators supporting the rally, this coin could see strong buying pressure in the sessions ahead. Both short-term traders and long-term investors are closely watching ONTUSDT for its potential to deliver substantial gains. ✅ Show your support by hitting the like button and ✅ Leaving a comment below! (What is You opinion about this Coin) Your feedback and engagement keep me inspired to share more insightful market analysis with you!

CryptoWithJames
ONTUSDT UPDATE
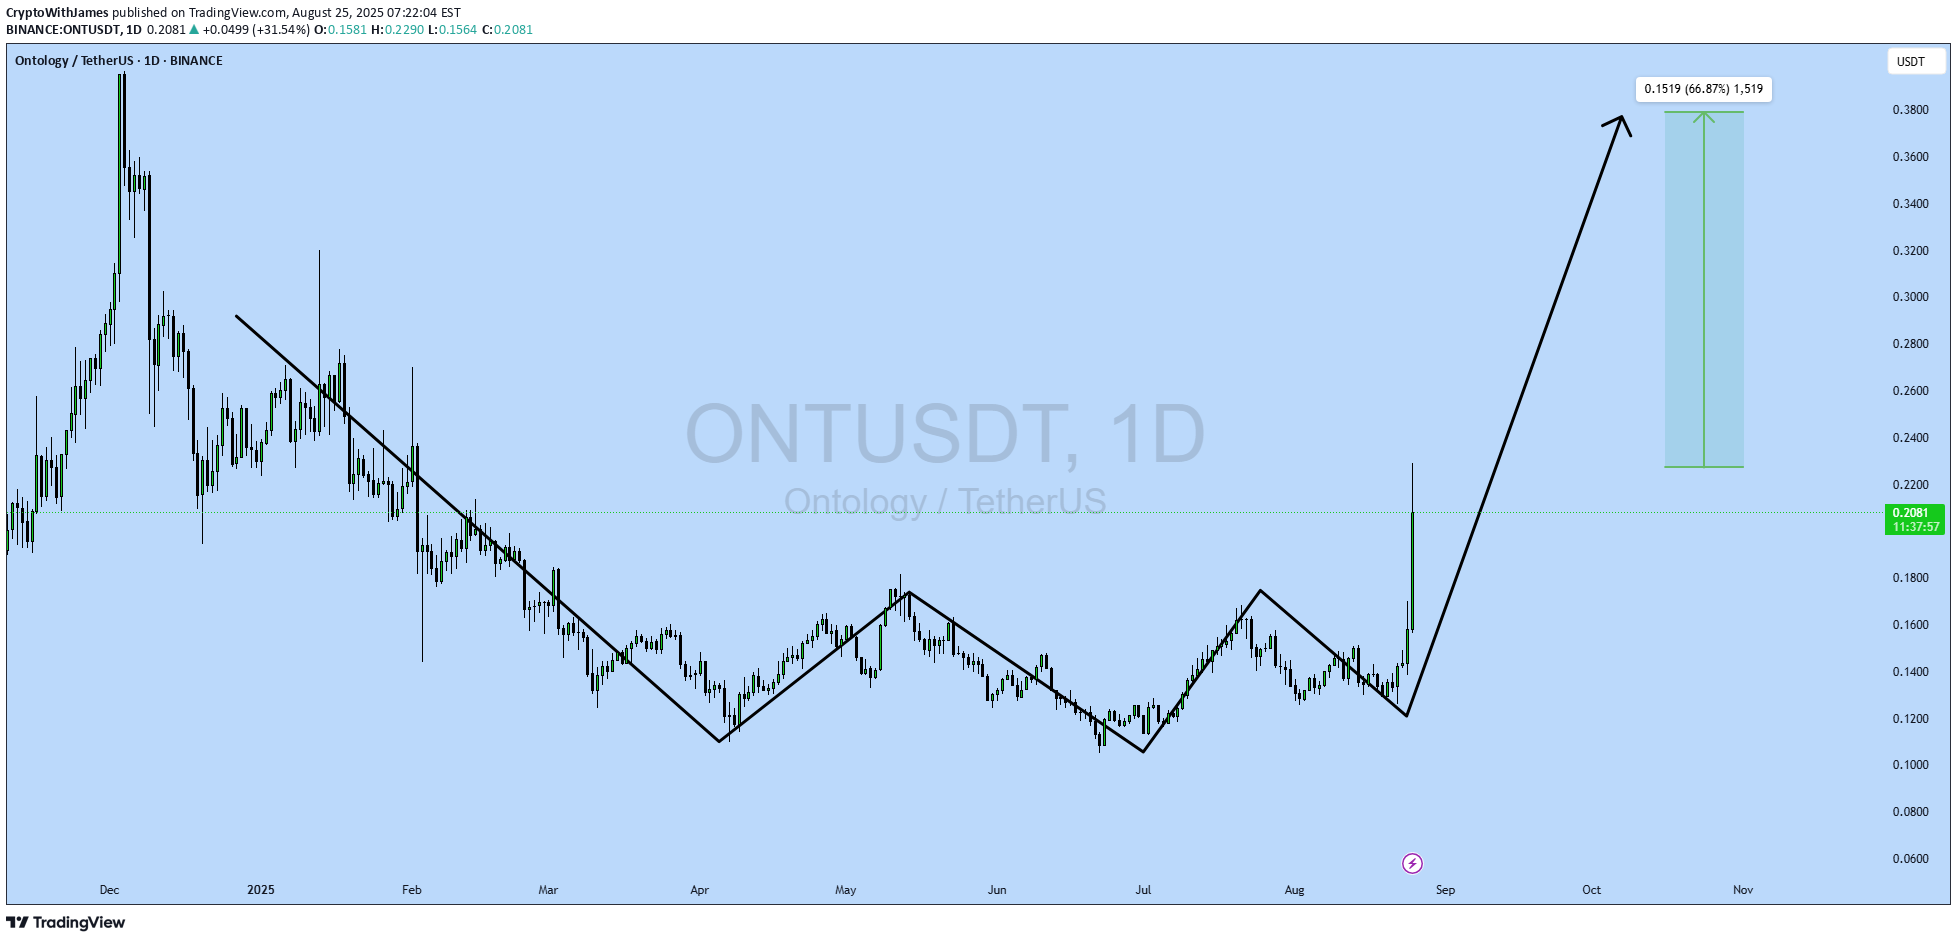
#ONT UPDATE ONT Technical Setup Pattern : Bullish Wave Pattern Current Price: $0.2078 Target Price: $0.36 Target % Gain: 66% Technical Analysis: ONT has broken out of a bullish wave structure on the 1D chart with a strong volume spike and price surge of over 30%. The breakout above resistance confirms bullish momentum with potential continuation toward $0.36. Time Frame: 1D Risk Management Tip: Always use proper risk management.

AltcoinPiooners
$ONT Explosive Bullish Leap Ignites the Market!
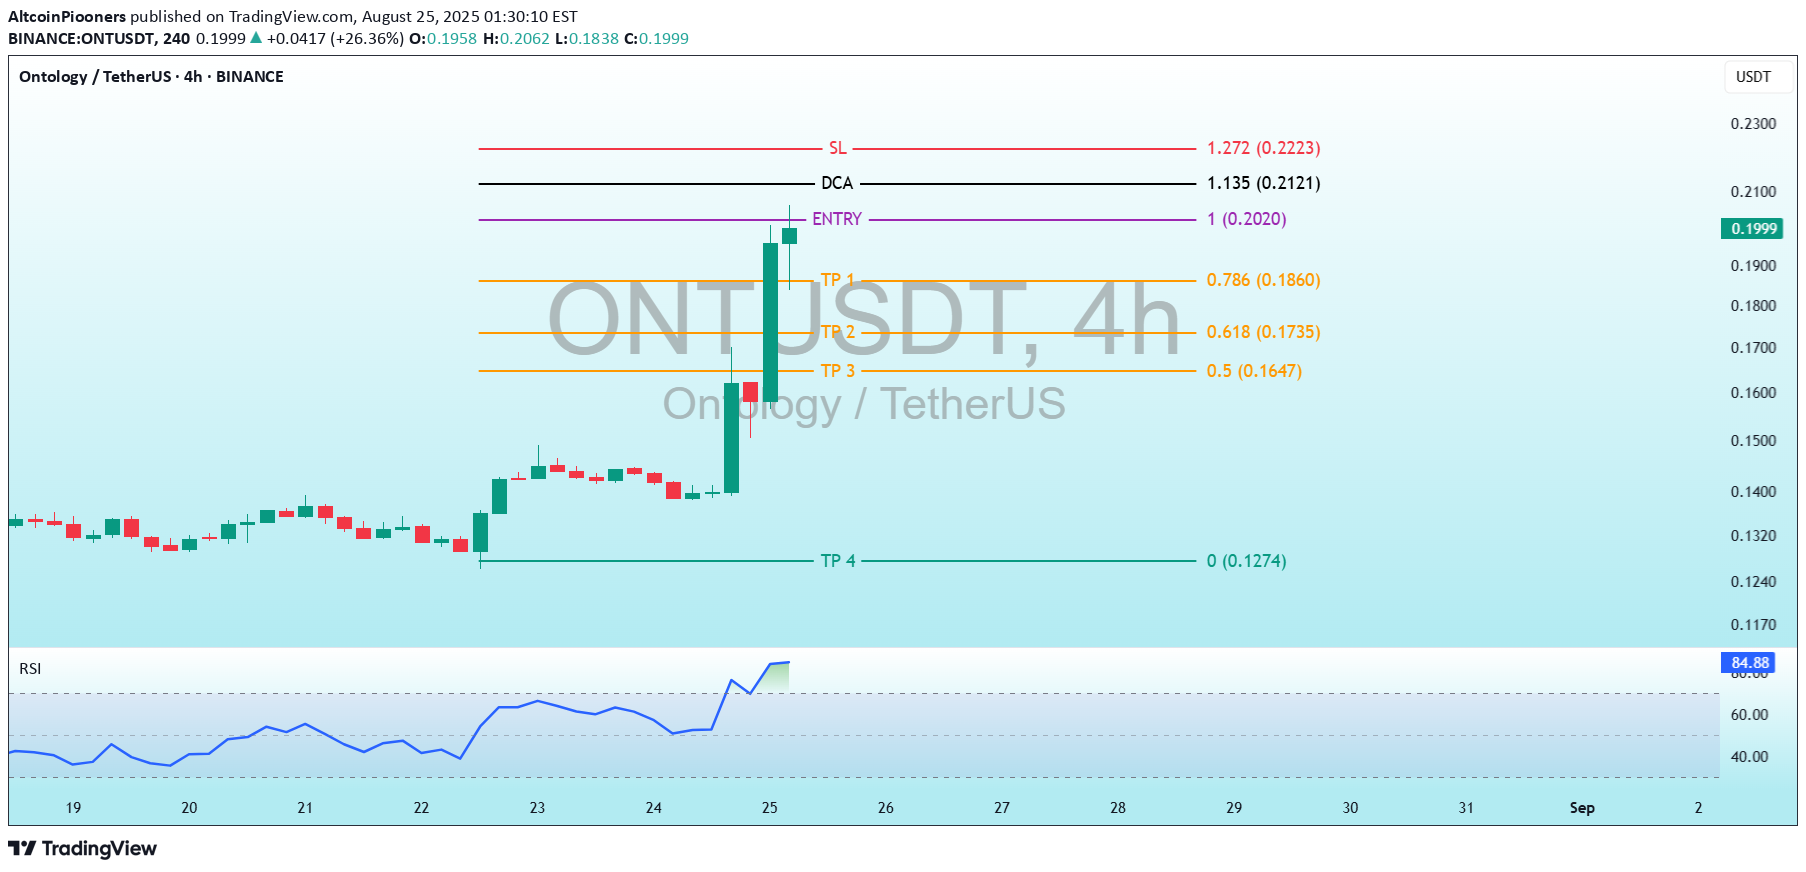
ONTUSDT Price Levels (as marked on the chart): SL (Stop Loss): 1.272 (0.2198) DCA (Dollar Cost Averaging): 1.135 (0.2098) Entry: 1.0 (0.2000 - 0.1980) TP1 (Take Profit 1): 0.786 (0.1845) TP2 (Take Profit 2): 0.618 (0.1723) TP3 (Take Profit 3): 0.5 (0.1637) TP4 (Take Profit 4): 0.1274 Current Price: Approximately 0.1989 (based on the right-side price scale) RSI (Relative Strength Index): Shown at the bottom, indicating momentum. The RSI has recently risen to 85 - 84 , suggesting growing bullish momentum. Key Levels: The price has risen above the Entry level (1.0 or 0.2000) and is currently below the DCA (1.135 or 0.2098) and SL (1.272 or 0.2198) levels, indicating the trade is in profit and the stop-loss has not been triggered. It is approaching TP1 (0.786 or 0.1845). The take-profit levels seem slightly misaligned with the current price scale, but the upward trend suggests potential to reach TP1 soon. Support and Resistance: The sharp rise indicates increasing buying pressure. The previous support around 0.2000 (entry) has held, and the next resistance could be near the DCA level (0.2098) if the uptrend continues. RSI Analysis The RSI at the bottom shows an upward trend, moving from a neutral region (around 50) to 85 - 84, indicating growing bullish momentum. It is approaching the overbought threshold (70), suggesting caution for a potential pullback. The recent spike aligns with the price surge, confirming renewed market interest. Trading Strategy Insights Entry and Exit Points: The chart suggests a trading plan with an entry at 1.0 (0.2000), a stop-loss at 1.272 (0.2198), and take-profit levels (TP1 to TP4). The price is nearing TP1, indicating early profitability. Risk Management: The SL at 0.2198 is above the current price (0.1989), meaning the trade is secure. Adjusting the stop-loss to break even or above the entry could lock in gains. Potential Next Steps: If the uptrend persists, TP1 (0.1845) is the next target. The RSI at 85 - 84 suggests momentum is strong but nearing overbought conditions, so traders should watch for a possible reversal or consolidation.
Disclaimer
Any content and materials included in Sahmeto's website and official communication channels are a compilation of personal opinions and analyses and are not binding. They do not constitute any recommendation for buying, selling, entering or exiting the stock market and cryptocurrency market. Also, all news and analyses included in the website and channels are merely republished information from official and unofficial domestic and foreign sources, and it is obvious that users of the said content are responsible for following up and ensuring the authenticity and accuracy of the materials. Therefore, while disclaiming responsibility, it is declared that the responsibility for any decision-making, action, and potential profit and loss in the capital market and cryptocurrency market lies with the trader.