
OM
MANTRA DAO
| تریدر | نوع سیگنال | حد سود/ضرر | زمان انتشار | مشاهده پیام |
|---|---|---|---|---|
No results found. | ||||
Price Chart of MANTRA DAO
سود 3 Months :
خلاصه سیگنالهای MANTRA DAO
سیگنالهای MANTRA DAO
Filter
Sort messages by
Trader Type
Time Frame

stanleycrypto_1
700% Potential: $OMUSDT at Key Support.
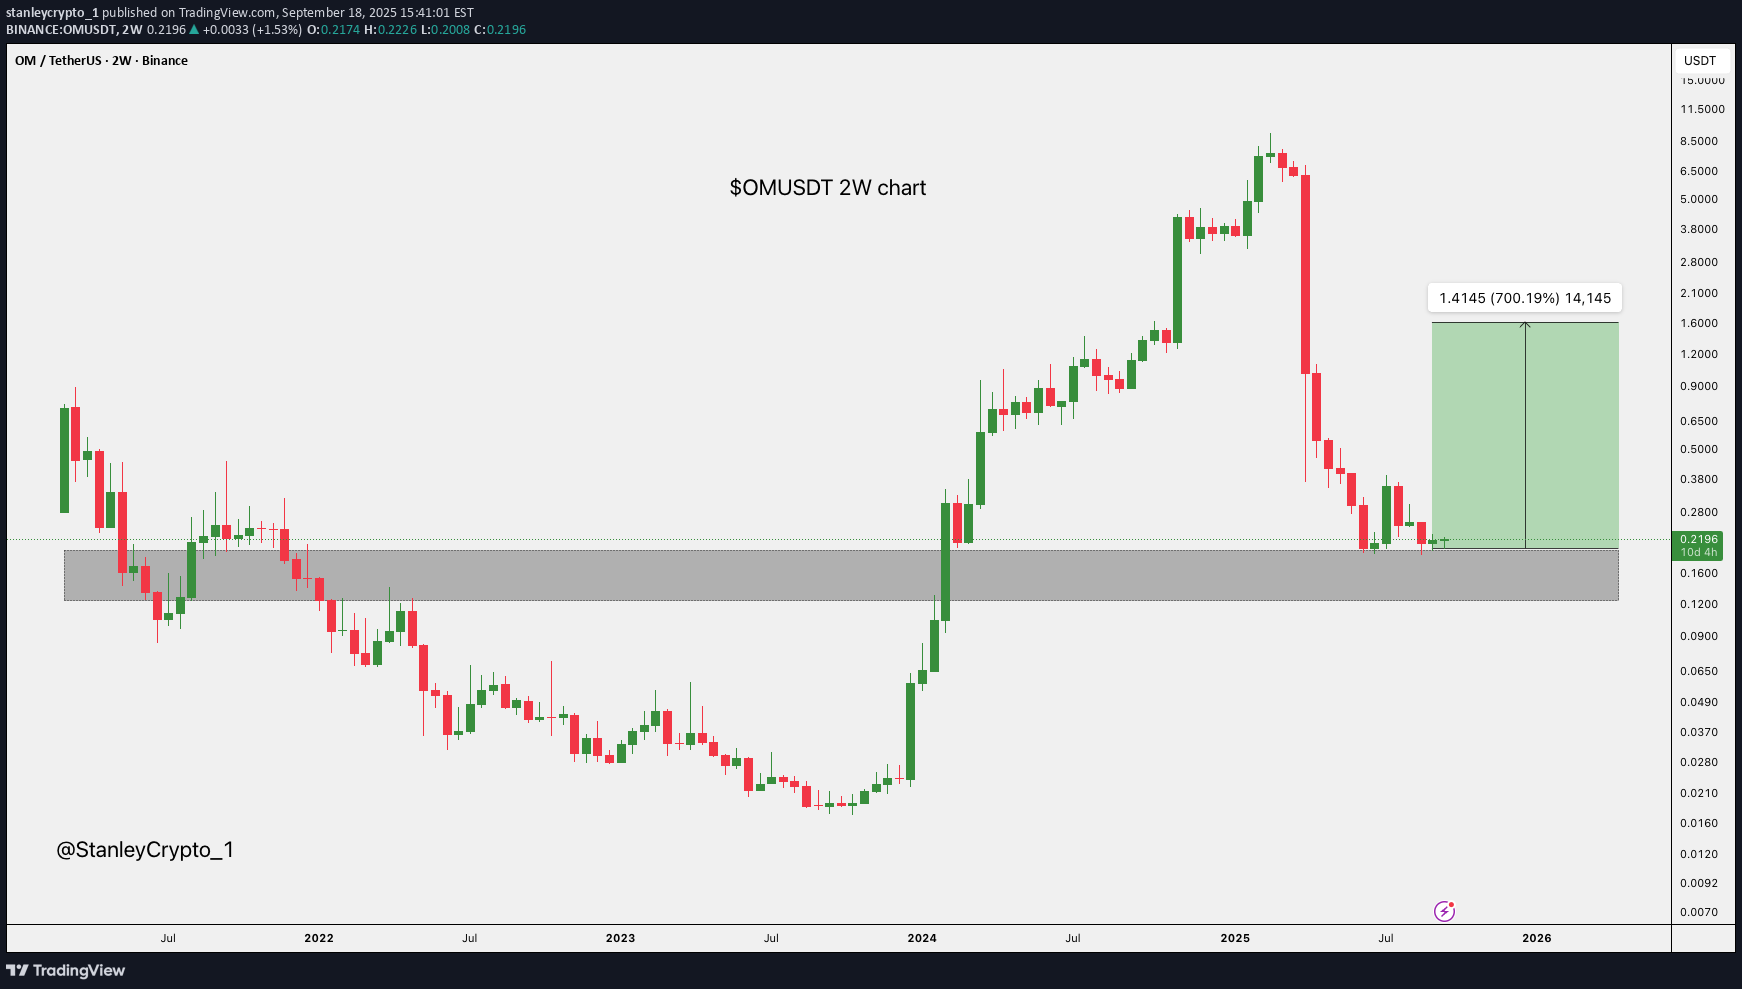
The OM chart shows price testing a key support zone around 0.2195, with a huge upside potential if it holds. A 700% gain could be possible, targeting 1.6165. Watch for confirmation above this level before jumping in. DYOR, NFA

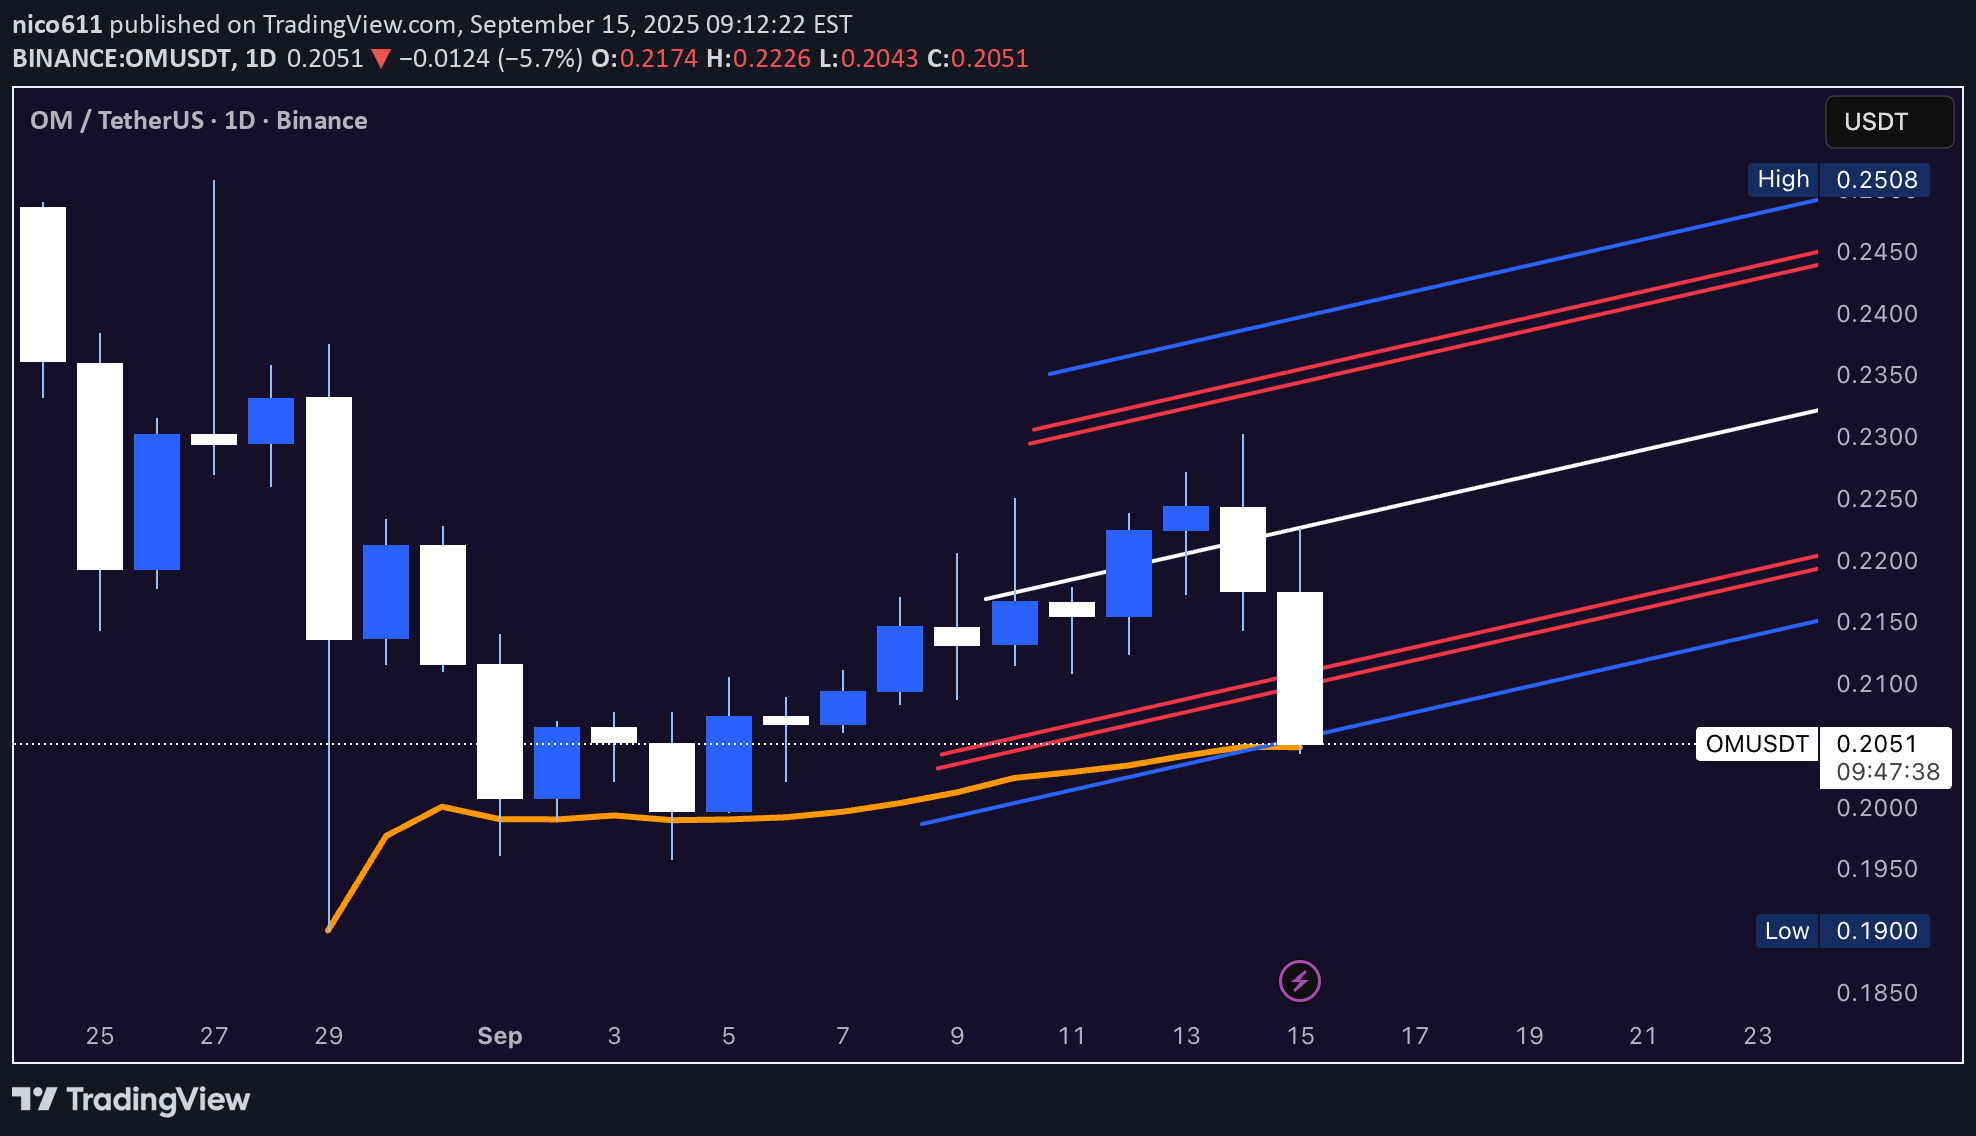
nico611

burhanercan2828
om usdt

I have drawn important resistances and the last target I expected in the daily graph.

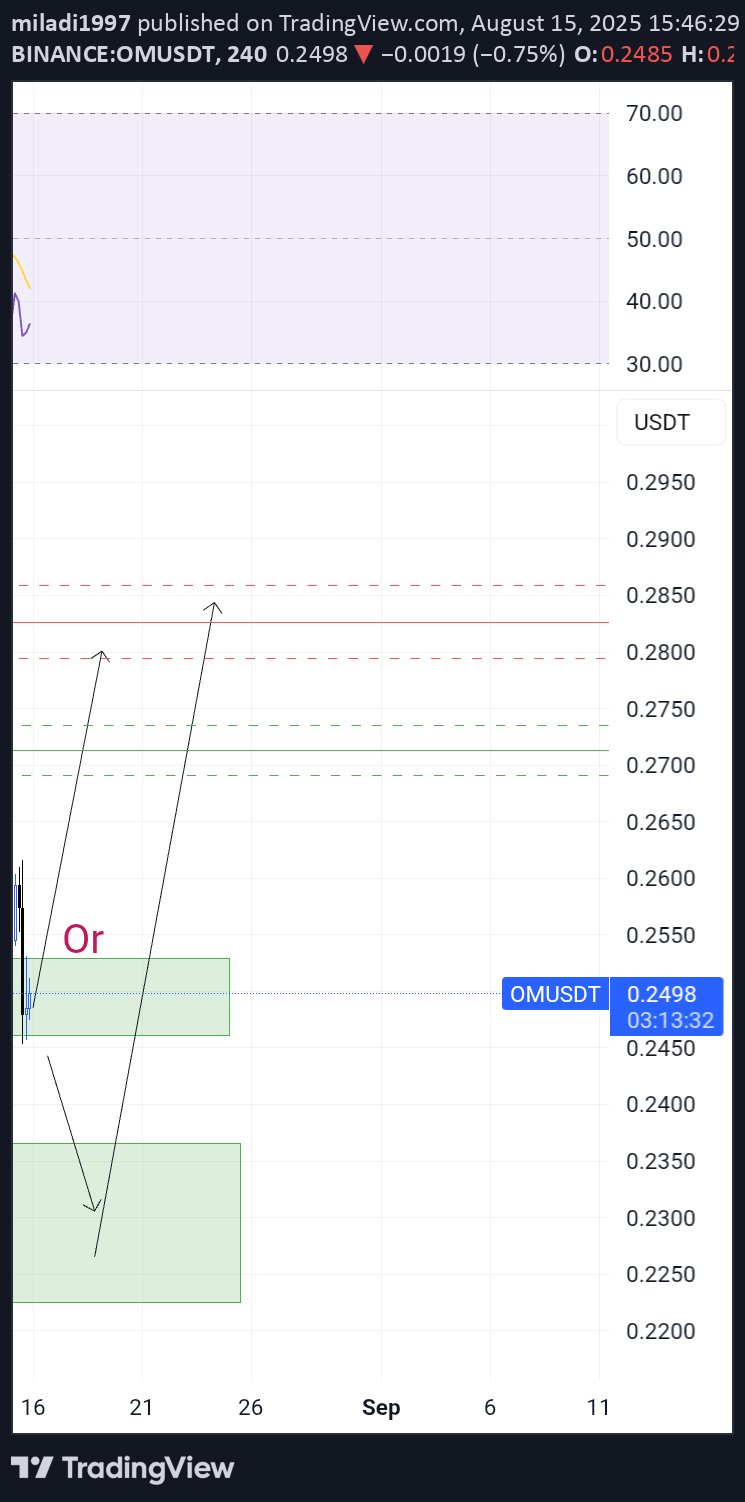
AminAli7007
Approximately 92.6% decline OM Token

🚨 IMPORTANT RISK AND LIABILITY DISCLAIMER: Attention: This analysis is solely a prediction and does not constitute any form of financial advice. Trading in financial markets carries a high level of risk and may lead to the loss of your capital. Before making any financial decisions, consult with a qualified professional advisor. 📉 Technical Analysis [OMUSDT] - High Risk Warning 📉 🎯 Predicted Target: $0.0175 (Approximately 92.6% decline) Final Note: This analysis is provided based solely on technical examination. Fundamental factors and new developments can quickly invalidate this prediction. Always seek multiple analytical sources and never make investment decisions based on a single opinion. Risk Warning: Financial markets are inherently volatile and may result in the complete loss of capital. This analysis should not be interpreted as financial advice or a solicitation to buy or sell.
nico611


OMUSDT
Lets join us! 2 strategy can happen! Both of them will rich .2800 or more... Candle stick pattern in daily will happen tomorrow and it will grow!😁

volkanakman82
OM(MANTRA) ATEŞİ YENİDEN YAKTI
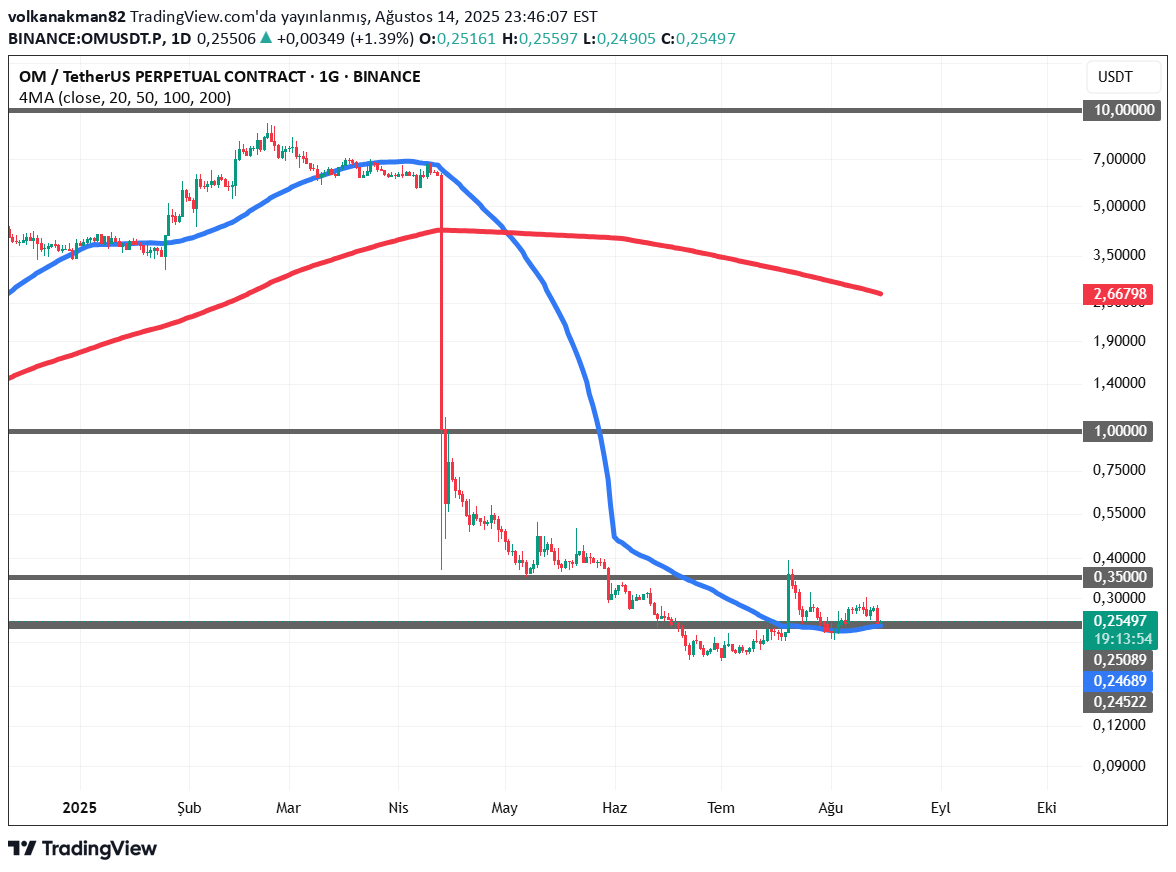
Who would know that he would come here from 9 dollars? Yes, it is almost impossible to predict such a decline .. But it is not that impossible to predict the rise again. As long as the MA50 holds above the MA50, my first tracking level is 0.35 if it continues to receive daily closing, the critical target is $ 1. When he comes there, we need to look again .. See you in $ 1

Alpha-GoldFX
OMUSDT Forming Descending Channel

OMUSDT (OM / TetherUS) is currently showing a textbook descending channel breakout on the daily chart. After a steep downtrend, price has formed a tightening channel and is now pushing upward—signalling a potential major reversal. The breakout is supported by solid volume, suggesting accumulation and renewed investor confidence. This technical foundation comes amid an asset that has suffered a deep correction—down over 90% from its all-time high. Despite this, OM still maintains interest thanks to ongoing development and a committed team working toward recovery. In that context, the current wave of momentum offers a compelling high-reward opportunity. Analysts tracking the setup note that a confirmed channel breakout could lead to an explosive move—potentially targeting 290% to 300% gains from current levels, given the absence of nearby resistance and the strength of the impulse wave already in motion. In summary: * A descending channel has broken, signaling a potential trend reversal. * Good volume validates the strength behind this move. * OM remains a speculative but high-upside candidate—as long as investors are cautious of its volatile history. This setup is ideal for breakout-focused traders with high risk tolerance and a structured plan. ✅ Show your support by hitting the like button and ✅ Leaving a comment below! (What is Your opinion about this Coin) Your feedback and engagement keep me inspired to share more insightful market analysis with you!

Filnft
OM big long to $0.3572


Crypto-by-PRIME
OM / USDT : Breaking out from Trendline resistance

OMUSDT has broken above a descending trendline on the 4H timeframe after multiple rejections in recent weeks. This breakout could signal a shift in momentum from bearish to bullish. If price holds above the breakout level around 0.262, the next potential target lies near 0.31, representing an estimated 19% upside from current levels. Key points: Timeframe: 4H Setup: Descending trendline breakout Breakout level: ~0.262 Target: ~0.31 (+19%) Stop loss: Below breakout level to manage risk As always, wait for confirmation and manage risk appropriately before entering a trade.OM / USDT +8% profit so far....Expecting more
Disclaimer
Any content and materials included in Sahmeto's website and official communication channels are a compilation of personal opinions and analyses and are not binding. They do not constitute any recommendation for buying, selling, entering or exiting the stock market and cryptocurrency market. Also, all news and analyses included in the website and channels are merely republished information from official and unofficial domestic and foreign sources, and it is obvious that users of the said content are responsible for following up and ensuring the authenticity and accuracy of the materials. Therefore, while disclaiming responsibility, it is declared that the responsibility for any decision-making, action, and potential profit and loss in the capital market and cryptocurrency market lies with the trader.